world.wikisort.org - USA
Montgomery County is the third-most populous county in the Commonwealth of Pennsylvania, and the 73rd-most populous in the United States. As of the 2020 census, the population of the county was 856,553, representing a 7.1% increase from the 799,884 residents enumerated in the 2010 census.[1] Montgomery County is located adjacent to and northwest of Philadelphia. The county seat and largest city is Norristown.[2] Montgomery County is geographically diverse, ranging from farms and open land in the extreme north of the county to densely populated suburban neighborhoods in the southern and central portions of the county.
Montgomery County | |
|---|---|
Pennsylvanian county | |
 Montgomery County Courthouse, May 2007 | |
 Flag | |
| Nickname: Montco | |
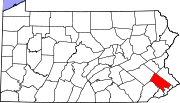
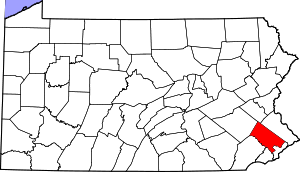 Location within the U.S. state of Pennsylvania | |
 Pennsylvania's location within the U.S. | |
| Coordinates: 40°13′N 75°22′W | |
| Country | |
| State | |
| Founded | September 10, 1784 |
| Named for | Richard Montgomery or Montgomeryshire |
| Seat | Norristown |
| Largest municipality | Lower Merion Township |
| Government | |
| • County Commissioners | Val Arkoosh , MD, MPH, Chair Kenneth E. Lawrence Jr., Vice Chair Joseph C. Gale, Commissioner |
| Area | |
| • Total | 487 sq mi (1,260 km2) |
| • Land | 483 sq mi (1,250 km2) |
| • Water | 4.2 sq mi (11 km2) 0.9%% |
| Population (2020) | |
| • Total | 856,553 |
| • Estimate (2021) | 860,578 |
| • Density | 1,773/sq mi (685/km2) |
| Time zone | UTC−5 (Eastern) |
| • Summer (DST) | UTC−4 (EDT) |
| Congressional districts | 1st, 4th, 5th |
| Website | www |

Montgomery County is included in the Philadelphia-Camden-Wilmington PA-NJ-DE-MD metropolitan statistical area, sometimes expansively known as the Delaware Valley. The county marks part of the Delaware Valley's northern border with the Lehigh Valley region of Pennsylvania. In 2010, Montgomery County was the 66th-wealthiest county in the country by median household income.
The county was created on September 10, 1784, out of land originally part of Philadelphia County. The first courthouse was housed in the Barley Sheaf Inn. It is believed to have been named either for Richard Montgomery, an American Revolutionary War general killed in 1775 while attempting to capture Quebec City, or for the Welsh county of Montgomeryshire (which was named after one of William the Conqueror's main counselors, Roger de Montgomerie), as it was part of the Welsh Tract, an area of Pennsylvania settled by Quakers from Wales.[3] Early histories of the county indicate the origin of the county's name as uncertain.
Geography
According to the United States Census Bureau, the county has a total area of 487 square miles (1,260 km2), of which 483 square miles (1,250 km2) are land and 4.2 square miles (11 km2) (0.9%) are covered by water.[4]
Major roads and highways
 I-76
I-76
 I-276 / Penna Turnpike
 I-476 / Penna Turnpike NE Extension
 US 1
US 1 US 30
US 30 US 202
 US 202 Bus.
 US 422
 PA 23
PA 23 PA 29
PA 29 PA 63
PA 63 PA 73
PA 73 PA 100
 PA 113
 PA 152
 PA 232
 PA 252
 PA 263
 PA 309
 PA 320
 PA 332
 PA 363
 PA 463
 PA 563
 PA 611
 PA 663
Adjacent counties
- Lehigh County (north)
- Bucks County (northeast)
- Philadelphia County (southeast)
- Delaware County (southwest)
- Chester County (west)
- Berks County (northwest)
National protected area
- Valley Forge National Historical Park (part)
Demographics
| Historical population | |||
|---|---|---|---|
| Census | Pop. | %± | |
| 1790 | 22,918 | — | |
| 1800 | 24,150 | 5.4% | |
| 1810 | 29,703 | 23.0% | |
| 1820 | 35,793 | 20.5% | |
| 1830 | 39,406 | 10.1% | |
| 1840 | 47,241 | 19.9% | |
| 1850 | 58,291 | 23.4% | |
| 1860 | 70,500 | 20.9% | |
| 1870 | 81,612 | 15.8% | |
| 1880 | 96,494 | 18.2% | |
| 1890 | 123,290 | 27.8% | |
| 1900 | 138,995 | 12.7% | |
| 1910 | 169,590 | 22.0% | |
| 1920 | 199,310 | 17.5% | |
| 1930 | 265,804 | 33.4% | |
| 1940 | 289,247 | 8.8% | |
| 1950 | 353,068 | 22.1% | |
| 1960 | 516,682 | 46.3% | |
| 1970 | 623,799 | 20.7% | |
| 1980 | 643,621 | 3.2% | |
| 1990 | 678,111 | 5.4% | |
| 2000 | 750,097 | 10.6% | |
| 2010 | 799,884 | 6.6% | |
| 2020 | 856,553 | 7.1% | |
| 2021 (est.) | 860,578 | [5] | 0.5% |
| U.S. Decennial Census[6] 1790–1960[7] 1900–1990[8] 1990–2000[9] 2010–2020[1] | |||
2020 census
As of the census of 2020, the county was 73.27% White (72.18% White, non-Hispanic), 9.55% Black or African American, 0.22% Native American or Alaskan Native, 7.94% Asian, 0.02% Pacific Islander, and 2.87% some other race; 6.13% were two or more races. 6.36% of the population were Hispanic or Latino of any race.[10]
| Race | Num. | Perc. |
|---|---|---|
| White (NH) | 618,244 | 72.2% |
| Black or African American (NH) | 79,510 | 9.3% |
| Native American (NH) | 763 | 0.1% |
| Asian (NH) | 67,761 | 8% |
| Pacific Islander (NH) | 168 | 0.02% |
| Other/Mixed (NH) | 35,595 | 4.2% |
| Hispanic or Latino | 54,512 | 6.4% |
2010 census
As of the census of 2010, the county was 79.0% White non-Hispanic, 8.7% Black or African American, 0.1% Native American or Alaskan Native, and 6.4% Asian (2.1% Indian, 1.7% Korean, 1.2% Chinese, 0.5% Vietnamese, 0.3% Filipino, 0.1% Japanese, 0.6% other Asian); 1.9% were two or more races, and 1.6% were some other race. About 4.3% of the population were Hispanic or Latino.
2000 census
As of the census[12] of 2000, 750,097 people, 286,098 households, and 197,693 families resided in the county. The population density was 1,553 inhabitants per square mile (600/km2). The 297,434 housing units averaged 238 units/km2 (616 units/sq mi). The racial makeup of the county was 86.46% White, 7.46% Black or African American, 0.11% Native American, 4.02% Asian, 0.03% Pacific Islander, 0.75% from other races, and 1.16% from two or more races. About 2.04% of the population were Hispanic or Latino of any race, 17.5% were of German, 16.7% Irish, 14.3% Italian, 6.5% English, and 5.0% Polish ancestry. Around 90.5% spoke English, 2.0% Spanish, 1.1% Korean, and 1.0% Italian as their first language. Historically, much of western Montgomery County is part of the Pennsylvania Dutch Country, with a great many descendants of German-speaking settlers from the 18th century.
Montgomery County is home to large and growing African American, Korean American, Puerto-Rican American, Mexican American, and Indian American populations. The county has the second-largest foreign-born population in the region, after Philadelphia County.[13]
Of the 286,098 households, 32.00% had children under the age of 18 living with them, 57.20% were married couples living together, 8.80% had a female householder with no husband present, and 30.90% were not families. About 25.60% of all households were made up of individuals, and 9.90% had someone living alone who was 65 years of age or older. The average household size was 2.54 and the average family size was 3.09.
In the county, the age distribution was 24.10% under the age of 18, 7.10% from 18 to 24, 30.50% from 25 to 44, 23.40% from 45 to 64, and 14.90% who were 65 years of age or older. The median age was 38 years. For every 100 females, there were 93.60 males. For every 100 females age 18 and over, there were 90.00 males.
The median income for a household in the county was $60,829, and for a family was $72,183 (these figures had risen to $73,701 and $89,219, respectively, as of a 2007 estimate). Males had a median income of $48,698 versus $35,089 for females. The per capita income for the county was $30,898. About 2.80% of families and 4.40% of the population were below the poverty line, including 4.60% of those under age 18 and 5.10% of those age 65 or over.
The largest townships/boroughs in Montgomery County include:"
| Township/borough | Population (2010 US Census) | Density mi2 |
|---|---|---|
| Lower Merion Township | 57,825 | 2,526.1 |
| Abington Township | 55,310 | 3,630.3 |
| Cheltenham Township | 36,793 | 4,083.1 |
| Municipality of Norristown | 34,324 | 9,806.9 |
| Upper Merion Township | 28,395 | 1,593.3 |
| Horsham Township | 26,147 | 1,398.6 |
| Upper Dublin Township | 25,569 | 1,960.7 |
| Lower Providence Township | 25,436 | 1,458.8 |
| Montgomery Township | 24,790 | 2,067.1 |
| Upper Moreland Township | 24,015 | 3,202 |
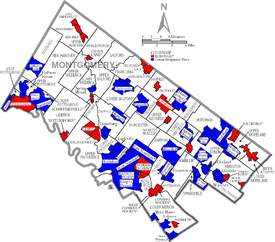
Politics
This section needs to be updated. (January 2016) |
| Year | Republican | Democratic | Third party | |||
|---|---|---|---|---|---|---|
| No. | % | No. | % | No. | % | |
| 2020 | 185,460 | 36.23% | 319,511 | 62.41% | 6,949 | 1.36% |
| 2016 | 162,731 | 37.10% | 256,082 | 58.38% | 19,839 | 4.52% |
| 2012 | 174,381 | 42.24% | 233,356 | 56.52% | 5,132 | 1.24% |
| 2008 | 165,552 | 39.16% | 253,393 | 59.94% | 3,796 | 0.90% |
| 2004 | 175,741 | 43.98% | 222,048 | 55.57% | 1,802 | 0.45% |
| 2000 | 145,623 | 43.81% | 177,990 | 53.54% | 8,809 | 2.65% |
| 1996 | 121,047 | 41.18% | 143,664 | 48.87% | 29,250 | 9.95% |
| 1992 | 125,704 | 39.46% | 136,572 | 42.87% | 56,300 | 17.67% |
| 1988 | 170,294 | 60.20% | 109,834 | 38.83% | 2,742 | 0.97% |
| 1984 | 181,426 | 64.18% | 99,741 | 35.29% | 1,499 | 0.53% |
| 1980 | 156,996 | 57.81% | 84,289 | 31.04% | 30,268 | 11.15% |
| 1976 | 155,480 | 56.92% | 112,644 | 41.24% | 5,045 | 1.85% |
| 1972 | 173,662 | 64.31% | 91,959 | 34.06% | 4,397 | 1.63% |
| 1968 | 141,621 | 54.32% | 102,464 | 39.30% | 16,647 | 6.38% |
| 1964 | 102,714 | 42.96% | 135,657 | 56.74% | 704 | 0.29% |
| 1960 | 142,796 | 60.68% | 92,212 | 39.18% | 318 | 0.14% |
| 1956 | 133,270 | 69.20% | 59,095 | 30.69% | 218 | 0.11% |
| 1952 | 115,899 | 66.62% | 57,701 | 33.17% | 373 | 0.21% |
| 1948 | 85,576 | 66.53% | 41,112 | 31.96% | 1,938 | 1.51% |
| 1944 | 78,260 | 61.71% | 47,815 | 37.70% | 752 | 0.59% |
| 1940 | 73,250 | 59.51% | 49,409 | 40.14% | 432 | 0.35% |
| 1936 | 66,442 | 52.52% | 57,870 | 45.74% | 2,194 | 1.73% |
| 1932 | 64,619 | 64.00% | 32,971 | 32.66% | 3,371 | 3.34% |
| 1928 | 76,680 | 76.37% | 23,026 | 22.93% | 702 | 0.70% |
| 1924 | 45,407 | 75.48% | 11,094 | 18.44% | 3,653 | 6.07% |
| 1920 | 31,963 | 69.70% | 12,239 | 26.69% | 1,653 | 3.60% |
| 1916 | 20,431 | 58.25% | 13,658 | 38.94% | 983 | 2.80% |
| 1912 | 8,978 | 26.69% | 11,894 | 35.37% | 12,760 | 37.94% |
| 1908 | 19,088 | 59.82% | 11,899 | 37.29% | 922 | 2.89% |
| 1904 | 18,833 | 62.58% | 10,420 | 34.62% | 843 | 2.80% |
| 1900 | 17,051 | 59.10% | 11,208 | 38.85% | 590 | 2.05% |
| 1896 | 17,329 | 61.25% | 9,985 | 35.29% | 980 | 3.46% |
| 1892 | 13,591 | 49.10% | 13,611 | 49.17% | 480 | 1.73% |
| 1888 | 13,445 | 50.90% | 12,582 | 47.63% | 390 | 1.48% |
| 1884 | 11,617 | 50.54% | 11,088 | 48.24% | 281 | 1.22% |
| 1880 | 11,026 | 49.75% | 11,025 | 49.75% | 112 | 0.51% |
As of November 7, 2022, there are 607,044 registered voters in Montgomery County.[15]
- Democratic: 304,751 (50.20%)
- Republican: 205,398 (33.84%)
- Independent: 64,759 (10.72%)
- Third Party: 32,136 (5.29%)
Historically, Montgomery County was a stronghold for the Republican Party. The county was the only one carried by Barbara Hafer in the 1990 gubernatorial election over the incumbent governor, Bob Casey. However, the Democratic Party has made substantial gains in the county over the last quarter-century and gained the registration edge early in 2008.
As in most of Philadelphia's suburbs, the brand of Republicanism practiced in Montgomery County for much of the 20th century was a moderate one. As the national parties have polarized, the county's voters have increasingly supported Democrats at the national level. After voting for the Republican presidential nominee in all but one election from 1952 to 1988, Lyndon Johnson's landslide in 1964, Montgomery County residents have voted for the Democratic presidential nominee for the past seven consecutive elections, with the margins progressively increasing between 1992 and 2008 to 21.8%. The Democratic victory margin decreased in 2012 back to 14.3%, but rebounded in 2016 to 21.3%. In 2020's election, the Democratic victory margin grew to 26.2%.
Most county-level offices were held by Republicans until after the 2007 election, when Democrats picked up control of five row offices. Democrats have also won several elections in the Pennsylvania General Assembly in recent years, including two GOP-leaning State House districts in 2004, the 148th with Mike Gerber and the 153rd with Josh Shapiro. Today, although the county is very Democratic at the national level, at the state and local level, it is not specifically partisan.
In the 2004 United States Senate election, Republican Arlen Specter won the county over Montco resident Joe Hoeffel, but Democrat Bob Casey, Jr. out-polled Rick Santorum in the 2006 Senate election. In 2006, Democrat Rick Taylor unseated incumbent Republican Eugene McGill in the 151st (although Taylor lost in 2010 to Republican Todd Stephens) and, in 2008, Democrat Matthew Bradford unseated incumbent Republican Jay Moyer in the 70th. Six of the county's 12 state house seats and four of the county's eight senate seats are now held by Democrats. All four statewide Democratic candidates carried Montgomery in 2008, with Barack Obama receiving 60% of the county's vote. Barack Obama won Montgomery County in 2008 and 2012.
Despite Donald Trump's victory in the state of Pennsylvania in the 2016 election, Montgomery County was one of the few counties in Pennsylvania which swung in the Democratic presidential candidates' direction with Hillary Clinton winning Montgomery County with 58.87% of the vote, an improvement from Barack Obama's 56.6% vote share in 2012. In the 2016 U.S. Senate elections as well as the Pennsylvania Attorney General elections, Montgomery County voted for Katie McGinty and Josh Shapiro, both Democrats.[16] In 2020, Joe Biden received over 60% of the vote in Montgomery County, the first Democrat to do so in the county's history.
Government
Montgomery County is governed by a three-person county commission. The current composition is two Democrats and one Republican. By law, the county commission must have one member of a minority party represented.
County commissioners
| Holder | Party | Position |
|---|---|---|
| Val Arkoosh | Democratic | Chair |
| Kenneth E. Lawrence Jr. | Democratic | Vice Chair |
| Joseph Gale | Republican |
County row offices
As of the November 2019 election:
| Office | Holder | Party |
|---|---|---|
| Clerk of Courts | Lori Schreiber | Democratic |
| Controller | Karen Geld Sanchez | Democratic |
| Coroner | Michael Milbourne | Democratic |
| District Attorney | Kevin R. Steele | Democratic |
| Prothonotary | Noah Marlier | Democratic |
| Recorder of Deeds | Jeanne Sorg | Democratic |
| Register of Wills | D. Bruce Hanes | Democratic |
| Sheriff | Sean Kilkenny | Democratic |
| Treasurer | Jason Salus | Democratic |
| Jury Commissioner | Joanne Cisco Olszewski | Democratic |
| Jury Commissioner | Merry Woods | Republican |
Same-sex marriage
On July 24, 2013, Montgomery County Register of Wills D. Bruce Hanes, a Democrat, announced he would begin issuing marriage licenses to same-sex couples, flouting Pennsylvania law banning such unions. Hanes called the commonwealth's ban "arbitrary and suspect", saying he believes it violates the Pennsylvania Constitution and the United States Constitution. The Republican administration of Governor Tom Corbett filed suit in the Commonwealth Court of Pennsylvania in an attempt to block Hanes from licensing same-sex marriage.[17] Commonwealth Court Judge Dan Pellegrini ordered Hanes in September 2013 to stop issuing same-sex marriage licenses. After Federal Judge John Jones threw out Pennsylvania's ban on same-sex marriage in May 2014, calling it unconstitutional, offices in other counties were able to issue these licenses, while Hanes had to wait for the ruling against him to be removed.[18]
United States Senate
| Senator | Party |
|---|---|
| Bob Casey | Democrat |
| Pat Toomey | Republican |
United States House of Representatives

| District | Representative | Party |
|---|---|---|
| 1 | Brian Fitzpatrick | Republican |
| 4 | Madeleine Dean | Democratic |
| 5 | Mary Gay Scanlon | Democratic |
State Senate
| District | Representative | Party |
|---|---|---|
| 4 | Art Haywood | Democratic |
| 7 | Vincent Hughes | Democratic |
| 12 | Maria Collett | Democratic |
| 17 | Amanda Cappelletti | Democratic |
| 24 | Bob Mensch | Republican |
| 44 | Katie Muth | Democratic |
State House of Representatives
| District | Representative | Party |
|---|---|---|
| 26 | Tim Hennessey | Republican |
| 53 | Steve Malagari | Democratic |
| 61 | Liz Hanbidge | Democratic |
| 70 | Matthew Bradford | Democratic |
| 131 | Milou Mackenzie | Republican |
| 146 | Joe Ciresi | Democratic |
| 147 | Tracy Pennycuick | Republican |
| 148 | Mary Jo Daley | Democratic |
| 149 | Tim Briggs | Democratic |
| 150 | Joseph Webster | Democratic |
| 151 | Todd Stephens | Republican |
| 152 | Nancy Guenst | Democratic |
| 153 | Ben Sanchez | Democratic |
| 154 | Napoleon Nelson | Democratic |
| 157 | Melissa Shusterman | Democratic |
| 166 | Greg Vitali | Democratic |
| 172 | Kevin J. Boyle | Democratic |
| 194 | Pam DeLissio | Democratic |
Economy


Montgomery County is a suburb of Philadelphia and consequently, many of its residents work in the city. However, Montco is also a major employment center with large business parks in Blue Bell, Lansdale, Fort Washington, Horsham, and King of Prussia which attract thousands of workers from all over the region. The strong job base and taxes generated by those jobs have resulted in Montgomery County receiving the highest credit rating of 'AAA' from Standard & Poor's, one of fewer than 30 counties in the United States with such a rating.[19] In 2012, Moody's downgraded the general obligation rating to Aa1,[20] and in 2018 the rating was revised back to Aaa.[21]
Major employers include:[22]
- Abington School District
- ABM Industries
- ACTS Retirement-Life Communities
- Aetna
- Arcadia University
- Giant
- GlaxoSmithKline
- Hatfield Quality Meats
- Hatboro-Horsham School District
- Holy Redeemer Health System
- Janssen
- Jefferson Abington Hospital
- Lockheed Martin
- Lower Merion School District
- King of Prussia mall
- Main Line Health
- McNeil Consumer Healthcare
- Merck
- Montgomery County Community College
- Motorola Mobility
- Norristown Area School District
- North Penn School District
- Pfizer
- Prudential
- Quaker Chemical
- Quest Diagnostics
- SEI Investments Company
- Souderton Area School District
- Spring-Ford Area School District
Education
Colleges and universities
- Arcadia University
- Bryn Athyn College
- Bryn Mawr College
- DeVry University – Fort Washington
- Gwynedd Mercy University
- Haverford College
- Manor College
- Montgomery County Community College
- Pennsylvania College of Optometry (Salus University)
- Penn State Abington – a commonwealth campus of Pennsylvania State University
- Reconstructionist Rabbinical College
- Rosemont College
- St. Charles Borromeo Seminary
- Saint Joseph's University
- Temple University – Ambler
- Ursinus College
- Westminster Theological Seminary
Public school districts

School district:[23]
- Abington School District
- Boyertown Area School District
- Cheltenham Township School District
- Colonial School District
- Hatboro-Horsham School District
- Jenkintown School District
- Lower Merion School District
- Lower Moreland Township School District
- Methacton School District
- Norristown Area School District
- North Penn School District
- Perkiomen Valley School District
- Pottsgrove School District
- Pottstown School District
- Souderton Area School District
- Springfield Township School District
- Spring-Ford Area School District
- Upper Dublin School District
- Upper Merion Area School District
- Upper Moreland School District
- Upper Perkiomen School District
- Wissahickon School District
- Bryn Athyn School District – exists as an entity, but does not operate any schools. Public school students attend class in neighboring districts.[24]
Private secondary schools
- Academy Of The New Church Boys School
- Academy Of The New Church Girls School
- Abington Friends School
- The Baldwin School
- AIM Academy
- Jack M. Barrack Hebrew Academy, formerly known as the Akiba Hebrew Academy
- Bishop McDevitt High School
- Calvary Baptist School
- Coventry Christian Schools
- Dock Mennonite Academy
- Friends' Central School
- Germantown Academy
- Gwynedd Mercy Academy High School
- Haverford School
- The Hill School
- Huntingdon Valley Christian Academy
- Indian Creek Mennonite School
- Lakeside School
- Lansdale Catholic High School
- La Salle College High School
- Lincoln Academy
- Main Line Academy
- Martin Luther School
- Mary, Mother of the Redeemer Catholic School
- Meadowbrook School
- Merion Mercy Academy
- Mount Saint Joseph Academy
- New Life Youth & Family Svcs
- The Pathway School
- The Perkiomen School
- Phil-Mont Christian Academy
- Pope John Paul II Catholic High School, replaced Kennedy-Kenrick Catholic High School and Saint Pius X High School in 2010.
- Reformation Christian School
- Saint Aloysius School
- Saint Basil Academy
- Saint Katherine Day School
- Stowe Lighthouse Christ Academy
- The Shipley School
- Torah Academy of Greater Philadelphia
- Trinity Christian Academy
- Valley Forge Baptist Academy
- Wordsworth Academy
- Wyncote Academy
Night schools/adult education
Communities
Under Pennsylvania law, five types of incorporated municipalities are listed: cities, boroughs, townships, home rule municipalities (which can include communities that bear the name "Borough" or "Township") and, in at most two cases, towns. These boroughs, townships, and home rule municipalities are located in Montgomery County:
Home rule municipalities
- Bryn Athyn (official name remains "Borough of Bryn Athyn")
- Cheltenham Township
- Horsham Township
- Norristown (county seat)
- Plymouth Township
- Whitemarsh Township
Boroughs
Townships
- Abington
- Cheltenham
- Douglass
- East Norriton
- Franconia
- Hatfield
- Horsham
- Limerick
- Lower Frederick
- Lower Gwynedd
- Lower Merion
- Lower Moreland
- Lower Pottsgrove
- Lower Providence
- Lower Salford
- Marlborough
- Montgomery
- New Hanover
- Perkiomen
- Plymouth
- Salford
- Skippack
- Springfield
- Towamencin
- Upper Dublin
- Upper Frederick
- Upper Gwynedd
- Upper Hanover
- Upper Merion
- Upper Moreland
- Upper Pottsgrove
- Upper Providence
- Upper Salford
- West Norriton
- West Pottsgrove
- Whitemarsh
- Whitpain
- Worcester
Census-designated places
Census-designated places are geographical areas designated by the United States Census Bureau for the purposes of compiling demographic data. They are not actual jurisdictions under Pennsylvania law. Other unincorporated communities, such as villages, may be listed here, as well.
- Arcadia University
- Ardmore
- Audubon
- Blue Bell
- Bryn Mawr
- Eagleville
- Evansburg
- Flourtown
- Fort Washington
- Gilbertsville
- Glenside
- Halfway House
- Harleysville
- Haverford College
- Horsham
- King of Prussia
- Kulpsville
- Maple Glen
- Montgomeryville
- Oreland
- Penn Wynne
- Plymouth Meeting
- Pottsgrove
- Sanatoga
- Skippack
- Spring House
- Spring Mount
- Stowe
- Trooper
- Willow Grove
- Woxall
- Wyncote
- Wyndmoor
Even though the historic village of Valley Forge, as well as the park, are partially located within Montgomery County, the modern village is in Chester County, PA
Unincorporated communities
- Ardsley
- Bala Cynwyd
- Bethayres
- Dresher
- Elkins Park
- Frederick, a village in New Hanover Township.[25]
- Graterford
- Gladwyne
- Gwynedd
- Gwynedd Valley
- Huntingdon Valley (small parts in Bucks County)
- Lafayette Hill
- Lederach
- Linfield
- Melrose Park
- Merion
- Mont Clare
- Oaks
- Port Providence
- Rosemont, Pennsylvania
- Villanova (partly in Delaware County)
- Wynnewood (partly in Delaware County)
- Meadowbrook
Population ranking
The population ranking of the following table is based on the 2010 census of Montgomery County.[26]
† county seat
| Rank | City/Town/etc. | Municipal type | Population (2010 Census) |
|---|---|---|---|
| 1 | † Norristown | Municipality | 34,324 |
| 2 | Pottstown | Borough | 22,377 |
| 3 | King of Prussia | CDP | 19,936 |
| 4 | Lansdale | Borough | 16,269 |
| 5 | Willow Grove | CDP | 15,726 |
| 6 | Horsham | CDP | 14,842 |
| 7 | Montgomeryville | CDP | 12,624 |
| 8 | Ardmore (partially in Delaware County) | CDP | 12,455 |
| 9 | Harleysville | CDP | 9,286 |
| 10 | Audubon | CDP | 8,433 |
| 11 | Glenside | CDP | 8,384 |
| 12 | Sanatoga | CDP | 8,378 |
| 13 | Kulpsville | CDP | 8,194 |
| 14 | Conshohocken | Borough | 7,833 |
| 15 | Hatboro | Borough | 7,360 |
| 16 | Maple Glen | CDP | 6,742 |
| 17 | Souderton | Borough | 6,618 |
| 18 | Ambler | Borough | 6,417 |
| 19 | Plymouth Meeting | CDP | 6,177 |
| 20 | Blue Bell | CDP | 6,067 |
| 21 | Trooper | CDP | 5,744 |
| 22 | Penn Wynne | CDP | 5,697 |
| 23 | Oreland | CDP | 5,678 |
| 24 | Wyndmoor | CDP | 5,498 |
| 25 | Fort Washington | CDP | 5,446 |
| 26 | Collegeville | Borough | 5,089 |
| 27 | Telford (partially in Bucks County) | Borough | 4,872 |
| 28 | Gilbertsville | CDP | 4,832 |
| 29 | Eagleville | CDP | 4,800 |
| 30 | Royersford | Borough | 4,752 |
| 31 | Bridgeport | Borough | 4,554 |
| 32 | Flourtown | CDP | 4,538 |
| 33 | Jenkintown | Borough | 4,422 |
| 34 | Narberth | Borough | 4,282 |
| 35 | Gladwyne | CDP | 4,050 |
| 36 | Pennsburg | Borough | 3,843 |
| 37 | Spring House | CDP | 3,804 |
| 38 | Bryn Mawr | CDP | 3,779 |
| 39 | Skippack | CDP | 3,758 |
| 40 | Stowe | CDP | 3,695 |
| 41 | Trappe | Borough | 3,509 |
| 42 | Pottsgrove | CDP | 3,469 |
| 43 | Hatfield | Borough | 3,290 |
| 44 | North Wales | Borough | 3,229 |
| 45 | Wyncote | CDP | 3,044 |
| 46 | East Greenville | Borough | 2,951 |
| 47 | Halfway House | CDP | 2,881 |
| 48 | Rockledge | Borough | 2,543 |
| 49 | Red Hill | Borough | 2,383 |
| 50 | Spring Mount | CDP | 2,259 |
| 51 | Evansburg | CDP | 2,129 |
| 52 | Schwenksville | Borough | 1,385 |
| 53 | Bryn Athyn | Municipality | 1,375 |
| 54 | Haverford College (mostly in Delaware County) | CDP | 1,331 |
| 55 | West Conshohocken | Borough | 1,320 |
| 56 | Woxhall | CDP | 1,318 |
| 57 | Arcadia University | CDP | 595 |
| 58 | Green Lane | Borough | 508 |
Culture
- The Institutes for the Achievement of Human Potential (IAHP), a nonprofit organization founded by Glenn Doman, was established in Wyndmoor in 1955. The IAHP is an educational organization that teaches parents about child brain development, and is a treatment center for brain-injured children.
- The Old York Road Symphony, based in Abington, is one of the oldest all-volunteer orchestras in the country, founded in 1932.
Climate
The county has a hot-summer humid continental climate (Dfa) except in some lowland areas very close to Philadelphia where it is humid subtropical (Cfa). The hardiness zones are 6b and 7a.
| Climate data for Upper Hanover Twp (Elevation: 489 ft (149 m)) 1981 - 2010 Averages | |||||||||||||
|---|---|---|---|---|---|---|---|---|---|---|---|---|---|
| Month | Jan | Feb | Mar | Apr | May | Jun | Jul | Aug | Sep | Oct | Nov | Dec | Year |
| Average high °F (°C) | 37.8 (3.2) |
41.1 (5.1) |
49.8 (9.9) |
61.7 (16.5) |
72.1 (22.3) |
80.8 (27.1) |
84.9 (29.4) |
83.2 (28.4) |
76.2 (24.6) |
64.5 (18.1) |
53.3 (11.8) |
41.8 (5.4) |
62.4 (16.9) |
| Daily mean °F (°C) | 29.3 (−1.5) |
31.9 (−0.1) |
39.7 (4.3) |
50.5 (10.3) |
60.4 (15.8) |
69.5 (20.8) |
74.0 (23.3) |
72.3 (22.4) |
64.8 (18.2) |
53.2 (11.8) |
43.5 (6.4) |
33.5 (0.8) |
52.0 (11.1) |
| Average low °F (°C) | 20.8 (−6.2) |
22.7 (−5.2) |
29.6 (−1.3) |
39.2 (4.0) |
48.7 (9.3) |
58.3 (14.6) |
63.0 (17.2) |
61.4 (16.3) |
53.4 (11.9) |
41.9 (5.5) |
33.7 (0.9) |
25.2 (−3.8) |
41.6 (5.3) |
| Average precipitation inches (mm) | 3.27 (83) |
2.71 (69) |
3.55 (90) |
3.86 (98) |
4.27 (108) |
4.21 (107) |
4.83 (123) |
3.90 (99) |
4.63 (118) |
4.26 (108) |
3.65 (93) |
3.75 (95) |
46.89 (1,191) |
| Average relative humidity (%) | 68.4 | 65.1 | 60.6 | 59.5 | 63.6 | 69.0 | 69.0 | 71.8 | 72.9 | 71.4 | 70.4 | 70.7 | 67.7 |
| Average dew point °F (°C) | 20.2 (−6.6) |
21.5 (−5.8) |
27.2 (−2.7) |
36.9 (2.7) |
48.0 (8.9) |
58.9 (14.9) |
63.2 (17.3) |
62.7 (17.1) |
55.9 (13.3) |
44.2 (6.8) |
34.5 (1.4) |
25.0 (−3.9) |
41.6 (5.3) |
| Source: PRISM[27] | |||||||||||||
| Climate data for Cheltenham (Elevation: 125 ft (38 m)) 1981 - 2010 Averages | |||||||||||||
|---|---|---|---|---|---|---|---|---|---|---|---|---|---|
| Month | Jan | Feb | Mar | Apr | May | Jun | Jul | Aug | Sep | Oct | Nov | Dec | Year |
| Average high °F (°C) | 40.6 (4.8) |
43.9 (6.6) |
52.0 (11.1) |
63.3 (17.4) |
73.0 (22.8) |
82.3 (27.9) |
86.3 (30.2) |
84.9 (29.4) |
78.0 (25.6) |
66.7 (19.3) |
55.9 (13.3) |
44.9 (7.2) |
64.4 (18.0) |
| Daily mean °F (°C) | 33.2 (0.7) |
35.9 (2.2) |
43.2 (6.2) |
53.7 (12.1) |
63.2 (17.3) |
72.8 (22.7) |
77.3 (25.2) |
76.0 (24.4) |
68.8 (20.4) |
57.3 (14.1) |
47.5 (8.6) |
37.7 (3.2) |
55.6 (13.1) |
| Average low °F (°C) | 25.8 (−3.4) |
27.8 (−2.3) |
34.3 (1.3) |
44.0 (6.7) |
53.4 (11.9) |
63.2 (17.3) |
68.4 (20.2) |
67.1 (19.5) |
59.6 (15.3) |
48.0 (8.9) |
39.2 (4.0) |
30.4 (−0.9) |
46.9 (8.3) |
| Average precipitation inches (mm) | 3.46 (88) |
2.77 (70) |
4.10 (104) |
3.92 (100) |
4.15 (105) |
4.12 (105) |
4.96 (126) |
4.24 (108) |
4.29 (109) |
3.71 (94) |
3.52 (89) |
3.92 (100) |
47.16 (1,198) |
| Average relative humidity (%) | 65.5 | 61.6 | 57.3 | 57.2 | 61.4 | 63.5 | 65.0 | 66.9 | 68.0 | 67.9 | 66.5 | 66.6 | 64.0 |
| Average dew point °F (°C) | 22.9 (−5.1) |
24.0 (−4.4) |
29.1 (−1.6) |
38.9 (3.8) |
49.7 (9.8) |
59.7 (15.4) |
64.6 (18.1) |
64.2 (17.9) |
57.8 (14.3) |
46.8 (8.2) |
36.9 (2.7) |
27.6 (−2.4) |
43.6 (6.4) |
| Source: PRISM[27] | |||||||||||||
See also
- National Register of Historic Places listings in Montgomery County, Pennsylvania
References
- "State & County QuickFacts". United States Census Bureau. Retrieved July 5, 2022.
- "Find a County". National Association of Counties. Archived from the original on May 31, 2011. Retrieved June 7, 2011.
- "Montgomery County, Pennsylvania". Family Search. Retrieved January 21, 2015.
- "2010 Census Gazetteer Files". United States Census Bureau. August 22, 2012. Retrieved March 9, 2015.
- "Annual Estimates of the Resident Population for Counties: April 1, 2020 to July 1, 2021". Retrieved July 5, 2022.
- "U.S. Decennial Census". United States Census Bureau. Retrieved March 9, 2015.
- "Historical Census Browser". University of Virginia Library. Retrieved March 9, 2015.
- Forstall, Richard L., ed. (March 24, 1995). "Population of Counties by Decennial Census: 1900 to 1990". United States Census Bureau. Retrieved March 9, 2015.
- "Census 2000 PHC-T-4. Ranking Tables for Counties: 1990 and 2000" (PDF). United States Census Bureau. April 2, 2001. Retrieved March 9, 2015.
- "Explore Census Data".
- "P2 HISPANIC OR LATINO, AND NOT HISPANIC OR LATINO BY RACE – 2020: DEC Redistricting Data (PL 94-171) – Montgomery County, Pennsylvania".
- "U.S. Census website". United States Census Bureau. Retrieved January 31, 2008.
- "The county has also been declared a sanctuary county". March 11, 2007. Archived from the original on March 11, 2007. Retrieved November 29, 2018.
=ACS: 2003 ACS Tabular Profile for Montgomery County -- Table 1
- Leip, David. "Dave Leip's Atlas of U.S. Presidential Elections". uselectionatlas.org. Retrieved November 29, 2018.
- Pennsylvania Department of State, Voting and Election Statistics, accessed November 7, 2022
- "Montgomery County Election Results". electionresults.montcopa.org. Retrieved November 25, 2016.
- "Pennsylvania Gay Marriage Law Deemed 'Suspect' By County Official". The Huffington Post. August 19, 2013. Retrieved August 26, 2013.
- "Montgomery County still unable to issue same-sex marriage licenses". The Times Herald. May 21, 2014. Retrieved January 24, 2018.
- "Montgomery County," Rydal-Meadowbrook Civic Association Archived October 13, 2013, at the Wayback Machine
- "Moody's downgrades Montgomery County's (PA) general obligation rating to Aa1 from Aaa; outlook is stable". Moodys.com. July 19, 2012. Retrieved May 28, 2018.
- "Montgomery County, PA". Montgomery County, PA. Retrieved May 28, 2018.
- Top 50 Employers by County – Montgomery Archived October 14, 2013, at the Wayback Machine
- "2020 CENSUS - SCHOOL DISTRICT REFERENCE MAP: Montgomery County, PA" (PDF). U.S. Census Bureau. Retrieved July 20, 2022. - Text list
- Meetings & Notices Archived July 23, 2007, at the Wayback Machine
- Upper Frederick Township, Montgomery County, Pennsylvania
- Bureau, US Census. "Decennial Census by Decades". www.census.gov. Retrieved November 29, 2018.
- "PRISM Climate Group, Oregon State University". Retrieved August 9, 2019.
External links
Delaware Valley | ||
|---|---|---|
| Counties |  | |
| Major cities | ||
| Cities and towns 50k-99k |
| |
| Cities and towns 30k-50k | ||
| See also |
| |
Authority control | |
|---|---|
| General | |
| National libraries | |
| Other | |
На других языках
[de] Montgomery County (Pennsylvania)
Das Montgomery County[1] ist ein County im US-Bundesstaat Pennsylvania. Bei der Volkszählung im Jahr 2020 hatte das County 856.553 Einwohner und eine Bevölkerungsdichte von 684,7 Einwohnern pro Quadratkilometer.[2] Der Verwaltungssitz (County Seat) ist Norristown.- [en] Montgomery County, Pennsylvania
[ru] Монтгомери (округ, Пенсильвания)
Округ Монтгомери — округ в штате Пенсильвания, США. В 2000 году население округа составляло 750 097 человек. Площадь — 1281 км².Другой контент может иметь иную лицензию. Перед использованием материалов сайта WikiSort.org внимательно изучите правила лицензирования конкретных элементов наполнения сайта.
WikiSort.org - проект по пересортировке и дополнению контента Википедии