world.wikisort.org - USA
Westmoreland County is a county located in the U.S. state of Pennsylvania. At the 2010 census, the population was 365,169.[1] The county seat is Greensburg.[2] Formed from, successively, Lancaster, Northumberland, and later Bedford counties, Westmoreland County was founded on February 26, 1773, and was the first county in the colony of Pennsylvania whose entire territorial boundary was located west of the Allegheny Mountains. Westmoreland County originally included the present-day counties of Fayette, Washington, Greene, and parts of Beaver, Allegheny, Indiana, and Armstrong counties. It is named after Westmorland, a historic county of England.
This article needs additional citations for verification. (October 2018) |
Westmoreland County | |
|---|---|
U.S. county | |
 Westmoreland County Courthouse | |
 Flag | |
 Location within the U.S. state of Pennsylvania | |
 Pennsylvania's location within the U.S. | |
| Coordinates: 40°19′N 79°28′W | |
| Country | |
| State | |
| Founded | February 26, 1773 |
| Named for | Westmorland |
| Seat | Greensburg |
| Largest city | Hempfield Township |
| Area | |
| • Total | 1,036 sq mi (2,680 km2) |
| • Land | 1,028 sq mi (2,660 km2) |
| • Water | 8.5 sq mi (22 km2) 0.8%% |
| Population | |
| • Estimate (2019) | 348,899 |
| • Density | 341/sq mi (132/km2) |
| Time zone | UTC−5 (Eastern) |
| • Summer (DST) | UTC−4 (EDT) |
| Congressional districts | 13th, 14th |
| Website | www |
Westmoreland County is included in the Pittsburgh Metropolitan Statistical Area.
History
Formed from, successively, Lancaster, Northumberland, and later Bedford counties, Westmoreland County was founded on February 26, 1773, and was the first county in the Pennsylvania colony whose entire territorial boundary was located west of the Allegheny Mountains. Westmoreland County originally included the present-day counties of Fayette, Washington, Greene, and parts of Beaver, Allegheny, Indiana, and Armstrong counties. It is named after Westmorland, a historic county of England.
Geography
According to the U.S. Census Bureau, the county has a total area of 1,036 square miles (2,680 km2), of which 1,028 square miles (2,660 km2) is land and 8.5 square miles (22 km2) (0.8%) is water.[3] Westmoreland has a humid continental climate (Dfa/Dfb). Average monthly temperatures in Greensburg range from 28.7 °F in January to 71.8 °F in July, while in Murrysville they range from 29.4 °F in January to 73.1 °F in July, in Latrobe they range from 28.9 °F in January to 72.0 °F in July, and in Ligonier they range from 28.1 °F in January to 71.1 °F in July.
Adjacent counties
- Armstrong County (north)
- Indiana County (northeast)
- Cambria County (east)
- Somerset County (southeast)
- Fayette County (south)
- Washington County (southwest)
- Allegheny County (west)
- Butler County (northwest)
Major highways
 I-70
I-70
 I-76 / Penna Turnpike
 US 30
US 30 US 22
US 22 US 119
 PA 31
PA 31 PA 51
PA 51 PA 56
PA 56 PA 56 Truck
 PA 66 / PA Turnpike 66
 PA 66 Bus.
 PA 66 Alt.
 PA 130
 PA 136
 PA 201
 PA 217
 PA 259
 PA 271
 PA 286
 PA 356
 PA 366
 PA 380
 PA 711
 PA 780
 PA 819
 PA 906
 PA 981
 PA 982
 PA 993
Demographics
| Historical population | |||
|---|---|---|---|
| Census | Pop. | %± | |
| 1790 | 16,019 | — | |
| 1800 | 22,726 | 41.9% | |
| 1810 | 26,392 | 16.1% | |
| 1820 | 30,540 | 15.7% | |
| 1830 | 38,400 | 25.7% | |
| 1840 | 42,699 | 11.2% | |
| 1850 | 51,726 | 21.1% | |
| 1860 | 53,736 | 3.9% | |
| 1870 | 58,719 | 9.3% | |
| 1880 | 78,036 | 32.9% | |
| 1890 | 112,819 | 44.6% | |
| 1900 | 160,175 | 42.0% | |
| 1910 | 231,304 | 44.4% | |
| 1920 | 273,568 | 18.3% | |
| 1930 | 294,995 | 7.8% | |
| 1940 | 303,411 | 2.9% | |
| 1950 | 313,179 | 3.2% | |
| 1960 | 352,629 | 12.6% | |
| 1970 | 376,935 | 6.9% | |
| 1980 | 392,294 | 4.1% | |
| 1990 | 370,321 | −5.6% | |
| 2000 | 369,993 | −0.1% | |
| 2010 | 365,169 | −1.3% | |
| 2020 | 354,663 | −2.9% | |
| U.S. Decennial Census[4] 1790-1960[5] 1900-1990[6] 1990-2000[7] 2010-2019[1] 2010-2020[8] | |||
At the 2010 census,[9] there were 365,169 people, 153,650 households and 101,928 families residing in the county. The population density was 355.4 per square mile (137.2/km2). There were 168,199 housing units at an average density of 163.7 per square mile (63.2/km2). The racial makeup of the county was 95.3% White, 2.3% Black or African American, 0.1% Native American, 0.7% Asian, 0.03% Pacific Islander, 0.2% from other races, and 1.2% from two or more races. 0.9% of the population were Hispanic or Latino of any race.
There were 153,650 households, of which 24.5% had children under the age of 18 living with them, 52.2% were married couples living together, 10.0% had a female householder with no husband present, and 33.7% were non-families. 29.0% of all households were made up of individuals, and 13.3% had someone living alone who was 65 years of age or older. The average household size was 2.32, and the average family size was 2.86.
22.3% of the population were under 18, 5.1% from 18 to 24, 22.4% from 25 to 44, 31.3% from 45 to 64, and 18.9% who were 65 years of age or older. The median age was 45.1 years. For every 100 females, there were 94.8 males. For every 100 females age 18 and over, there were 92.3 males.
2020 Census
| Race | Num. | Perc. |
|---|---|---|
| White (NH) | 323,114 | 91.1% |
| Black or African American (NH) | 8,985 | 2.53% |
| Native American (NH) | 295 | 0.1% |
| Asian (NH) | 3,301 | 1% |
| Pacific Islander (NH) | 36 | 0.01% |
| Other/Mixed (NH) | 13,702 | 3.86% |
| Hispanic or Latino | 5,230 | 1.47% |
Politics and government
As of November 7, 2022, there are 248,459 registered voters in Westmoreland County.[11]
- Republican: 122,519 (49.31%)
- Democratic: 95,325 (38.37%)
- Independent: 20,063 (8.07%)
- Minor parties: 10,552 (4.25%)
The Democratic Party historically dominated county-level politics between the New Deal realignment and the turn of the century; however, Westmoreland has trended Republican at the national and statewide levels in the 21st century (in direct lockstep with most other Appalachian counties). In 2000, Republican George W. Bush became the first Republican to carry the county since 1972, and Republicans have carried the county in every election since, increasing the margin of victory in every successive election until 2020. Democratic Governor Ed Rendell lost Westmoreland in both 2002 and 2006. In 2008, Republican Tim Krieger picked up the 57th House district left open by the retirement of Democratic state representative Tom Tangretti. In 2010, both Pat Toomey and Tom Corbett won Westmoreland in their statewide bids. Also, the GOP gained control of two more State House districts, the 54th with Eli Evankovich and the 56th with George Dunbar. In 2011, the Republican Party swept all county row offices.[12] A Democratic resurgence in 2015 gave that party a majority of the county commissioners. However, in the 2019 elections, Democratic elected officials lost that majority and carried only one row office.
As of 2020, the only majority-Dem cities within the county are Arnold and Monessen.[13]
Presidential elections
| Year | Republican | Democratic | Third party | |||
|---|---|---|---|---|---|---|
| No. | % | No. | % | No. | % | |
| 2020 | 130,299 | 63.46% | 72,192 | 35.16% | 2,839 | 1.38% |
| 2016 | 116,522 | 63.50% | 59,669 | 32.52% | 7,301 | 3.98% |
| 2012 | 103,932 | 61.29% | 63,722 | 37.58% | 1,918 | 1.13% |
| 2008 | 102,294 | 57.62% | 72,721 | 40.96% | 2,532 | 1.43% |
| 2004 | 100,087 | 56.01% | 77,774 | 43.52% | 835 | 0.47% |
| 2000 | 80,858 | 51.60% | 71,792 | 45.81% | 4,059 | 2.59% |
| 1996 | 62,058 | 43.30% | 63,686 | 44.43% | 17,585 | 12.27% |
| 1992 | 47,315 | 30.63% | 69,817 | 45.20% | 37,319 | 24.16% |
| 1988 | 61,472 | 44.13% | 76,710 | 55.07% | 1,108 | 0.80% |
| 1984 | 71,377 | 46.82% | 79,906 | 52.41% | 1,181 | 0.77% |
| 1980 | 63,140 | 45.06% | 68,627 | 48.97% | 8,372 | 5.97% |
| 1976 | 59,172 | 43.47% | 74,217 | 54.52% | 2,745 | 2.02% |
| 1972 | 75,085 | 54.60% | 59,322 | 43.13% | 3,120 | 2.27% |
| 1968 | 52,206 | 35.08% | 81,833 | 54.98% | 14,800 | 9.94% |
| 1964 | 41,493 | 27.77% | 107,131 | 71.70% | 792 | 0.53% |
| 1960 | 68,825 | 44.45% | 85,641 | 55.31% | 374 | 0.24% |
| 1956 | 66,580 | 47.77% | 72,616 | 52.10% | 192 | 0.14% |
| 1952 | 58,923 | 42.24% | 80,068 | 57.40% | 503 | 0.36% |
| 1948 | 41,709 | 39.05% | 61,901 | 57.95% | 3,204 | 3.00% |
| 1944 | 43,202 | 41.16% | 61,057 | 58.17% | 705 | 0.67% |
| 1940 | 42,643 | 39.56% | 64,567 | 59.90% | 577 | 0.54% |
| 1936 | 36,079 | 32.23% | 73,574 | 65.73% | 2,282 | 2.04% |
| 1932 | 30,426 | 37.73% | 45,436 | 56.34% | 4,789 | 5.94% |
| 1928 | 51,760 | 61.88% | 30,587 | 36.57% | 1,296 | 1.55% |
| 1924 | 34,522 | 55.22% | 10,223 | 16.35% | 17,769 | 28.42% |
| 1920 | 27,077 | 59.71% | 12,845 | 28.32% | 5,427 | 11.97% |
| 1916 | 15,283 | 46.68% | 13,829 | 42.24% | 3,625 | 11.07% |
| 1912 | 4,299 | 14.66% | 9,262 | 31.58% | 15,764 | 53.76% |
| 1908 | 15,429 | 52.00% | 11,101 | 37.41% | 3,141 | 10.59% |
| 1904 | 17,239 | 63.16% | 8,007 | 29.33% | 2,050 | 7.51% |
| 1900 | 16,014 | 57.00% | 11,010 | 39.19% | 1,072 | 3.82% |
| 1896 | 14,928 | 56.23% | 11,029 | 41.55% | 589 | 2.22% |
| 1892 | 10,804 | 48.84% | 10,747 | 48.58% | 569 | 2.57% |
| 1888 | 9,926 | 49.37% | 9,602 | 47.76% | 577 | 2.87% |
| 1884 | 8,339 | 47.52% | 8,346 | 47.56% | 864 | 4.92% |
| 1880 | 7,113 | 44.47% | 7,975 | 49.86% | 908 | 5.68% |
County commissioners
- Sean Kertes, Chairman, Republican
- Gina Cerilli, Democratic
- Doug Chew, Republican
Other county officials
- Clerk of Courts, Megan Loughner, Republican
- Controller, Jeff Balzer, Republican
- Coroner, Tim Carson, Republican
- District Attorney, Nicole Ziccarelli, Republican
- Prothonotary, Gina O'Barto, Republican
- Recorder of Deeds, Frank Schiefer, Republican
- Register of Wills, Sherry Magretti-Hamilton, Republican
- Sheriff, James Albert, Sheriff, Republican
- Treasurer, Jared M Squires, Republican
State House of Representatives[15]
| District | Representative | Party |
|---|---|---|
| 33 | Carrie Delrosso | Republican |
| 52 | Ryan Warner | Republican |
| 54 | Bob Brooks | Republican |
| 55 | Jason Silvis | Republican |
| 56 | George Dunbar | Republican |
| 57 | Eric Nelson | Republican |
| 58 | Eric Davanzo | Republican |
| 59 | Leslie Rossi | Republican |
State Senate[15]
| District | Senator | Party |
|---|---|---|
| 32 | Patrick J. Stefano | Republican |
| 39 | Kim Ward | Republican |
| 41 | Joe Pittman | Republican |
| 45 | Jim Brewster | Democratic |
United States House of Representatives
| District | Representative | Party |
|---|---|---|
| 13 | John Joyce | Republican |
| 14 | Guy Reschenthaler | Republican |
United States Senate
| Senator | Party |
|---|---|
| Pat Toomey | Republican |
| Bob Casey | Democratic |
Education
Public school districts
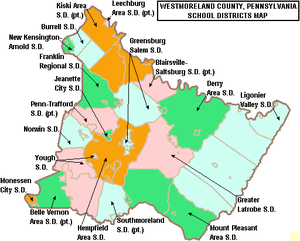
School districts:[16]
- Belle Vernon Area School District (Also in Fayette County)
- Blairsville-Saltsburg School District (Also in Indiana County)
- Burrell School District
- Derry Area School District
- Franklin Regional School District
- Greater Latrobe School District
- Greensburg-Salem School District
- Hempfield Area School District
- Jeannette City School District
- Kiski Area School District (Also in Armstrong County)
- Leechburg Area School District (Also in Armstrong County)
- Ligonier Valley School District
- Monessen City School District
- Mount Pleasant Area School District
- New Kensington–Arnold School District
- Norwin School District
- Penn-Trafford School District (also in Allegheny County)
- Southmoreland School District (also in Fayette County)
- Yough School District
Public charter schools
- Dr. Robert Ketterer Charter School grades 7th through 12th Latrobe (since 2008)
According to EdNA[17]
Private high school
- Greensburg Central Catholic High School
Colleges and universities
- Penn State New Kensington
- Seton Hill University
- Saint Vincent College
- Westmoreland County Community College
- University of Pittsburgh at Greensburg
- Carlow College at Greensburg
- Triangle Tech
Additional
- Northern Westmoreland Career and Technology Center
Economy
Coal mining became a major industry in the county after the Civil War, followed by expansion of manufacturing of iron, steel and glass. The 600-acre coke works for the Isabella Furnace were built in Cokeville (then Coketown) in Spring of 1872.[18][19] At one point, company "coal patches" (towns built for miners) represented about one-third of the county's settlements.[20] A major strike by coal miners represented by the United Mine Workers of America took place in 1910–1911. Sixteen people were killed in the strike.[21]
In 2020 the top industries in the county were health care and social services (16.3% of jobs), manufacturing (13.8%) and retail trade (13.7%).[22] Mining comprised less than 1% of the jobs in the county. Westmoreland County is now believed to be the site of over 100 abandoned mines.[23][24]
Volkswagen's Westmoreland plant near New Stanton in Westmoreland County was the first foreign-owned factory mass-producing automobiles in the U.S. It operated from 1978 to 1988.
Recreation
There are four Pennsylvania state parks in Westmoreland County.
- Keystone State Park
- Laurel Ridge State Park
- Laurel Summit State Park
- Linn Run State Park
Communities

Under Pennsylvania law, there are four types of incorporated municipalities: cities, boroughs, townships, and, in at most two cases, towns. The following cities, boroughs and townships are located in Westmoreland County:
Cities
- Arnold
- Greensburg (county seat)
- Jeannette
- Latrobe
- Lower Burrell
- Monessen
- New Kensington
Boroughs
- Adamsburg
- Arona
- Avonmore
- Bolivar
- Delmont
- Derry
- Donegal
- East Vandergrift
- Export
- Hunker
- Hyde Park
- Irwin
- Laurel Mountain
- Ligonier
- Madison
- Manor
- Mount Pleasant
- Murrysville
- New Alexandria
- New Florence
- New Stanton
- North Belle Vernon
- North Irwin
- Oklahoma
- Penn
- Scottdale
- Seward
- Smithton
- South Greensburg
- Southwest Greensburg
- Sutersville
- Trafford (partly in Allegheny County)
- Vandergrift
- West Leechburg
- West Newton
- Youngstown
- Youngwood
Townships
Census-designated places
Census-designated places are geographical areas designated by the U.S. Census Bureau for the purposes of compiling demographic data. They are not actual jurisdictions under Pennsylvania law. Other unincorporated communities, such as villages, may be listed here as well.
Unincorporated communities
- Acme
- Alverton
- Ardara
- Armbrust
- Baggaley
- Bessemer
- Blackstone
- Boquet
- Bovard
- Brenizer
- Carbon
- Claridge
- Forbes Road
- Greenwald
- Hannastown
- Hopewell
- Hutchinson
- Jacobs Creek
- Jones Mills
- Kecksburg
- Larimer
- Laughlintown
- Lloydsville
- Lowber
- Luxor
- Marguerite
- Morewood
- Moween
- New Derry
- Pandora
- Peanut
- Pleasant Unity
- Reagantown
- Rector
- Reduction
- Ruffs Dale
- Salina
- Scab Hill
- Seger
- Southwest
- Stahlstown
- Standard Shaft
- Tarrs
- Torrance
- Trauger
- Turkeytown
- United
- Wendel
- Westmoreland City
- Whitney
- Yohoghany
Former community
- Franklin Township - now known as Murrysville, Pennsylvania[25][26][27]
Population ranking
The population ranking of the following table is based on the 2010 census of Westmoreland County.[28]
† county seat
| Rank | City/Town/etc. | Municipal type | Population (2010 Census) |
|---|---|---|---|
| 1 | Murrysville | Municipality | 20,079 |
| 2 | † Greensburg | City | 14,892 |
| 3 | New Kensington | City | 13,116 |
| 4 | Lower Burrell | City | 11,761 |
| 5 | Jeannette | City | 9,654 |
| 6 | Latrobe | City | 8,338 |
| 7 | Monessen | City | 7,720 |
| 8 | Vandergrift | Borough | 5,205 |
| 9 | Arnold | City | 5,157 |
| 10 | Mount Pleasant | Borough | 4,454 |
| 11 | Scottdale | Borough | 4,384 |
| 12 | Level Green | CDP | 4,020 |
| 13 | Irwin | Borough | 3,973 |
| 14 | Loyalhanna | CDP | 3,428 |
| 15 | Manor | Borough | 3,239 |
| 16 | Trafford (partially in Allegheny County) | Borough | 3,174 |
| 17 | Youngwood | Borough | 3,050 |
| 18 | Derry | Borough | 2,688 |
| 19 | Delmont | Borough | 2,686 |
| 20 | West Newton | Borough | 2,633 |
| 21 | Lawson Heights | CDP | 2,194 |
| 22 | New Stanton | Borough | 2,173 |
| 23 | Southwest Greensburg | Borough | 2,155 |
| 24 | South Greensburg | Borough | 2,117 |
| 25 | Lynnwood-Pricedale | CDP | 2,031 |
| 26 | North Belle Vernon | Borough | 1,971 |
| 27 | Ligonier | Borough | 1,573 |
| 28 | St. Vincent College | CDP | 1,357 |
| 29 | West Leechburg | Borough | 1,294 |
| 30 | Calumet | CDP | 1,241 |
| 31 | Fellsburg | CDP | 1,180 |
| 32 | Collinsburg | CDP | 1,125 |
| 33 | Avonmore | Borough | 1,011 |
| 34 | Norvelt | CDP | 948 |
| 35 | Export | Borough | 917 |
| 36 | North Irwin | Borough | 846 |
| 37 | Oklahoma | Borough | 809 |
| 38 | Herminie | CDP | 789 |
| 39 | Hostetter | CDP | 740 |
| 40 | New Florence | Borough | 689 |
| 41 | Yukon | CDP | 677 |
| 42 | East Vandergrift | Borough | 674 |
| 43 | Sutersville | Borough | 605 |
| 44 | Millwood | CDP | 566 |
| 45 | New Alexandria | Borough | 560 |
| 46 | Bradenville | CDP | 545 |
| 47 | Grapeville | CDP | 538 |
| 48 | Mammoth | CDP | 525 |
| 49 | Hyde Park | Borough | 500 |
| 50 | Seward | Borough | 495 |
| 51 | Wyano | CDP | 484 |
| 52 | Penn | Borough | 475 |
| 53 | Bolivar | Borough | 465 |
| 54 | Smithton | Borough | 399 |
| 55 | Madison | Borough | 397 |
| 56 | Slickville | CDP | 388 |
| 57 | Arona | Borough | 370 |
| 58 | Youngstown | Borough | 326 |
| 59 | Hunker | Borough | 291 |
| 60 | Crabtree | CDP | 277 |
| 61 | Webster | CDP | 255 |
| 62 | Adamsburg | Borough | 172 |
| 63 | Laurel Mountain | Borough | 167 |
| 64 | Harrison City | CDP | 134 |
| 65 | Donegal | Borough | 120 |
Notable people
- David Alter, born in Westmoreland County, noted inventor[29]
- Pete Babando, former NHL Hockey player, played for 1950 Stanley Cup champions Detroit Red Wings, born in Braeburn neighborhood of the City of Lower Burrell.
- George Blanda, Hall of Fame football player, born in Youngwood.
- D.J. Coffman, comic book artist and writer, creator of Hero By Night. Born in Mt. Pleasant. Resides in Scottdale.
- Johnny Costa, jazz pianist, was born and raised in Arnold.
- Jesse Root Grant, (father of Ulysses S. Grant General and President) born in Greensburg.
- Shirley Jones, Academy Award-winning actress and singer, grew up in Smithton.
- Sheila Kelley, American actor, born and raised in Greensburg, Pa. Founder of Sheila Kelley S Factor exercise and lifestyle program.
- Bill Mazeroski, Hall of Fame baseball player
- Michael Moorer, boxer
- Arnold Palmer, golfer, was born and raised in Latrobe.
- Terrelle Pryor NFL quarterback, attended Jeannette high school.
- Fred Rogers, television personality, was born, raised, and lived in Latrobe; buried in Unity Cemetery, Unity Township just outside Latrobe.
- Arthur St. Clair, American Revolution Major General, Patriot, 9th President of the Continental Congress, buried in Greensburg, Pa.
- Willie Thrower, football player, was born and raised in New Kensington.
- Jim White, KMOX radio talk show host, born and raised in Greensburg, Pa.
- Jacob Zimmerman (born 1831), newspaper editor, newspaper owner, Illinois politician, mine owner, real estate entrepreneur, and businessman.
See also
- National Register of Historic Places listings in Westmoreland County, Pennsylvania
- Westmoreland Choral Society
References
- "State & County QuickFacts". United States Census Bureau. Archived from the original on August 7, 2011. Retrieved November 22, 2013.
- "Find a County". National Association of Counties. Retrieved June 7, 2011.
- "2010 Census Gazetteer Files". United States Census Bureau. August 22, 2012. Retrieved March 11, 2015.
- "U.S. Decennial Census". United States Census Bureau. Retrieved March 11, 2015.
- "Historical Census Browser". University of Virginia Library. Retrieved March 11, 2015.
- Forstall, Richard L., ed. (March 24, 1995). "Population of Counties by Decennial Census: 1900 to 1990". United States Census Bureau. Retrieved March 11, 2015.
- "Census 2000 PHC-T-4. Ranking Tables for Counties: 1990 and 2000" (PDF). United States Census Bureau. April 2, 2001. Archived (PDF) from the original on October 9, 2022. Retrieved March 11, 2015.
- "Census 2020".
- "U.S. Census website". United States Census Bureau. Retrieved September 14, 2017.
- "P2 HISPANIC OR LATINO, AND NOT HISPANIC OR LATINO BY RACE – 2020: DEC Redistricting Data (PL 94-171) – Westmoreland County, Pennsylvania".
- "Voter registration statistics by county". Dos.state.pa.us. Retrieved November 7, 2022.
- "Voters shake up row offices, toss Democrats - TribLIVE". Archive.today. September 9, 2012. Archived from the original on September 9, 2012. Retrieved October 9, 2018.
- "Dave Leip's Atlas of U.S. Presidential Elections". uselectionatlas.org. Retrieved January 28, 2021.
- Leip, David. "Dave Leip's Atlas of U.S. Presidential Elections". Uselectionatlas.org. Retrieved October 9, 2018.
- Center, Legislativate Data Processing. "Find Your Legislator". The official website for the Pennsylvania General Assembly. Retrieved April 21, 2017.
- "2020 CENSUS - SCHOOL DISTRICT REFERENCE MAP: Westmoreland County, PA" (PDF). U.S. Census Bureau. Archived (PDF) from the original on October 9, 2022. Retrieved July 20, 2022. - Text list
- Pennsylvania Department of Education, Education Names and Addresses, 2012
- Charles T G Looney (1974). "The Isabella Furnace at Etna, near Pittsburgh, Pennsylvania, built 1872" (PDF). Washington, DC: Society for Industrial Archeology. Retrieved July 23, 2022.
- Baer, Christopher T. (May 2016). "PRR Chronology 1872" (PDF). Pennsylvania Railroad Historical and Technical Society. Archived (PDF) from the original on October 9, 2022. Retrieved July 23, 2022.
- Muller, Edward and Carlisle, Ronald. "Westmoreland County, Pennsylvania: An Inventory of Historic Engineering and Industrial Sites". National Park Service, U.S. Department of the Interior. Retrieved February 8, 2022.
{{cite web}}: CS1 maint: multiple names: authors list (link) - Norwood, Stephen H. (2002). Strikebreaking and Intimidation: Mercenaries and Masculinity in Twentieth-Century America. The University of North Carolina Press. ISBN 978-0807853733.
- "Westmoreland County Profile, January 2022" (PDF). Workstats. dli.pa.gov. Archived (PDF) from the original on October 9, 2022. Retrieved February 8, 2022.
- Napsh, Joe (February 8, 2022). "Pa. mine cleanup funding hailed". Tribune-Review.
- "Mine Maps Index, Westmoreland County". Pennsylvania Mine Map Atlas. Pennsylvania State University. Retrieved February 8, 2022.
- "History Franklin Township Westmoreland County, Pa". History.rays-place.com. Retrieved October 9, 2018.
- "Westmoreland County Pennsylvania Atlas, 1867". Usgwarchives.net. Retrieved October 9, 2018.
- "Franklin Township, Westmoreland County Pennsylvania". Pa-roots.com. Retrieved October 9, 2018.
- "This site has been redesigned and relocated. - U.S. Census Bureau". Census.gov. Retrieved October 9, 2018.
- Who Was Who in America, Historical Volume, 1607–1896. Marquis Who's Who. 1967.
External links
Places adjacent to Westmoreland County, Pennsylvania | ||||||||||||||||
|---|---|---|---|---|---|---|---|---|---|---|---|---|---|---|---|---|
| ||||||||||||||||

Pittsburgh–New Castle–Weirton combined statistical area | ||
| Counties |  | |
| Major cities | ||
| Cities and towns 15k–50k (in 2010) | ||
| Airports | ||
| Topics |
| |
| ||
Authority control | |
|---|---|
| General | |
| National libraries | |
| Other |
|
На других языках
[de] Westmoreland County (Pennsylvania)
Das Westmoreland County[3] ist ein County im US-Bundesstaat Pennsylvania. Bei der Volkszählung im Jahr 2020 hatte das County 354.663 Einwohner und eine Bevölkerungsdichte von 133,5 Einwohnern pro Quadratkilometer.[4] Der Verwaltungssitz (County Seat) ist Greensburg.- [en] Westmoreland County, Pennsylvania
[ru] Уэстморленд (округ, Пенсильвания)
Округ Уэстморленд (англ. Westmoreland County) располагается в штате Пенсильвания, США. Официально образован 26-го февраля 1773 года. По состоянию на 2010 год, численность населения составляла 365 169 человек.Другой контент может иметь иную лицензию. Перед использованием материалов сайта WikiSort.org внимательно изучите правила лицензирования конкретных элементов наполнения сайта.
WikiSort.org - проект по пересортировке и дополнению контента Википедии