world.wikisort.org - USA
Blair County is a county located in the U.S. Commonwealth of Pennsylvania. As of the 2020 census, the population was 122,822.[2] Its county seat is Hollidaysburg.[3] The county was created on February 26, 1846, from parts of Huntingdon and Bedford counties.
Blair County | |
|---|---|
U.S. county | |
 Blair County Courthouse, Hollidaysburg | |
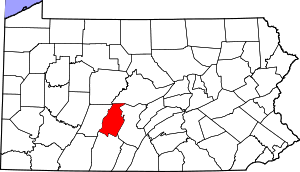 Location within the U.S. state of Pennsylvania | |
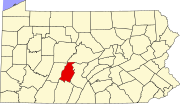
 Pennsylvania's location within the U.S. | |
| Coordinates: 40°28′N 78°21′W | |
| Country | |
| State | |
| Founded | February 26, 1846 |
| Seat | Hollidaysburg |
| Largest city | Altoona |
| Area | |
| • Total | 527 sq mi (1,360 km2) |
| • Land | 526 sq mi (1,360 km2) |
| • Water | 1.3 sq mi (3 km2) 0.2% |
| Population (2020) | |
| • Total | 122,822 |
| • Density | 234/sq mi (90/km2) |
| Time zone | UTC−5 (Eastern) |
| • Summer (DST) | UTC−4 (EDT) |
| Congressional district | 13th |
| Website | www |
Pennsylvania Historical Marker | |
| Designated | April 13, 1982[1] |
Blair County comprises the Altoona, PA Metropolitan Statistical Area. It is also part of the Altoona-Huntingdon, PA Combined Statistical Area, which includes Blair and Huntingdon counties.[4]
Geography
According to the U.S. Census Bureau, the county has a total area of 527 square miles (1,360 km2), of which 526 square miles (1,360 km2) is land and 1.3 square miles (3.4 km2) (0.2%) is water.[5]
Features
- Brush Mountain
- Logan Valley
- Morrison Cove
- Tussey Mountain
Adjacent counties
- Centre County (north)
- Huntingdon County (east)
- Bedford County (south)
- Cambria County (west)
- Clearfield County (northwest)
National protected area
- Allegheny Portage Railroad National Historic Site (part)
Major highways

 I-99 / US 220
 US 22
US 22 US 220 Bus.
 PA 36
PA 36 PA 164
 PA 350
 PA 453
 PA 550
 PA 764
 PA 865
 PA 866
 PA 867
 PA 867 Truck
Climate
Blair has a warm-summer humid continental climate (Dfb).
| Climate data for Altoona | |||||||||||||
|---|---|---|---|---|---|---|---|---|---|---|---|---|---|
| Month | Jan | Feb | Mar | Apr | May | Jun | Jul | Aug | Sep | Oct | Nov | Dec | Year |
| Record high °F (°C) | 78 (26) |
76 (24) |
85 (29) |
91 (33) |
94 (34) |
97 (36) |
103 (39) |
102 (39) |
96 (36) |
90 (32) |
82 (28) |
12 (−11) |
103 (39) |
| Average high °F (°C) | 31.9 (−0.1) |
34.6 (1.4) |
44.7 (7.1) |
57.8 (14.3) |
67.6 (19.8) |
77.1 (25.1) |
81.4 (27.4) |
80.3 (26.8) |
72.3 (22.4) |
61.3 (16.3) |
49.4 (9.7) |
37.1 (2.8) |
57.9 (14.4) |
| Average low °F (°C) | 15.6 (−9.1) |
17.7 (−7.9) |
25.5 (−3.6) |
36.6 (2.6) |
46.8 (8.2) |
54.9 (12.7) |
60.2 (15.7) |
58.4 (14.7) |
51.3 (10.7) |
41.4 (5.2) |
32.1 (0.1) |
21.9 (−5.6) |
38.5 (3.6) |
| Record low °F (°C) | −29 (−34) |
−25 (−32) |
−7 (−22) |
8 (−13) |
20 (−7) |
32 (0) |
38 (3) |
34 (1) |
26 (−3) |
15 (−9) |
0 (−18) |
−13 (−25) |
−29 (−34) |
| Average precipitation inches (mm) | 2.64 (67) |
2.43 (62) |
3.48 (88) |
3.63 (92) |
4.30 (109) |
4.08 (104) |
4.14 (105) |
3.50 (89) |
3.85 (98) |
3.43 (87) |
3.71 (94) |
3.11 (79) |
42.64 (1,083) |
| Average snowfall inches (cm) | 11.2 (28) |
14.3 (36) |
16.9 (43) |
2.5 (6.4) |
0.1 (0.25) |
0 (0) |
0 (0) |
0 (0) |
0 (0) |
0.2 (0.51) |
3.3 (8.4) |
12.1 (31) |
60.6 (154) |
| Source: Pennsylvania State Climatologist[6] | |||||||||||||
Demographics
| Historical population | |||
|---|---|---|---|
| Census | Pop. | %± | |
| 1850 | 21,777 | — | |
| 1860 | 27,829 | 27.8% | |
| 1870 | 38,051 | 36.7% | |
| 1880 | 52,740 | 38.6% | |
| 1890 | 70,866 | 34.4% | |
| 1900 | 85,099 | 20.1% | |
| 1910 | 108,858 | 27.9% | |
| 1920 | 128,334 | 17.9% | |
| 1930 | 139,840 | 9.0% | |
| 1940 | 140,358 | 0.4% | |
| 1950 | 139,519 | −0.6% | |
| 1960 | 137,270 | −1.6% | |
| 1970 | 135,356 | −1.4% | |
| 1980 | 136,621 | 0.9% | |
| 1990 | 130,542 | −4.4% | |
| 2000 | 129,144 | −1.1% | |
| 2010 | 127,089 | −1.6% | |
| 2020 | 122,822 | −3.4% | |
| [7] | |||
As of the census[8] of 2000, there were 127,089 people and 52,159 households within the county. The population density was 246 people per square mile (95/km2). There were 55,061 housing units at an average density of 105 per square mile (40/km2). The racial makeup of the county was 96.18% White, 1.68% Black or African American, 0.11% Native American, 0.56% Asian, 0.02% Pacific Islander, 0.23% from other races, and 1.22% from two or more races. 0.97% of the population were Hispanic or Latino of any race. 40.0% were of German, 12.2% Irish, 10.7% Italian, 9.9% American and 6.0% English ancestry.
There were 52,159 households, out of which 28.4% had children under the age of 18 living with them, 52.60% were married couples living together, 11.20% had a female householder with no husband present, and 32.30% were non-families. 27.80% of all households were made up of individuals, and 13.30% had someone living alone who was 65 years of age or older. The average household size was 2.43 and the average family size was 2.96.
In the county, the population was spread out, with 21.1% under the age of 18, 3.5% from 18 to 19, 5.9% from 20 to 24, 11.1% from 25 to 34, 19.3% from 35 to 49, 21.4% from 50 to 64, and 17.7% who were 65 years of age or older. The median age was 40 years. The population was 48.55% male, and 51.45% female.
2020 Census
| Race | Num. | Perc. |
|---|---|---|
| White (NH) | 113,016 | 92% |
| Black or African American (NH) | 2,463 | 2% |
| Native American (NH) | 134 | 0.1% |
| Asian (NH) | 868 | 0.7% |
| Pacific Islander (NH) | 12 | 0.01% |
| Other/Mixed (NH) | 4,621 | 3.76% |
| Hispanic or Latino | 1,708 | 1.4% |
Law and government
Blair County is a Republican Party stronghold. In only two elections has the Democrat won the vote of the county, and one other election won by the Progressive Party.
| Year | Republican | Democratic | Third party | |||
|---|---|---|---|---|---|---|
| No. | % | No. | % | No. | % | |
| 2020 | 45,306 | 71.07% | 17,636 | 27.67% | 806 | 1.26% |
| 2016 | 39,135 | 70.72% | 13,958 | 25.22% | 2,248 | 4.06% |
| 2012 | 33,319 | 66.16% | 16,276 | 32.32% | 770 | 1.53% |
| 2008 | 32,708 | 61.37% | 19,813 | 37.17% | 777 | 1.46% |
| 2004 | 35,751 | 65.99% | 18,105 | 33.42% | 322 | 0.59% |
| 2000 | 28,376 | 62.86% | 15,774 | 34.94% | 990 | 2.19% |
| 1996 | 21,282 | 52.30% | 15,036 | 36.95% | 4,373 | 10.75% |
| 1992 | 21,447 | 47.92% | 14,857 | 33.19% | 8,454 | 18.89% |
| 1988 | 25,623 | 61.50% | 15,588 | 37.42% | 451 | 1.08% |
| 1984 | 30,104 | 65.52% | 15,651 | 34.06% | 190 | 0.41% |
| 1980 | 28,931 | 62.41% | 15,014 | 32.39% | 2,414 | 5.21% |
| 1976 | 28,290 | 59.73% | 18,397 | 38.84% | 679 | 1.43% |
| 1972 | 33,126 | 75.10% | 10,023 | 22.72% | 961 | 2.18% |
| 1968 | 28,780 | 59.59% | 15,803 | 32.72% | 3,713 | 7.69% |
| 1964 | 24,301 | 48.09% | 26,157 | 51.76% | 73 | 0.14% |
| 1960 | 35,297 | 64.40% | 19,445 | 35.48% | 67 | 0.12% |
| 1956 | 33,623 | 65.68% | 17,503 | 34.19% | 65 | 0.13% |
| 1952 | 32,113 | 65.44% | 16,851 | 34.34% | 106 | 0.22% |
| 1948 | 22,382 | 60.68% | 14,050 | 38.09% | 454 | 1.23% |
| 1944 | 24,925 | 57.82% | 18,003 | 41.76% | 178 | 0.41% |
| 1940 | 26,639 | 55.11% | 21,573 | 44.63% | 125 | 0.26% |
| 1936 | 24,711 | 46.98% | 27,038 | 51.41% | 848 | 1.61% |
| 1932 | 19,553 | 56.95% | 13,709 | 39.93% | 1,073 | 3.13% |
| 1928 | 34,356 | 73.53% | 12,104 | 25.90% | 266 | 0.57% |
| 1924 | 20,313 | 65.93% | 4,244 | 13.78% | 6,251 | 20.29% |
| 1920 | 15,035 | 56.97% | 5,668 | 21.48% | 5,689 | 21.56% |
| 1916 | 9,893 | 55.16% | 7,002 | 39.04% | 1,040 | 5.80% |
| 1912 | 3,138 | 18.16% | 4,108 | 23.78% | 10,030 | 58.06% |
| 1908 | 10,583 | 63.01% | 4,981 | 29.66% | 1,232 | 7.34% |
| 1904 | 12,482 | 73.46% | 3,675 | 21.63% | 835 | 4.91% |
| 1900 | 9,749 | 65.81% | 4,528 | 30.57% | 537 | 3.62% |
| 1896 | 10,382 | 65.50% | 4,840 | 30.53% | 629 | 3.97% |
| 1892 | 7,407 | 56.75% | 5,265 | 40.34% | 380 | 2.91% |
| 1888 | 7,311 | 56.95% | 5,175 | 40.31% | 351 | 2.73% |
| 1884 | 6,396 | 55.96% | 4,649 | 40.67% | 385 | 3.37% |
| 1880 | 5,808 | 53.95% | 4,728 | 43.92% | 230 | 2.14% |
County commissioners
- Bruce Erb, Chair, Republican
- Laura Burke, Vice-chair, Democrat
- Amy Webster, Secretary, Republican
Other county offices
- Clerk of Courts and Prothonotary, Robin Patton, Republican
- Controller, A.C. Stickel, Republican
- Coroner, Patricia Ross, Republican
- District Attorney, Pete Weeks, Republican
- Register of Wills and Recorder of Deeds, Mary Ann Bennis, Republican
- Sheriff, James Ott, Republican
- Treasurer, James Carothers, Republican
Police agencies
- Allegheny Township Police
- Altoona City Police
- Altoona Area School District Police
- Amtrak Police Department
- Bellwood Borough Police
- Blair County District Attorneys Office
- Blair County Parole & Probation Office
- Blair County Sheriff's Office
- Blair Township Police
- Central Pennsylvania Humane Society Police
- Duncansville Borough Police
- Freedom Township Police
- Greenfield Township Police
- Hollidaysburg Borough Police
- Logan Township Police
- Martinsburg Borough Police
- Norfolk Southern Railroad Police
- North Woodbury Township Police
- Pennsylvania Department of Conservation and Natural Resources
- Pennsylvania Fish and Boat Commission
- Pennsylvania Game Commission
- Pennsylvania State Police
- Pennsylvania State University Altoona Police
- Roaring Spring Borough Police
- Spring Cove School District Police
- Tyrone Borough Police
- Tyrone Area School District Police
- United States Postal Inspection Service
- UPMC Altoona Hospital Police
- Van Zandt VA Hospital Police
- Williamsburg Borough Police
State Senate
- Judy Ward, Republican, Pennsylvania's 30th Senatorial District
State House of Representatives
- Louis C. Schmitt Jr., Republican, Pennsylvania's 79th Representative District
- James Gregory, Republican, Pennsylvania's 80th Representative District
United States House of Representatives
- John Joyce, Republican, Pennsylvania's 13th congressional district
United States Senate
- Pat Toomey, Republican
- Bob Casey, Democrat
Politics
As of November 1, 2021, there are 77,618 registered voters in Blair County.[12]
- Republican: 47,140 (60.73%)
- Democratic: 20,800 (26.8%)
- Independent: 6,530 (8.41%)
- Third Party: 3,148 (4.06%)
Education

Colleges and universities
- Penn State Altoona
Community, junior and technical colleges
- South Hills School of Business and Technology
- YTI Career Institute
- Pennsylvania Highlands Community College
Public school districts
- Altoona Area School District
- Bellwood-Antis School District
- Claysburg-Kimmel School District (also in Bedford County)
- Hollidaysburg Area School District
- Penn Cambria School District (also in Cambria County)
- Spring Cove School District
- Tyrone Area School District (also in Centre and Huntingdon Counties)
- Williamsburg Community School District
Charter schools
- Agora Cyber Charter School
- Central Pennsylvania Digital Learning Foundation Charter School (K-12). Altoona.
Technology school
- Greater Altoona Career and Technology Center - Altoona
Private schools
- Alternative Education Program - Hollidaysburg
- Holy Trinity Middle School - Altoona
- Holy Trinity Elementary School - Altoona Campus
- Holy Trinity Elementary School - Hollidaysburg Campus
- Altoona Hospital School of Nursing
- Bishop Guilfoyle Catholic High School - Altoona
- Blair County Christian School - Duncansville
- Champion Life Christian Academy - Altoona
- Cove Lane Parochial School - Martinsburg
- Crawford Elementary at Adelphoi Village
- Emmanuel Baptist Christian School - Claysburg
- Faith Tabernacle School - Altoona
- Great Commission Schools - Altoona
- Harbor House Center Early Academy - Altoona
- Heritage Christian School - Martinsburg
- Hollidaysburg Catholic School - Hollidaysburg
- Living Water Christian Academy - Williamsburg
- Northwestern Human Services Autism School
- Penn Mont Academy - Hollidaysburg
- Penn Mont at Penn State Altoona
- Piney Creek Parochial School - New Enterprise
- Shady Grove School - Martinsburg
- Shady Pond School - Altoona
- St John Evangelist School - Altoona
- St Matthew School - Tyrone
- St Patrick School - Newry
- Sylvan Learning Center - Hollidaysburg
- Tender Love for Children - Altoona
- The Nehemiah Project - Altoona
- Training & Development Tech - Hollidaysburg
- White Oak School - Tyrone
Data taken from Pennsylvania EdNA - PDE database of public private schools 2012
Libraries
Blair County hosts a system of nine libraries that can be accessed with one library card. Resource sharing exists between the eight libraries. Books from any of the eight system libraries can be placed on hold and delivered to a patron's home library and then returned to any of the eight libraries in the system.
- Altoona Area Public Library - Altoona
- Bellwood Antis Public Library - Bellwood
- Blair County Library System - Altoona
- Claysburg Area Public Library - Claysburg
- Hollidaysburg Area Public Library - Hollidaysburg
- Martinsburg Community Library - Martinsburg
- Roaring Spring Community Library - Roaring Spring
- Tyrone-Snyder Twnshp Pub Library - Tyrone
- Williamsburg Public Library - Williamsburg
Recreation
There is one Pennsylvania state park in Blair County.
- Canoe Creek State Park
Communities

Under Pennsylvania law, there are four types of incorporated municipalities: cities, boroughs, townships, and, in at most two cases, towns. The following cities, boroughs and townships are located in Blair County:
City
Boroughs
- Bellwood
- Duncansville
- Hollidaysburg (county seat)
- Martinsburg
- Newry
- Roaring Spring
- Tunnelhill (mostly in Cambria County)
- Tyrone
- Williamsburg
Townships
Census-designated places
Census-designated places are geographical areas designated by the U.S. Census Bureau for the purposes of compiling demographic data. They are unincorporated communities and not actual jurisdictions under Pennsylvania law.
- Bald Eagle
- Beavertown
- Blue Knob
- Brooks Mill
- Canan Station
- Canoe Creek
- Carson Valley
- Charlottsville
- Clappertown
- Claysburg
- Cotton Town
- Cove Forge
- Cross Keys
- Culp
- Curryville
- Dumb Hundred
- East Altoona
- East Freedom
- East Sharpsburg
- Elberta
- Eldorado
- Fisherville
- Foot of Ten
- Fort Fetter
- Fostoria
- Franklin Forge
- Frankstown
- Fredericksburg
- Friesville
- Ganister
- Geeseytown
- Gray
- Grazierville
- Greenwood
- Henrietta
- Homewood at Martinsburg
- Ironville
- Jugtown
- Juniata Gap
- Klahr
- Lakemont
- Larke
- Leamersville
- Linds Crossing
- Loop
- Martinsburg Junction
- McKee
- Mill Run
- Millerstown
- Moores Mill
- Nealmont
- Newburg
- Northwood
- Olivia
- Ore Hill
- Oreminea
- Penn Farms
- Pinecroft
- Point View
- Puzzletown
- Red Hill
- Reese
- Reightown
- Reservoir
- Robeson Extension
- Roots
- Royer
- Shelltown
- Shellytown
- Sickles Corner
- Skelp
- Ski Gap
- Smith Corner
- Spring Drive Mobile Home Park
- Sproul
- St. Clair
- Sunbrook
- Sylvan Hills
- Tipton
- Tyrone Forge
- Vail
- Vicksburg
- Wopsononock
- Yellow Springs
Population ranking
The population ranking of the following table is based on the 2010 census of Blair County.[13]
† county seat
| Rank | City/Town/etc. | Population (2010 Census) | Municipal type | Incorporated |
|---|---|---|---|---|
| 1 | Altoona | 46,320 | City | 1854 (borough) 1868 (city) |
| 2 | † Hollidaysburg | 5,791 | Borough | 1836 |
| 3 | Tyrone | 5,477 | Borough | 1857 |
| 4 | Bellwood | 3,564 | Borough | 1898 |
| 5 | Roaring Spring | 2,585 | Borough | 1888 |
| 6 | Greenwood | 2,458 | CDP | |
| 7 | Martinsburg | 1,958 | Borough | 1832 |
| 8 | Lakemont | 1,868 | CDP | |
| 9 | Claysburg | 1,625 | CDP | |
| 10 | Williamsburg | 1,254 | Borough | 1827 |
| 11 | Duncansville | 1,233 | Borough | 1891 |
| 12 | Tipton | 1,083 | CDP | |
| 13 | East Freedom | 972 | CDP | |
| 14 | Foot of Ten | 672 | CDP | |
| 15 | Grazierville | 665 | CDP | |
| 16 | Tunnelhill (mostly in Cambria County) | 363 | Borough | 1876 |
| 17 | Northwood | 296 | CDP | |
| 18 | Newry | 270 | Borough | 1876 |
See also
- National Register of Historic Places listings in Blair County, Pennsylvania
References
- "PHMC Historical Markers Search" (Searchable database). Pennsylvania Historical and Museum Commission. Commonwealth of Pennsylvania. Retrieved January 25, 2014.
- "Census - Geography Profile: Blair County, Pennsylvania". United States Census Bureau. Retrieved April 24, 2022.
- "Find a County". National Association of Counties. Archived from the original on May 31, 2011. Retrieved June 7, 2011.
- Bureau, US Census. "Combined Statistical Areas Map (March 2020)" (PDF). The United States Census Bureau. Archived (PDF) from the original on October 21, 2020. Retrieved August 11, 2021.
- "2010 Census Gazetteer Files". United States Census Bureau. August 22, 2012. Retrieved March 5, 2015.
- "Monthly Averages for Altoona, PA". psac.met.psu. 2009. Archived from the original on September 7, 2008. Retrieved July 5, 2009.
- "Census 2020".
- "U.S. Census website". United States Census Bureau. Retrieved January 31, 2008.
- "P2 HISPANIC OR LATINO, AND NOT HISPANIC OR LATINO BY RACE – 2020: DEC Redistricting Data (PL 94-171) – Blair County, Pennsylvania".
- Leip, David. "Dave Leip's Atlas of U.S. Presidential Elections". uselectionatlas.org. Retrieved November 21, 2018.
- Burnham, Walter Dean. "Presidential ballots, 1836-1892". archive.org. Retrieved January 16, 2021.
{{cite web}}: CS1 maint: url-status (link) - https://www.dos.pa.gov/VotingElections/OtherServicesEvents/VotingElectionStatistics/Documents/currentvotestats.xls [bare URL spreadsheet file]
- "2010 U.S. Census website". United States Census Bureau. Retrieved February 13, 2016.
External links
- Blair County Business and Information Directory
- Forever Free: Blair County's Civil War
- The Blair County Historical Society
- Blair County government
- Blair County Chamber of Commerce
- Catharine Township
- Morrisons Cove Herald
Places adjacent to Blair County, Pennsylvania | ||||||||||||||||
|---|---|---|---|---|---|---|---|---|---|---|---|---|---|---|---|---|
| ||||||||||||||||
Authority control | |
|---|---|
| General | |
| National libraries | |
| Other | |
На других языках
[de] Blair County
Blair County[1] ist ein County im Bundesstaat Pennsylvania der Vereinigten Staaten. Bei der Volkszählung im Jahr 2020 hatte das County 122.822 Einwohner und eine Bevölkerungsdichte von 90 Einwohner pro Quadratkilometer.[2] Der Verwaltungssitz (County Seat) ist Hollidaysburg.- [en] Blair County, Pennsylvania
[ru] Блэр (округ)
Блэр (англ. Blair County) — округ в штате Пенсильвания, США. Официально образован 26-го февраля 1846 года. По состоянию на 2010 год, численность населения составляла 127 089 человек.Другой контент может иметь иную лицензию. Перед использованием материалов сайта WikiSort.org внимательно изучите правила лицензирования конкретных элементов наполнения сайта.
WikiSort.org - проект по пересортировке и дополнению контента Википедии