world.wikisort.org - USA
Lawrence County is a county located in the U.S. state of Pennsylvania. As of the 2010 census, the population was 91,108.[1] The county seat is New Castle.[2]
Lawrence County | |
|---|---|
U.S. county | |
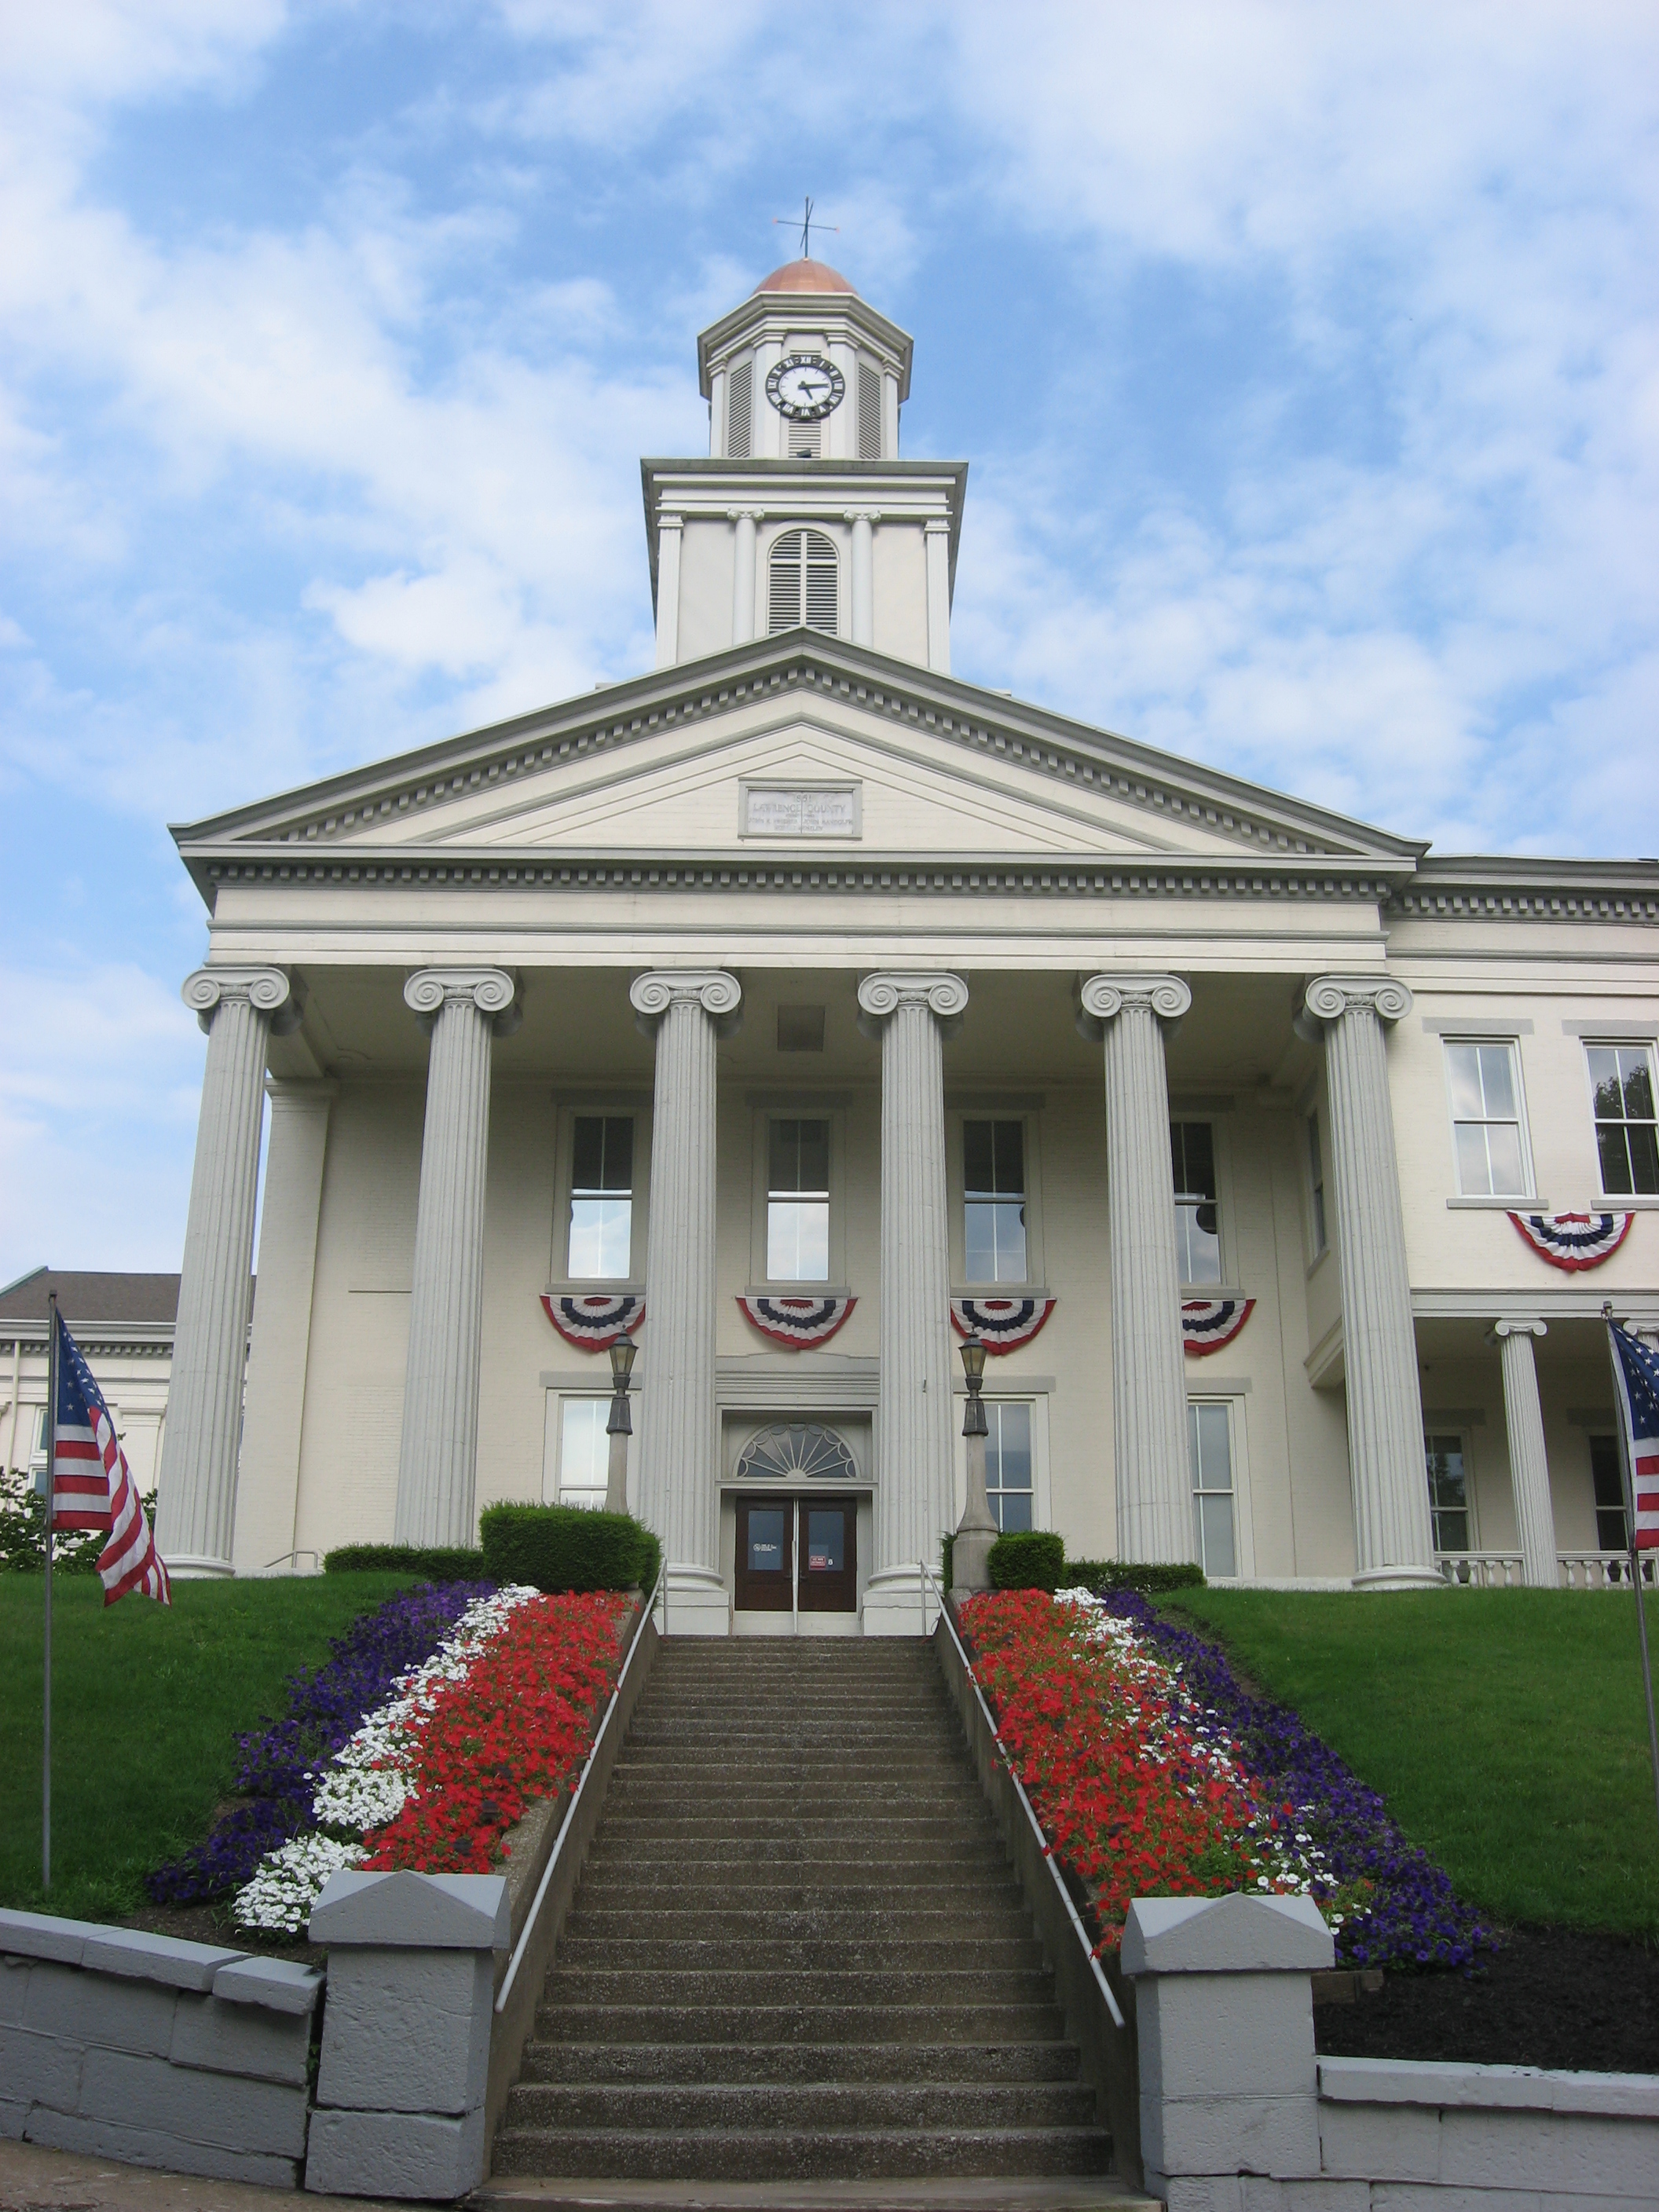 Lawrence County Courthouse | |
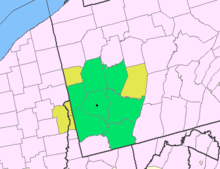
 Location within the U.S. state of Pennsylvania | |
 Pennsylvania's location within the U.S. | |
| Coordinates: 40°59′N 80°20′W | |
| Country | |
| State | |
| Founded | March 20, 1849 |
| Named for | USS Lawrence |
| Seat | New Castle |
| Largest city | New Castle |
| Area | |
| • Total | 363 sq mi (940 km2) |
| • Land | 358 sq mi (930 km2) |
| • Water | 4.5 sq mi (12 km2) 1.3%% |
| Population | |
| • Estimate (2020) | 85,083 |
| • Density | 246/sq mi (95/km2) |
| Time zone | UTC−5 (Eastern) |
| • Summer (DST) | UTC−4 (EDT) |
| Congressional district | 16th |
| Website | www |
Lawrence County comprises the entire New Castle, PA Micropolitan Statistical Area, which is also included in the larger Pittsburgh-New Castle-Weirton, PA-WV-OH Combined Statistical Area.
History
Lawrence County was created on March 20, 1849, from parts of Beaver and Mercer counties due to the rapid growth of New Castle, which was primarily in Mercer County but was rapidly expanding into Beaver County. The former borders between Beaver and Mercer Counties are still evident in Lawrence County today, as the northern borders of North Beaver Township, Shenango Township, and Slippery Rock Township with (respectively) the southern borders of Mahoning Township, Hickory Township, and Scott Township make up the former boundaries between Beaver and Mercer Counties. In addition, County Line Road in New Castle where the Lawrence County Courthouse is located also marks the former boundaries.
The county was named after the flagship of Commodore Oliver Hazard Perry, the USS Lawrence, which was disabled in the 10 September 1813 Battle of Lake Erie during the War of 1812. The ship's complement included local raw recruits. That niagara-class brig (more correctly: snow) was itself a namesake, of Perry's friend and naval officer James Lawrence, who died during the War of 1812.[3]
Geography
According to the U.S. Census Bureau, the county has a total area of 363 square miles (940 km2), of which 358 square miles (930 km2) is land and 4.5 square miles (12 km2) (1.3%) is water.[4] Major waterways are the Shenango River, Neshannock Creek and the Mahoning River which form the Beaver River. Also, the Slippery Rock Creek and Connoquenessing Creak empty into the Beaver River. It has a humid continental climate (Dfa/Dfb) and average monthly temperatures in New Castle range from 27.7 °F in January to 72.2 °F in July.
Adjacent counties
- Mercer County (north)
- Butler County (east)
- Beaver County (south)
- Columbiana County, Ohio (southwest)
- Mahoning County, Ohio (west)
Demographics
| Historical population | |||
|---|---|---|---|
| Census | Pop. | %± | |
| 1850 | 21,079 | — | |
| 1860 | 22,999 | 9.1% | |
| 1870 | 27,298 | 18.7% | |
| 1880 | 33,312 | 22.0% | |
| 1890 | 37,517 | 12.6% | |
| 1900 | 57,042 | 52.0% | |
| 1910 | 70,032 | 22.8% | |
| 1920 | 85,545 | 22.2% | |
| 1930 | 97,258 | 13.7% | |
| 1940 | 96,877 | −0.4% | |
| 1950 | 105,120 | 8.5% | |
| 1960 | 112,965 | 7.5% | |
| 1970 | 107,374 | −4.9% | |
| 1980 | 107,150 | −0.2% | |
| 1990 | 96,246 | −10.2% | |
| 2000 | 94,639 | −1.7% | |
| 2010 | 91,108 | −3.7% | |
| 2020 | 86,070 | −5.5% | |
| [5] | |||
As of the 2000 census[6] there were 94,643 people, 37,091 households, and 25,889 families residing in the county. The population density was 263 people per square mile (101/km2). There were 39,635 housing units at an average density of 110 per square mile (42/km2). The racial makeup of the county was 94.98% White, 3.61% Black or African American, 0.10% Native American, 0.27% Asian, 0.01% Pacific Islander, 0.19% from other races, and 0.84% from two or more races. 0.56% of the population were Hispanic or Latino of any race. 34.2% English or Welsh, 14.6% were of Italian, 12.4% American, 9.0% German, 8.1% Irish, and 6.8% Scotch-Irish, 2.5% Polish, and 1.9% African ancestry.
There were 37,091 households, out of which 28.80% had children under the age of 18 living with them, 54.50% were married couples living together, 11.50% had a female householder with no husband present, and 30.20% were non-families. 27.00% of all households were made up of individuals, and 14.40% had someone living alone who was 65 years of age or older. The average household size was 2.47 and the average family size was 3.00.
In the county, the population was spread out, with 23.10% under the age of 18, 8.30% from 18 to 24, 25.70% from 25 to 44, 23.60% from 45 to 64, and 19.30% who were 65 years of age or older. The median age was 40 years. For every 100 females, there were 90.60 males. For every 100 females age 18 and over, there were 86.90 males.
2020 Census
| Race | Num. | Perc. |
|---|---|---|
| White (NH) | 75,811 | 88.1% |
| Black or African American (NH) | 3,546 | 4.12% |
| Native American (NH) | 75 | 0.1% |
| Asian (NH) | 321 | 0.37% |
| Pacific Islander (NH) | 4 | 0.01% |
| Other/Mixed (NH) | 4,658 | 5.4% |
| Hispanic or Latino | 1,655 | 2% |
Micropolitan Statistical Area
The United States Office of Management and Budget[8] has designated Lawrence County as the New Castle, PA Micropolitan Statistical Area (MSA). As of the 2010 U.S. Census[9] the micropolitan area ranked 3rd most populous in the State of Pennsylvania and the 48th most populous in the United States with a population of 91,108. Lawrence County is also a part of the Pittsburgh-New Castle-Weirton, PA-OH-WV Combined Statistical Area (CSA), which combines the population of Lawrence, as well as the Allegheny, Armstrong, Beaver, Butler, Fayette, Indiana, Washington and Westmoreland county areas in Pennsylvania. In West Virginia the counties included are Brooke and Hancock. And in Ohio, Jefferson County. The Combined Statistical Area ranked 4th in the State of Pennsylvania and 20th most populous in the United States with a population of 2,660,727.
Government and politics

Biden: 50–60% 60–70%
Trump: 50–60% 60–70% 70–80% 80–90%
| Year | Republican | Democratic | Third party | |||
|---|---|---|---|---|---|---|
| No. | % | No. | % | No. | % | |
| 2020 | 29,597 | 64.08% | 15,978 | 34.59% | 612 | 1.33% |
| 2016 | 25,428 | 61.90% | 14,009 | 34.11% | 1,639 | 3.99% |
| 2012 | 21,047 | 53.71% | 17,513 | 44.69% | 629 | 1.61% |
| 2008 | 21,851 | 51.60% | 19,711 | 46.54% | 787 | 1.86% |
| 2004 | 21,938 | 50.50% | 21,387 | 49.23% | 117 | 0.27% |
| 2000 | 18,060 | 45.56% | 20,593 | 51.95% | 987 | 2.49% |
| 1996 | 13,088 | 36.10% | 18,993 | 52.38% | 4,178 | 11.52% |
| 1992 | 12,359 | 30.00% | 20,830 | 50.55% | 8,014 | 19.45% |
| 1988 | 15,829 | 41.76% | 21,884 | 57.74% | 191 | 0.50% |
| 1984 | 19,277 | 44.43% | 23,981 | 55.27% | 128 | 0.30% |
| 1980 | 18,404 | 45.77% | 19,506 | 48.51% | 2,303 | 5.73% |
| 1976 | 18,546 | 43.49% | 23,337 | 54.73% | 757 | 1.78% |
| 1972 | 23,712 | 56.06% | 17,595 | 41.60% | 990 | 2.34% |
| 1968 | 18,360 | 42.60% | 21,027 | 48.78% | 3,716 | 8.62% |
| 1964 | 15,998 | 35.39% | 29,092 | 64.35% | 117 | 0.26% |
| 1960 | 23,646 | 49.20% | 24,309 | 50.58% | 109 | 0.23% |
| 1956 | 25,037 | 55.61% | 19,923 | 44.25% | 65 | 0.14% |
| 1952 | 23,319 | 52.12% | 21,164 | 47.31% | 255 | 0.57% |
| 1948 | 17,186 | 52.72% | 14,632 | 44.88% | 781 | 2.40% |
| 1944 | 18,886 | 51.57% | 17,331 | 47.33% | 403 | 1.10% |
| 1940 | 19,361 | 50.41% | 18,814 | 48.99% | 230 | 0.60% |
| 1936 | 15,458 | 40.58% | 21,994 | 57.74% | 638 | 1.67% |
| 1932 | 13,064 | 55.10% | 9,390 | 39.61% | 1,255 | 5.29% |
| 1928 | 20,012 | 74.95% | 6,417 | 24.03% | 273 | 1.02% |
| 1924 | 12,533 | 64.58% | 1,880 | 9.69% | 4,993 | 25.73% |
| 1920 | 9,448 | 64.38% | 2,720 | 18.53% | 2,508 | 17.09% |
| 1916 | 5,134 | 49.44% | 3,966 | 38.19% | 1,285 | 12.37% |
| 1912 | 2,128 | 21.62% | 1,976 | 20.07% | 5,741 | 58.31% |
| 1908 | 5,350 | 54.06% | 2,656 | 26.84% | 1,890 | 19.10% |
| 1904 | 7,634 | 66.35% | 1,894 | 16.46% | 1,978 | 17.19% |
| 1900 | 6,343 | 61.39% | 2,754 | 26.66% | 1,235 | 11.95% |
| 1896 | 6,228 | 65.13% | 3,013 | 31.51% | 321 | 3.36% |
| 1892 | 4,385 | 60.10% | 2,336 | 32.02% | 575 | 7.88% |
| 1888 | 4,342 | 62.56% | 2,113 | 30.44% | 486 | 7.00% |
As of February 21, 2022, there are 55,823 registered voters in Lawrence County.[11]
Chart of Voter Registration
- Republican: 26,478 (47.43%)
- Democratic : 22,567 (40.43%)
- Independent: 4,564 (8.18%)
- Third Party: 2,214 (3.97%)
County commissioners
- Morgan Boyd, Chairman, Republican
- Dan Vogler, Republican
- Loretta Spielvogel, Democrat
Other county officials
- Clerk of Courts and Prothonotary, Jodi Esoldo, Democrat
- Controller, David Gettings, Republican
- District Attorney, Joshua Lamancusa, Democrat
- Register of Wills and Recorder of Deeds, Janet Kalajainen, Democrat
- Sheriff, Perry Quahliero, Democrat
- Treasurer, Richard Rapone, Democrat
- Coroner, Richard Johnson, Democrat
State House of Representatives[12]
- Christopher Sainato, Democrat, 9th district
- Aaron Bernstine, Republican, 10th district
- Parke Wentling, Republican, 17th district
State Senators[12]
- Elder Vogel, Republican, 47th district
United States House of Representatives
- Mike Kelly, Republican, 16th district
United States Senate
- Pat Toomey, Republican
- Bob Casey, Jr., Democrat
Education
Colleges
- Butler Community College Lawrence Crossing Campus
- Westminster College - New Wilmington
Public school districts
- Blackhawk School District (part)
- Ellwood City Area School District (part)
- Laurel School District
- Mohawk Area School District
- Neshannock Township School District
- New Castle Area School District
- Shenango School District
- Union Area School District
- Wilmington Area School District (part)
Tech schools
- Lawrence County Career Technology Center - New Castle
- New Castle School of Trades - New Castle
Private schools
- Apple Grove School - New Wilmington
- Cherry Hill School - New Wilmington
- Cotton School - New Wilmington
- Ellwood City Children's Center, Inc.
- Faith Country Chapel Preschool and Kindergarten - New Castle
- Fayette School - Volant
- Hillside Parochial School - New Wilmington
- Indian Run School - New Wilmington
- J R Wilson School - New Wilmington
- Ligo School - New Wilmington
- Little Beaver Parochial School - Enon Valley
- Lusk School - Volant
- Meadow Lark School - New Wilmington
- New Castle Christian Academy - New Castle
- Parents Preschool Ellwood City
- Shepherd School - Volant
- St Vitus Catholic School - New Castle
- Thorn Hill School - Volant
- Westminster Preschool - New Wilmington
Per data provided at Pennsylvania EdNA
Libraries
- Ellwood City Area Public Library
- F D Campbell Memorial Library - Bessemer
- Lawrence County Federated Library System - New Castle
- New Castle Public Library
Transportation
Airports
Public transit
- New Castle Area Transit Authority
Major roads and highways

 I-76 / Penna Turnpike
 I-79
I-79 I-376
I-376 US 19
US 19 US 224
 US 422
 US 422 Bus.
 PA 18
PA 18 PA 65
PA 65 PA 108
 PA 158
 PA 168
 PA 208
 PA 288
 PA 317
 PA 351
 PA 388
 PA 488
 PA 551
 PA 956
Recreation
Parks
- Cascade Park (New Castle)
- Ewing Park (Ellwood City)
- Gaston Park (New Castle)
- McConnells Mill State Park (Slippery Rock Twp)
- Pearson Park (Neshannock Twp)
- West Park Nature Center (Union Twp)
- Marti Park
- New Wilmington Borough Park
State Game Lands
- SGL 148 (New Beaver)
- SGL 150 (Pulaski Twp)
- SGL 151 (Washington Twp)
- SGL 178 (Neshannock Twp)
- SGL 216 (Scott Twp)
Trails
- North Country Trail
- Stavich Bike Trail
- Neshannock Trail
Municipalities

Under Pennsylvania law, there are four types of incorporated municipalities: cities, boroughs, townships, and, in at most two cases, towns. The following cities, boroughs and townships are located in Lawrence County:
City
- New Castle (county seat)
Boroughs
- Bessemer
- Ellport
- Ellwood City (partly in Beaver County)
- Enon Valley
- New Beaver
- New Wilmington
- S.N.P.J.
- South New Castle
- Volant
- Wampum
Townships
Census-designated places
Census-designated places are geographical areas designated by the U.S. Census Bureau for the purposes of compiling demographic data. They are not actual jurisdictions under Pennsylvania law. Other unincorporated communities, such as villages, may be listed here as well.
Unincorporated communities
Various unincorporated communities that lie within and are part of official municipalities.
- Altman
- Castlewood
- Cottage Grove
- Coverts
- Duckrun
- Eastbrook
- Edinburg
- Energy
- Gibsondale
- Grant City
- Harbor
- Harlansburg
- Hillsville
- Joyce
- McCaslin
- Moravia
- Mount Jackson
- Pulaski
- Rockville
- Rose Point
- Skidmore
- Sunset Valley
- Villa Maria
- Walmo
- Wiegletown
- Wurtemberg
Former community
- Big Beaver Borough- became a borough on March 7, 1958. Until that date it was known as Big Beaver Township which was formed in 1802 when South Beaver Township was divided. In 1849 when Lawrence County was created, the new county line split Big Beaver leaving a township of that name in each county. Big Beaver in Lawrence County is now known as New Beaver Borough.[13]
Population ranking
The population ranking of the following table is based on the 2010 census of Lawrence County.[14]
† county seat
| Rank | City/Town/etc. | Municipal type | Population (2010 Census) |
|---|---|---|---|
| 1 | † New Castle | City | 23,273 |
| 2 | Ellwood City (partially in Beaver County) | Borough | 7,921 |
| 3 | New Wilmington | Borough | 2,466 |
| 4 | Oakwood | CDP | 2,270 |
| 5 | Oakland | CDP | 1,569 |
| 6 | New Beaver | Borough | 1,502 |
| 7 | New Castle Northwest | CDP | 1,413 |
| 8 | Ellport | Borough | 1,180 |
| 9 | Bessemer | Borough | 1,111 |
| 10 | New Bedford | CDP | 925 |
| 11 | West Pittsburg | CDP | 808 |
| 12 | Wampum | Borough | 717 |
| 13 | South New Castle | Borough | 709 |
| 14 | Frizzleburg | CDP | 602 |
| 15 | Chewton | CDP | 488 |
| 16 | Enon Valley | Borough | 306 |
| 17 | Volant | Borough | 168 |
| 18 | S.N.P.J. | Borough | 19 |
See also
- National Register of Historic Places listings in Lawrence County, Pennsylvania
- Jordan Brown case
References
- "State & County QuickFacts". United States Census Bureau. Archived from the original on June 6, 2011. Retrieved November 17, 2013.
- "Find a County". National Association of Counties. Archived from the original on May 31, 2011. Retrieved June 7, 2011.
- Gannett, Henry (1905). The Origin of Certain Place Names in the United States. U.S. Government Printing Office. p. 182.
- "2010 Census Gazetteer Files". United States Census Bureau. August 22, 2012. Retrieved March 8, 2015.
- "Census 2020".
- "U.S. Census website". United States Census Bureau. Retrieved January 31, 2008.
- "P2 HISPANIC OR LATINO, AND NOT HISPANIC OR LATINO BY RACE – 2020: DEC Redistricting Data (PL 94-171) – Lawrence County, Pennsylvania".
- "Office of Management and Budget". whitehouse.gov. Archived from the original on April 29, 2018.
- "2010 U.S. Census website". United States Census Bureau. Retrieved July 10, 2016.
- Leip, David. "Dave Leip's Atlas of U.S. Presidential Elections". uselectionatlas.org. Archived from the original on March 23, 2018.
- "Voter registration statistics by county". November 2, 2021.. Dos.state.pa.us. Retrieved on February 23, 2022.
- Center, Legislativate Data Processing. "Find Your Legislator". The official website for the Pennsylvania General Assembly. Archived from the original on April 28, 2017. Retrieved April 27, 2017.
- "Welcome To Big Beaver Borough - Big Beaver Borough". bigbeaverborough.org. Archived from the original on December 26, 2014.
- CNMP, US Census Bureau. "U.S. Census Bureau". www.census.gov.
External links
- Tourism - http://www.visitlawrencecounty.com/
- Government - http://www.co.lawrence.pa.us/
- Economic Development - http://www.lawrencecounty.com/
- Chamber of Commerce - https://web.archive.org/web/20071006161144/http://www.lawrencecountychamber.com/
- Fishing - http://www.fish.state.pa.us/
- Hunting - http://www.pgc.state.pa.us/
- History - http://www.lawrencechs.com/
Municipalities and communities of Lawrence County, Pennsylvania, United States | ||
|---|---|---|
County seat: New Castle | ||
| City |  | |
| Boroughs | ||
| Townships | ||
| CDPs | ||
| Unincorporated communities | ||
| Footnotes | ‡This populated place also has portions in an adjacent county or counties | |
| ||
Pittsburgh–New Castle–Weirton combined statistical area | ||
| Counties | | |
| Major cities | ||
| Cities and towns 15k–50k (in 2010) | ||
| Airports | ||
| Topics |
| |
| ||
Authority control | |
|---|---|
| General | |
| National libraries | |
| Other |
|
На других языках
[de] Lawrence County (Pennsylvania)
Lawrence County[1] ist ein County im Bundesstaat Pennsylvania der Vereinigten Staaten. Bei der Volkszählung im Jahr 2020 hatte das County 86.070 Einwohner und eine Bevölkerungsdichte von 92 Einwohner pro Quadratkilometer.[2] Der Verwaltungssitz (County Seat) ist New Castle.- [en] Lawrence County, Pennsylvania
[ru] Лоренс (округ, Пенсильвания)
Округ Лоренс (англ. Lawrence County) располагается в штате Пенсильвания, США. Официально образован в году. По состоянию на 2010 год, численность населения составляла 91 108 человек.Другой контент может иметь иную лицензию. Перед использованием материалов сайта WikiSort.org внимательно изучите правила лицензирования конкретных элементов наполнения сайта.
WikiSort.org - проект по пересортировке и дополнению контента Википедии