world.wikisort.org - USA
Mahoning County is a county in the U.S. state of Ohio. As of the 2020 census, the population was 228,614.[1] Its county seat and largest city is Youngstown.[2] The county is named for a Lenape word meaning "at the licks" or "there is a lick", referring to the salt licks in the area.[3] Mahoning County was formed on March 1, 1846; the 83rd county in Ohio.[4] Until 1846, the area that is now Mahoning County was part of Trumbull and Columbiana counties, when the counties in the area were redefined and Mahoning County emerged as a new county.[5] Mahoning County is part of the Youngstown-Warren-Boardman, OH-PA Metropolitan Statistical Area.
This article uses bare URLs, which are uninformative and vulnerable to link rot. (September 2022) |
Mahoning County | |
|---|---|
U.S. county | |
 Mahoning County Courthouse | |
 Seal | |
 Location within the U.S. state of Ohio | |
 Ohio's location within the U.S. | |
| Coordinates: 41°01′N 80°46′W | |
| Country | |
| State | |
| Founded | March 1, 1846 |
| Named for | A Native American word for salt lick |
| Seat | Youngstown |
| Largest city | Youngstown |
| Area | |
| • Total | 425 sq mi (1,100 km2) |
| • Land | 412 sq mi (1,070 km2) |
| • Water | 14 sq mi (40 km2) 3.2%% |
| Population (2020) | |
| • Total | 228,614 |
| • Estimate (2021) | 226,762 |
| • Density | 540/sq mi (210/km2) |
| Time zone | UTC−5 (Eastern) |
| • Summer (DST) | UTC−4 (EDT) |
| Congressional districts | 6th, 13th |
| Website | www |
History
In the year 1600, Mahoning County was likely divided between two Nations of Native peoples- the Erie in the east [6] and the Whittlesey Culture in the west.[7] We do not currently know where the actual boundaries between these cultures lied, though the nearest confirmed Whittlesey settlement was at Cleveland and the nearest confirmed Erie settlement was just barely across the Ohio-PA border, in Ashtabula County. The Erie were an Iroquoian people who likely arrived sometime between the years 1100-1300 AD, after chasing out an older nation of "Mound Builders."[8] The Whittlesey were likely Algonquian, but lived in longhouses, rather than the traditional Algonquian wigwams.
Following the Beaver Wars, when the Iroquois Confederacy declared war on many of the tribes of the Great Lakes region over several decades and destroyed them, new tribes moved into this area. The tribes who shared the resources of the Mahoning Valley included the Seneca, Lenape (Delaware), Shawnee and Wyandot. The Seneca and Wyandot were Iroquoians and the Lenape and Shawnee were Algonquians. As northeast Ohio later came to be under control of the settlers as part of the Western Reserve, all these tribes were pushed further westward or southward, before eventually being removed from Ohio by the United States in the early-mid 1800s.
Some former known Native American sites that existed in Mahoning County include the council rock [9] and the North Benton burial mound.[10] Council Rock was where the Shawnee and Lenape were known to gather for collective holiday celebrations, religion ceremonies and political meetings and once sat in the center of Youngstown. Though the rock was moved long ago, it still rests in what is now Lincoln Park. The North Benton burial mound was once located on the outskirts of North Benton, Ohio and was removed by archeologists. It was attributed to the Hopewell Culture, but contained unique features, such as sculptures of constellations made of white rocks and clay laid out at ground level and a pit full of mixed human bones in one corner. It shared features with two other burial mounds found and excavated in Kent, OH and Warren, PA and represents a completely unique style of burial mound in Ohio.
Prior to its formation of a county in 1846, Mahoning County was a destination for a family of Huguenot refugees in the early 1800s.[11]
In the 1900s, Youngstown was a hub for the steel industry and for local mob groups, who gained their power through the liquor and gambling industries during prohibition, remaining a key safety issue for the region until the 70s. It was also the home to Warner Theatre, where the Warner Bros. film studio got its start and remained a hub for early film and television for decades. The film Night of the Living Dead by Romero takes place in Mahoning County. An extensive German community used to exist in the township of Berlin, until pressure to fully assimilate after the World Wars against Germany ended it. The Briar Hill Pizza was invented in the neighborhood of Briar Hill in Youngstown and is considered a local delicacy.
Geography
According to the United States Census Bureau, the county has an area of 425 square miles (1,100 km2), of which 412 square miles (1,070 km2) is land and 14 square miles (36 km2) (3.2%) is water.[12]
Adjacent counties
- Trumbull County (north)
- Mercer County, Pennsylvania (northeast)
- Lawrence County, Pennsylvania (east)
- Columbiana County (south)
- Stark County (southwest)
- Portage County (northwest)
Major Highways
 I-76
I-76 I-76 / Ohio Turnpike
 I-80 / Ohio Turnpike
- I-80
 I-680
I-680 US 62
US 62 US 224
 US 422
 SR 7
SR 7 SR 11
SR 11 SR 14
SR 14 SR 45
SR 45 SR 46
SR 46 SR 164
 SR 165
 SR 170
 SR 193
 SR 289
 SR 446
 SR 534
 SR 616
 SR 617
 SR 625
 SR 626
 SR 630
Demographics
| Historical population | |||
|---|---|---|---|
| Census | Pop. | %± | |
| 1850 | 23,735 | — | |
| 1860 | 25,894 | 9.1% | |
| 1870 | 31,001 | 19.7% | |
| 1880 | 42,871 | 38.3% | |
| 1890 | 55,979 | 30.6% | |
| 1900 | 70,134 | 25.3% | |
| 1910 | 116,151 | 65.6% | |
| 1920 | 186,310 | 60.4% | |
| 1930 | 236,142 | 26.7% | |
| 1940 | 240,251 | 1.7% | |
| 1950 | 257,629 | 7.2% | |
| 1960 | 300,480 | 16.6% | |
| 1970 | 303,424 | 1.0% | |
| 1980 | 289,487 | −4.6% | |
| 1990 | 264,806 | −8.5% | |
| 2000 | 257,555 | −2.7% | |
| 2010 | 238,823 | −7.3% | |
| 2020 | 228,614 | −4.3% | |
| 2021 (est.) | 226,762 | [13] | −0.8% |
| U.S. Decennial Census[14] 1790-1960[15] 1900-1990[16] 1990-2000[17] 2010-2020[1] | |||

2000 census
As of the census[18] of 2000, there were 257,555 people, 102,587 households, and 68,835 families living in the county. The population density was 620 people per square mile (239/km2). There were 111,762 housing units at an average density of 269 per square mile (104/km2). The racial makeup of the county was 81.04% White, 15.87% Black or African American, 0.17% Native American, 0.47% Asian, 0.02% Pacific Islander, 1.03% from other races, and 1.38% from two or more races. 2.97% of the population were Hispanic or Latino of any race.
93.1% spoke English, 2.6% Spanish, 1.0% Italian, and 0.5% Greek as their first language.[19]
There were 102,587 households, out of which 28.40% had children under the age of 18 living with them, 49.00% were married couples living together, 14.10% had a female householder with no husband present, and 32.90% were non-families. 29.10% of all households were made up of individuals, and 13.10% had someone living alone who was 65 years of age or older. The average household size was 2.44 and the average family size was 3.02.
In the county, the population was spread out, with 23.70% under the age of 18, 8.40% from 18 to 24, 26.40% from 25 to 44, 23.70% from 45 to 64, and 17.80% who were 65 years of age or older. The median age was 40 years. For every 100 females there were 91.40 males. For every 100 females age 18 and over, there were 88.00 males.
The median income for a household in the county was $35,248, and the median income for a family was $44,185. Males had a median income of $36,313 versus $23,272 for females. The per capita income for the county was $18,818. About 9.60% of families and 12.50% of the population were below the poverty line, including 19.10% of those under age 18 and 8.70% of those age 65 or over.
2010 census
As of the 2010 census, there were 238,823 people, 98,712 households, and 62,676 families living in the county.[20] The population density was 580.2 inhabitants per square mile (224.0/km2). There were 111,833 housing units at an average density of 271.7 per square mile (104.9/km2).[21] The racial makeup of the county was 79.9% white, 15.7% black or African American, 0.7% Asian, 0.2% American Indian, 1.4% from other races, and 2.1% from two or more races. Those of Hispanic or Latino origin made up 4.7% of the population.[20] In terms of ancestry, 21.4% were German, 18.4% were Italian, 16.6% were Irish, 8.9% were English, and 4.2% were American.[22]
Of the 98,712 households, 27.9% had children under the age of 18 living with them, 43.7% were married couples living together, 15.0% had a female householder with no husband present, 36.5% were non-families, and 31.8% of all households were made up of individuals. The average household size was 2.34 and the average family size was 2.94. The median age was 42.9 years.[20]
The median income for a household in the county was $40,123 and the median income for a family was $52,489. Males had a median income of $44,516 versus $31,969 for females. The per capita income for the county was $22,824. About 12.6% of families and 16.6% of the population were below the poverty line, including 25.9% of those under age 18 and 10.0% of those age 65 or over.[23]
Economy
Top Employers
According to the county's 2019 Comprehensive Annual Financial Report,[24] the top employers in the county are:
| # | Employer | # of Employees |
|---|---|---|
| 1 | Mercy Health | 3,000 |
| 2 | Youngstown City School District | 1,791 |
| 3 | Mahoning County | 1,600 |
| 4 | Youngstown State University | 1,200 |
| 5 | VXI Global Solutions | 1,100 |
| 6 | City of Youngstown | 1,063 |
| 7 | Infocision Management | 1,050 |
| 8 | Windsor House Assisted Living | 850 |
| 9 | Austintown Local School District | 800 |
| 10 | Akron Children's Hospital | 800 |
Politics
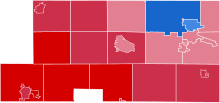
Biden: 60–70% 70–80%
Trump: 50–60% 60–70% 70–80%
Mahoning County is historically Democratic-leaning, voting for the Democratic presidential candidate in every election from 1976 through 2016. Between 1976 and 2012 Mahoning County voted Democratic by at least a margin of 17 percentage points for every election. In 2016, Hillary Clinton won the county over Donald Trump by 3.3 percent, the smallest margin since 1972; in 2012, Barack Obama carried the county over Mitt Romney by a solid 28.3 percent. However, in 2020, Donald Trump flipped the county Republican for the first time since Richard Nixon's national landslide victory in 1972, carrying it by a margin of 1.9 percentage points.
At the statewide level, Mahoning County generally votes Democratic as well. Since 1970, the county has only voted Republican twice at the gubernatorial level – in the landslide elections of 1994 and 2014.
Mahoning County is split between two U.S. congressional districts: Ohio's 13th Congressional District and Ohio's 6th Congressional District. The respective standing representatives as of the 2020 election are Congressman Tim Ryan and Congressman Bill Johnson.
| Year | Republican | Democratic | Third party | |||
|---|---|---|---|---|---|---|
| No. | % | No. | % | No. | % | |
| 2020 | 59,903 | 50.26% | 57,641 | 48.36% | 1,646 | 1.38% |
| 2016 | 53,616 | 46.23% | 57,381 | 49.48% | 4,974 | 4.29% |
| 2012 | 42,641 | 35.07% | 77,059 | 63.38% | 1,884 | 1.55% |
| 2008 | 45,319 | 35.50% | 79,173 | 62.02% | 3,167 | 2.48% |
| 2004 | 48,761 | 36.69% | 83,194 | 62.60% | 949 | 0.71% |
| 2000 | 40,460 | 35.45% | 69,212 | 60.65% | 4,447 | 3.90% |
| 1996 | 31,397 | 26.57% | 72,716 | 61.53% | 14,065 | 11.90% |
| 1992 | 31,191 | 24.82% | 64,731 | 51.52% | 29,728 | 23.66% |
| 1988 | 43,722 | 36.40% | 75,524 | 62.87% | 880 | 0.73% |
| 1984 | 53,424 | 40.65% | 76,514 | 58.21% | 1,500 | 1.14% |
| 1980 | 50,153 | 40.07% | 63,677 | 50.88% | 11,331 | 9.05% |
| 1976 | 46,314 | 36.96% | 75,837 | 60.53% | 3,143 | 2.51% |
| 1972 | 64,144 | 49.69% | 62,428 | 48.36% | 2,516 | 1.95% |
| 1968 | 42,948 | 34.75% | 68,433 | 55.38% | 12,197 | 9.87% |
| 1964 | 33,775 | 27.08% | 90,934 | 72.92% | 0 | 0.00% |
| 1960 | 51,927 | 38.73% | 82,143 | 61.27% | 0 | 0.00% |
| 1956 | 63,992 | 51.98% | 59,126 | 48.02% | 0 | 0.00% |
| 1952 | 53,164 | 43.98% | 67,722 | 56.02% | 0 | 0.00% |
| 1948 | 37,365 | 36.94% | 62,468 | 61.76% | 1,313 | 1.30% |
| 1944 | 35,184 | 33.42% | 70,102 | 66.58% | 0 | 0.00% |
| 1940 | 37,496 | 32.91% | 76,441 | 67.09% | 0 | 0.00% |
| 1936 | 24,825 | 27.32% | 64,886 | 71.41% | 1,147 | 1.26% |
| 1932 | 39,713 | 52.35% | 33,139 | 43.68% | 3,009 | 3.97% |
| 1928 | 48,341 | 63.82% | 26,928 | 35.55% | 479 | 0.63% |
| 1924 | 37,647 | 68.12% | 9,335 | 16.89% | 8,282 | 14.99% |
| 1920 | 29,736 | 63.85% | 14,941 | 32.08% | 1,893 | 4.06% |
| 1916 | 11,256 | 44.62% | 13,013 | 51.59% | 956 | 3.79% |
| 1912 | 5,839 | 28.20% | 6,838 | 33.03% | 8,026 | 38.77% |
| 1908 | 10,760 | 51.18% | 9,312 | 44.29% | 951 | 4.52% |
| 1904 | 10,404 | 59.97% | 4,436 | 25.57% | 2,510 | 14.47% |
| 1900 | 8,939 | 53.57% | 7,402 | 44.36% | 345 | 2.07% |
| 1896 | 8,529 | 55.27% | 6,772 | 43.88% | 131 | 0.85% |
| 1892 | 5,806 | 45.54% | 6,358 | 49.87% | 586 | 4.60% |
| 1888 | 6,162 | 51.31% | 5,337 | 44.44% | 511 | 4.25% |
| 1884 | 6,007 | 55.59% | 4,432 | 41.01% | 367 | 3.40% |
| 1880 | 4,943 | 53.33% | 4,044 | 43.63% | 282 | 3.04% |
| 1876 | 3,921 | 48.47% | 3,691 | 45.62% | 478 | 5.91% |
| 1872 | 3,757 | 59.13% | 2,518 | 39.63% | 79 | 1.24% |
| 1868 | 3,387 | 55.13% | 2,757 | 44.87% | 0 | 0.00% |
| 1864 | 3,044 | 55.71% | 2,420 | 44.29% | 0 | 0.00% |
| 1860 | 2,907 | 57.51% | 1,990 | 39.37% | 158 | 3.13% |
| 1856 | 2,323 | 54.16% | 1,937 | 45.16% | 29 | 0.68% |
Government
County commissioners
| Commissioner | Party | Title |
|---|---|---|
| David Ditzler | Democratic | President |
| Carol Rimedio-Righetti | Democratic | |
| Anthony Traficanti | Democratic | |
County officials
| Office | Official | Party |
|---|---|---|
| Auditor | Ralph Meacham | Republican |
| Clerk of Courts | Anthony Vivo | Democratic |
| Coroner | David Kennedy | Democratic |
| Engineer | Patrick Ginnetti | Democratic |
| Prosecuting Attorney | Paul Gains | Democratic |
| Recorder | Noralynn Palermo | Democratic |
| Sheriff | Jerry Greene | Democratic |
| Treasurer | Daniel Yemma | Democratic |
Judgeships
| Court | Judge | Party |
|---|---|---|
| Court of Common Pleas | Anthony D'Apolito | Democratic |
| Court of Common Pleas | Anthony Donofrio | Democratic |
| Court of Common Pleas | John Durkin | Democratic |
| Court of Common Pleas | R. Scott Krichbaum | Republican |
| Court of Common Pleas | Maureen Sweeney | Republican |
| Court of Common Pleas Domestic Relations Court | Beth Smith | Democratic |
| Court of Common Pleas Juvenile Division | Theresa Dellick | Republican |
| Court of Common Pleas Probate Court | Robert Rusu | Independent |
| Mahoning County Court #2 - Boardman | Joseph Houser | Republican |
| Mahoning County Court #3 - Sebring | Joe Schiavoni | Democratic |
| Mahoning County Court #4 - Austintown | Scott Hunter | Republican |
| Mahoning County Court #5 - Canfield | Molly Johnson | Republican |
| Struthers Municipal Court | Dominic Leone III | Democratic |
| Youngstown Municipal Court | Carla Baldwin | Democratic |
| Youngstown Municipal Court | Renee DiSalvo | Republican |
| 7th District Court of Appeals | David A. D’Apolito | Democratic |
| 7th District Court of Appeals | Gene Donofrio | Democratic |
| 7th District Court of Appeals | Carol Ann Robb | Republican |
| 7th District Court of Appeals | Cheryl L. Waite | Democratic |
Ohio House of Representatives
| District | Representative | Party |
|---|---|---|
| 58 | Michele Lepore-Hagan | Democratic |
| 59 | Alessandro Cutrona | Republican |
Ohio State Senate
| District | Senator | Party |
|---|---|---|
| 33 | Michael Rulli | Republican |
United States House of Representatives
| District | Representative | Party |
|---|---|---|
| 06 | Bill Johnson | Republican |
| 13 | Tim Ryan | Democratic |
United States Senate
| Senator | Party |
|---|---|
| Sherrod Brown | Democratic |
| Rob Portman | Republican |
Education
Colleges and universities
- Avalon University School of Medicine
- Youngstown State University
Community, junior, and technical colleges
- Choffin Career and Technical Center
- Eastern Gateway Community College
- Mahoning County Career and Technical Center
Public school districts
School districts include:[26]
- Alliance City School District
- Austintown Local School District
- Boardman Local School District
- Campbell City School District
- Canfield Local School District
- Columbiana Exempted Village School District
- Girard City School District
- Hubbard Exempted Village School District
- Jackson-Milton Local School District
- Leetonia Exempted Village School District
- Lowellville Local School District
- Poland Local School District
- Sebring Local School District
- South Range Local School District
- Springfield Local School District
- Struthers City School District
- Weathersfield Local School District
- West Branch Local School District
- Western Reserve Local School District
- Youngstown City School District
High schools
- Austintown Fitch High School
- Boardman High School
- Campbell Memorial High School
- Canfield High School
- Cardinal Mooney High School
- Chaney High School
- East High School
- Jackson-Milton High School
- Lowellville High School
- Mahoning County High School
- McKinley High School
- Poland Seminary High School
- South Range High School
- Springfield High School
- Struthers High School
- Ursuline High School
- Valley Christian School
- Valley STEM + ME2 Academy
- West Branch High School
- Western Reserve High School
Communities

Cities
- Alliance (part)
- Campbell
- Canfield
- Columbiana (part)
- Salem (part)
- Struthers
- Youngstown (part) (county seat)
Villages
Townships
Census-designated places
Unincorporated communities
- Berlin Center
- Blanco
- Calla
- Coitsville Center
- East Lewistown
- Ellsworth
- Fredericksburg
- Garfield
- Greenford
- Hickory Corners
- Knaufville
- Locust Grove
- New Albany
- New Buffalo
- Newport Village Historic District
- North Benton
- North Jackson
- Ohltown
- Paradise
- Patmos
- Poland Center
- Rosemont
- Snodes
- West Austintown
Population ranking
The population ranking of the following table is based on the 2010 census of Mahoning County.[28]
* majority of municipality in Mahoning County
** minority of municipality in Mahoning County
† county seat
| Rank | City/Town/etc. | Population (2010 Census) | Municipal type |
|---|---|---|---|
| 1 | † Youngstown* | 66,982 | City |
| 2 | Boardman | 35,376 | CDP |
| 3 | Austintown | 29,677 | CDP |
| 4 | Alliance** | 22,322 | City |
| 5 | Salem** | 12,303 | City |
| 6 | Struthers | 10,713 | City |
| 7 | Campbell | 8,235 | City |
| 8 | Canfield | 7,515 | City |
| 9 | Columbiana** | 6,384 | City |
| 10 | Sebring | 4,420 | Village |
| 11 | Mineral Ridge** | 3,892 | CDP |
| 12 | Poland | 2,555 | Village |
| 13 | Lake Milton | 2,493 | CDP |
| 14 | New Middletown | 1,621 | Village |
| 15 | Craig Beach | 1,180 | Village |
| 16 | Lowellville | 1,155 | Village |
| 17 | Beloit | 978 | Village |
| 18 | Washingtonville** | 801 | Village |
| 19 | Maple Ridge | 761 | CDP |
| 20 | Damascus* | 443 | CDP |
See also
- National Register of Historic Places listings in Mahoning County, Ohio
References
- "State & County QuickFacts". United States Census Bureau. Retrieved June 29, 2022.
- "Find a County". National Association of Counties. Retrieved June 7, 2011.
- Gannett, Henry (1905). The Origin of Certain Place Names in the United States. U.S. Government Printing Office. p. 196.
- "Ohio County Profiles: Mahoning County" (PDF). Ohio Department of Development. Archived from the original (PDF) on June 21, 2007. Retrieved April 28, 2007.
- History of Mahoning County Archived February 22, 2015, at the Wayback Machine, Official county website.
- Alvin M. Josephy, Jr., ed. (1961). The American Heritage Book of Indians. American Heritage Publishing Co., Inc. p. 197. LCCN 61-14871. [while the Iroquois were mopping up the Huron] ...the Erie... struck first in 1653. The next year [a counter-offensive] ...a victory which should have won the war on the spot, but ...two more years of fighting were required before the Erie, too, had been vanquished.
- "Whittlesey Culture - Ohio History Central". ohiohistorycentral.org. Retrieved January 29, 2020.
- Iroquois Book of Rites; Hale, Horatio; 1883
- http://riversidecemeteryjournal.com/Places/Places/page9.html
- The North Benton Mound: A Hopewell Site in Ohio; Magrath, Willis H.; American Antiquity, Vol. 1 pgs 40-46; 1945
- Calvin, Claude (1945). The Calvin Families. University of Wisconsin. pp. 69–71.
- "2010 Census Gazetteer Files". United States Census Bureau. August 22, 2012. Archived from the original on May 4, 2014. Retrieved February 9, 2015.
- "Annual Estimates of the Resident Population for Counties: April 1, 2020 to July 1, 2021". Retrieved June 29, 2022.
- "U.S. Decennial Census". United States Census Bureau. Retrieved February 9, 2015.
- "Historical Census Browser". University of Virginia Library. Retrieved February 9, 2015.
- Forstall, Richard L., ed. (March 27, 1995). "Population of Counties by Decennial Census: 1900 to 1990". United States Census Bureau. Retrieved February 9, 2015.
- "Census 2000 PHC-T-4. Ranking Tables for Counties: 1990 and 2000" (PDF). United States Census Bureau. April 2, 2001. Retrieved February 9, 2015.
- "U.S. Census website". United States Census Bureau. Retrieved January 31, 2008.
- "Data Center Results". Archived from the original on June 19, 2006. Retrieved August 10, 2013.
- "DP-1 Profile of General Population and Housing Characteristics: 2010 Demographic Profile Data". United States Census Bureau. Archived from the original on February 13, 2020. Retrieved December 27, 2015.
- "Population, Housing Units, Area, and Density: 2010 - County". United States Census Bureau. Archived from the original on February 13, 2020. Retrieved December 27, 2015.
- "DP02 SELECTED SOCIAL CHARACTERISTICS IN THE UNITED STATES – 2006-2010 American Community Survey 5-Year Estimates". United States Census Bureau. Archived from the original on February 13, 2020. Retrieved December 27, 2015.
- "DP03 SELECTED ECONOMIC CHARACTERISTICS – 2006-2010 American Community Survey 5-Year Estimates". United States Census Bureau. Archived from the original on February 13, 2020. Retrieved December 27, 2015.
- "Mahoning County, Ohio Comprehensive Annual Financial Report For Fiscal Year Ended December 31, 2019". Retrieved June 27, 2021.
- Leip, David. "Dave Leip's Atlas of U.S. Presidential Elections". uselectionatlas.org. Retrieved May 2, 2018.
- "2020 CENSUS - SCHOOL DISTRICT REFERENCE MAP: Mahoning County, OH" (PDF). U.S. Census Bureau. Retrieved July 23, 2022. - Text list
- "TOWNSHIP WEBSITES | Ohio Township Association". Archived from the original on July 15, 2016.
- "2010 U.S. Census website". United States Census Bureau. Retrieved February 13, 2016.
External links
Places adjacent to Mahoning County, Ohio | |
|---|---|
Municipalities and communities of Mahoning County, Ohio, United States | ||
|---|---|---|
County seat: Youngstown | ||
| Cities |  | |
| Villages | ||
| Townships |
| |
| CDPs | ||
| Other communities |
| |
| Footnotes | ‡This populated place also has portions in an adjacent county or counties | |
| ||
Authority control | |
|---|---|
| General | |
| National libraries | |
| Other | |
На других языках
[de] Mahoning County
Mahoning County[1] ist ein County im Bundesstaat Ohio der Vereinigten Staaten. Der Sitz der County Seat ist in Youngstown.- [en] Mahoning County, Ohio
[ru] Махонинг (округ)
Округ Махонинг (англ. Mahoning County) располагается в штате Огайо, США. Официально образован 1-го марта 1846 года. По состоянию на 2010 год, численность населения составляла 238 823 человека.Другой контент может иметь иную лицензию. Перед использованием материалов сайта WikiSort.org внимательно изучите правила лицензирования конкретных элементов наполнения сайта.
WikiSort.org - проект по пересортировке и дополнению контента Википедии