world.wikisort.org - USA
Ashtabula County (/ˌæʃtəˈbjuːlə/ ASH-tə-BYU-lə) is the northeasternmost county in the U.S. state of Ohio. As of the 2020 census, the population was 97,574.[1] The county seat is Jefferson.[2] The county was created in 1808 and later organized in 1811.[3] The name[4] Ashtabula derives from the Lenape language phrase ashte-pihële, which translates to 'always enough (fish) to go around, to be given away'[5] and is a contraction of apchi ('always')[6] + tepi ('enough') + hële (verb of motion).[7] Ashtabula County comprises the Ashtabula, OH Micropolitan Statistical Area, which is also included in the Cleveland–Akron–Canton, OH Combined Statistical Area.
Ashtabula County | |
|---|---|
U.S. county | |
 Ashtabula County Courthouse | |
 Seal | |
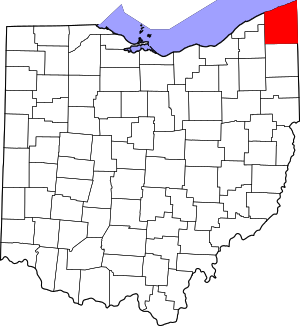 Location within the U.S. state of Ohio | |
 Ohio's location within the U.S. | |
| Coordinates: 41°53′N 80°46′W | |
| Country | |
| State | |
| Founded | May 1, 1811 |
| Named for | Lenape ashtepihële 'always enough fish to go around' |
| Seat | Jefferson |
| Largest city | Ashtabula |
| Area | |
| • Total | 1,368 sq mi (3,540 km2) |
| • Land | 702 sq mi (1,820 km2) |
| • Water | 666 sq mi (1,720 km2) 49%% |
| Population (2020) | |
| • Total | 97,574 |
| • Density | 71/sq mi (27/km2) |
| Time zone | UTC−5 (Eastern) |
| • Summer (DST) | UTC−4 (EDT) |
| Congressional district | 14th |
| Website | www |
The county is best known for having nineteen covered bridges within the county limits, including both the longest and the shortest covered bridges in the United States. Grapes are a popular crop and there are several award-winning wineries in the region due to the favorable microclimate from the nearby lake.[8] During the winter, Ashtabula County (along with neighboring Geauga and Lake Counties, as well as Crawford and Erie Counties in neighboring Pennsylvania) receives frequent lake-effect snow and is part of the Southeastern Lake Erie Snowbelt.
History
After Europeans arrived in the Americas, the land that became Ashtabula County was originally part of the French colony of Canada (New France), which was ceded in 1763 to Great Britain and renamed Province of Quebec. In the late 18th century, the land became part of the Connecticut Western Reserve in the Northwest Territory, then was purchased by the Connecticut Land Company in 1795. It was created from Geauga County and a small portion of northern Trumbull County.
During the pre-Civil War period, the entire Western Reserve area of Ohio was anti-slavery, but Ashtabula County was at the center of the resistance. John Brown's eldest son, John Jr., lived in the county for years, and his brother Owen took refuge with him when Virginia was seeking to extradite him for his role in the raid on Harpers Ferry. An armed group of 200 made them safer than anywhere in the U.S., they said, or even Canada.[9] Dangerfield Newby met John Brown in Ashtabula County.[10]
Geography

According to the U.S. Census Bureau, the county has a total area of 1,368 square miles (3,540 km2), of which 702 square miles (1,820 km2) is land and 666 square miles (1,720 km2) (49%) is water.[11] It is the largest county in Ohio by area.[12]
Adjacent counties
Across Lake Erie lie Elgin and Norfolk Counties, Ontario, Canada (north).
- Erie County, Pennsylvania (northeast)
- Crawford County, Pennsylvania (east)
- Trumbull County (south)
- Geauga County (southwest)
- Lake County (west)
Major highways
 I-90
I-90 US 6
US 6 US 20
US 20 US 322
 SR 7
SR 7 SR 11
SR 11 SR 45
SR 45 SR 46
SR 46 SR 84
SR 84 SR 85
SR 85 SR 86
SR 86 SR 167
 SR 193
 SR 307
 SR 531
 SR 534
Demographics
| Historical population | |||
|---|---|---|---|
| Census | Pop. | %± | |
| 1820 | 7,382 | — | |
| 1830 | 14,584 | 97.6% | |
| 1840 | 23,724 | 62.7% | |
| 1850 | 28,767 | 21.3% | |
| 1860 | 31,814 | 10.6% | |
| 1870 | 32,517 | 2.2% | |
| 1880 | 37,139 | 14.2% | |
| 1890 | 43,655 | 17.5% | |
| 1900 | 51,448 | 17.9% | |
| 1910 | 59,547 | 15.7% | |
| 1920 | 65,545 | 10.1% | |
| 1930 | 68,631 | 4.7% | |
| 1940 | 68,674 | 0.1% | |
| 1950 | 78,695 | 14.6% | |
| 1960 | 93,067 | 18.3% | |
| 1970 | 98,237 | 5.6% | |
| 1980 | 104,215 | 6.1% | |
| 1990 | 99,821 | −4.2% | |
| 2000 | 102,728 | 2.9% | |
| 2010 | 101,497 | −1.2% | |
| 2020 | 97,574 | −3.9% | |
| U.S. Decennial Census[13] 1790–1960[14] 1900–1990[15] 1990–2000[16] 2020 [17] | |||
2000 census
As of the census[18] of 2000, there were 102,728 people, 39,397 households, and 27,774 families residing in the county. The population density was 146 people per square mile (56/km2). There were 43,792 housing units at an average density of 62 per square mile (24/km2). The racial makeup of the county was 94.07% White, 3.16% Black or African American, 0.19% Native American, 0.34% Asian, 0.02% Pacific Islander, 0.85% from other races, and 1.36% from two or more races. 2.23% of the population were Hispanic or Latino of any race. 19.3% were of German, 11.6% Italian, 10.6% English, 10.5% Irish, and 10.3% American ancestry according to Census 2000. 95.2% spoke English, 2.4% Spanish, and 0.8% German as their first language.[19]
There were 39,397 households, out of which 32.40% had children under the age of 18 living with them, 54.80% were married couples living together, 11.40% had a female householder with no husband present, and 29.50% were non-families. 24.80% of all households were made up of individuals, and 10.70% had someone living alone who was 65 years of age or older. The average household size was 2.56 and the average family size was 3.05.
In the county, the population was spread out, with 26.20% under the age of 18, 7.60% from 18 to 24, 28.00% from 25 to 44, 23.60% from 45 to 64, and 14.70% who were 65 years of age or older. The median age was 38 years. For every 100 females there were 95.10 males. For every 100 females age 18 and over, there were 92.10 males.
The median income for a household in the county was $35,607, and the median income for a family was $42,449. Males had a median income of $33,105 versus $22,624 for females. The per capita income for the county was $16,814. About 9.20% of families and 12.10% of the population were below the poverty line, including 17.10% of those under age 18 and 8.60% of those age 65 or over.
2010 census
As of the 2010 United States Census, there were 101,497 people, 39,363 households, and 26,495 families residing in the county.[20] The population density was 144.6 inhabitants per square mile (55.8/km2). There were 46,099 housing units at an average density of 65.7 per square mile (25.4/km2).[21] The racial makeup of the county was 92.7% white, 3.5% black or African American, 0.4% Asian, 0.2% American Indian, 1.1% from other races, and 2.1% from two or more races. Those of Hispanic or Latino origin made up 3.4% of the population.[20] In terms of ancestry, 24.9% were German, 15.8% were Irish, 12.6% were English, 11.1% were Italian, 10.0% were American, and 5.8% were Polish.[22]
Of the 39,363 households, 31.3% had children under the age of 18 living with them, 49.2% were married couples living together, 12.4% had a female householder with no husband present, 32.7% were non-families, and 26.9% of all households were made up of individuals. The average household size was 2.50 and the average family size was 3.01. The median age was 41.0 years.[20]
The median income for a household in the county was $42,139 and the median income for a family was $50,227. Males had a median income of $40,879 versus $30,156 for females. The per capita income for the county was $19,898. About 11.8% of families and 15.7% of the population were below the poverty line, including 21.7% of those under age 18 and 9.2% of those age 65 or over.[23]
Politics
According to the accompanying table, Ashtabula County voted for the Democratic candidate for president in every election between 1988 and 2012. Prior to that, however, no fewer than 19 Republican candidates won the county with greater than 61% of the vote. In 2020, incumbent Donald Trump carried the county with 60.8%.
| Year | Republican | Democratic | Third party | |||
|---|---|---|---|---|---|---|
| No. | % | No. | % | No. | % | |
| 2020 | 26,890 | 60.79% | 16,497 | 37.29% | 850 | 1.92% |
| 2016 | 23,318 | 56.62% | 15,577 | 37.83% | 2,285 | 5.55% |
| 2012 | 18,298 | 42.36% | 23,803 | 55.10% | 1,099 | 2.54% |
| 2008 | 18,949 | 42.04% | 25,027 | 55.52% | 1,100 | 2.44% |
| 2004 | 21,038 | 46.33% | 24,060 | 52.99% | 309 | 0.68% |
| 2000 | 17,940 | 45.45% | 19,831 | 50.24% | 1,701 | 4.31% |
| 1996 | 13,287 | 34.31% | 19,341 | 49.95% | 6,094 | 15.74% |
| 1992 | 13,254 | 30.80% | 18,843 | 43.79% | 10,931 | 25.40% |
| 1988 | 17,654 | 45.79% | 20,536 | 53.26% | 366 | 0.95% |
| 1984 | 21,669 | 52.34% | 19,344 | 46.73% | 384 | 0.93% |
| 1980 | 19,847 | 49.04% | 17,363 | 42.91% | 3,257 | 8.05% |
| 1976 | 16,885 | 43.72% | 20,883 | 54.07% | 857 | 2.22% |
| 1972 | 22,762 | 58.96% | 15,052 | 38.99% | 794 | 2.06% |
| 1968 | 17,058 | 46.66% | 16,738 | 45.79% | 2,759 | 7.55% |
| 1964 | 13,183 | 35.36% | 24,104 | 64.64% | 0 | 0.00% |
| 1960 | 22,406 | 53.91% | 19,155 | 46.09% | 0 | 0.00% |
| 1956 | 24,165 | 64.68% | 13,195 | 35.32% | 0 | 0.00% |
| 1952 | 23,185 | 61.24% | 14,676 | 38.76% | 0 | 0.00% |
| 1948 | 15,389 | 54.33% | 12,560 | 44.34% | 377 | 1.33% |
| 1944 | 17,181 | 56.33% | 13,319 | 43.67% | 0 | 0.00% |
| 1940 | 18,491 | 56.13% | 14,454 | 43.87% | 0 | 0.00% |
| 1936 | 14,025 | 46.73% | 14,468 | 48.21% | 1,517 | 5.05% |
| 1932 | 15,644 | 55.31% | 11,386 | 40.26% | 1,252 | 4.43% |
| 1928 | 18,870 | 75.13% | 5,951 | 23.69% | 297 | 1.18% |
| 1924 | 14,767 | 69.21% | 2,135 | 10.01% | 4,435 | 20.79% |
| 1920 | 14,099 | 69.70% | 5,413 | 26.76% | 717 | 3.54% |
| 1916 | 6,608 | 52.34% | 5,306 | 42.02% | 712 | 5.64% |
| 1912 | 2,214 | 17.99% | 3,181 | 25.84% | 6,913 | 56.17% |
| 1908 | 8,213 | 63.32% | 3,572 | 27.54% | 1,185 | 9.14% |
| 1904 | 8,906 | 75.89% | 1,647 | 14.03% | 1,182 | 10.07% |
| 1900 | 9,272 | 70.70% | 3,438 | 26.21% | 405 | 3.09% |
| 1896 | 8,557 | 67.70% | 3,840 | 30.38% | 242 | 1.91% |
| 1892 | 6,419 | 63.57% | 2,769 | 27.42% | 910 | 9.01% |
| 1888 | 7,164 | 67.39% | 2,675 | 25.16% | 792 | 7.45% |
| 1884 | 7,269 | 69.41% | 2,643 | 25.24% | 560 | 5.35% |
| 1880 | 6,926 | 72.88% | 2,286 | 24.06% | 291 | 3.06% |
| 1876 | 6,771 | 74.31% | 2,294 | 25.18% | 47 | 0.52% |
| 1872 | 5,764 | 76.96% | 1,678 | 22.40% | 48 | 0.64% |
| 1868 | 6,108 | 81.35% | 1,400 | 18.65% | 0 | 0.00% |
| 1864 | 6,045 | 85.30% | 1,042 | 14.70% | 0 | 0.00% |
| 1860 | 5,566 | 81.15% | 860 | 12.54% | 433 | 6.31% |
| 1856 | 5,108 | 80.63% | 975 | 15.39% | 252 | 3.98% |
Culture
Ashtabula County (along with neighboring Lake County) fostered a very large Finnish American community around the turn of the twentieth century, and as a result, the area is home to many Finnish Americans.
Ashtabula County has eighteen extant covered bridges. Of these, nine were constructed prior to 1900. See List of Ashtabula County covered bridges.
Communities

Cities
Villages
- Andover
- Geneva-on-the-Lake
- Jefferson (county seat)
- North Kingsville
- Orwell
- Roaming Shores
- Rock Creek
Townships
Census-designated places
- Austinburg
- Edgewood
- Kingsville
- Saybrook-on-the-Lake
Unincorporated communities
- Dorset
- Eagleville
- Footville
- Kelloggsville
- Pierpont
- Unionville
- Williamsfield
- Windsor
Notable people
- Chester H. Aldrich (1862–1924), governor of Nebraska 1911-1913
- Brian Anderson, Cleveland Indians pitcher, originally from Geneva
- John Brown Junior (1821–1895), son of the abolitionist John Brown, lived in Ashtabula County during the Civil War period, and his brother Owen (1824–1889) took refuge with him..
- Charles Case (1817–1883), born in Austinburg, United States congressman from Indiana[25]
- Tammy Cochran, country music singer from Austinburg; biggest hit was "Angels in Waiting"
- Edwin Cowles (1825–1890), born in Austinburg, publisher of The Cleveland Leader, vice-president of the 1884 Republican National Convention[25]
- Charles DeBarber, a cyber intelligence analyst on CBS's Hunted (2017 TV series)
- Joshua Reed Giddings (1795–1864), member of the U.S. House of Representatives and prominent opponent of slavery
- Rosetta Luce Gilchrist (1850-1921), physician, writer, president of the Ashtabula Equal Rights Club
- Francis Joseph Hall, was an American Protestant Episcopal theologian and author.
- Ken Meyer, head coach of the National Football League's San Francisco 49ers in 1977
- Urban Meyer, head football coach at the University of Florida (2005-2010), head football coach at The Ohio State University (2012-2018), head coach of the National Football League's Jacksonville Jaguars (2021–present)
- James Montgomery, (1814–1871), born in Ashtabula County, colonel in the American Civil War, raided several towns in Missouri and the American South[25]
- Dangerfield Newby (c. 1820–1859), a freed slave who was killed during John Brown's raid on Harpers Ferry.
- Danielle Nicolet, television, film, and voice actress born in Ashtabula
- Larry Obhof, attorney and former President of the Ohio Senate
- Ransom Eli Olds, pioneer of the American automobile industry, for whom both the Oldsmobile and Reo brands were named
- Glenn W. Salisbury, agricultural scientist
- Louis C. Shepard, American Civil War Medal of Honor recipient from Ashtabula County, buried in Lakeview Cemetery, Port Clinton, Ottawa County, Ohio
- Decius Wade, attorney, judge, writer, and politician who has been called the "Father of Montana Jurisprudence" for his role in establishing the common law and statutory law of the U.S. state of Montana
- Clarence Darrow, American lawyer who became famous in the early 20th century for his involvement in the Leopold and Loeb murder trial and the Scopes "Monkey" Trial.
- Connie Schultz, an American writer and journalist and wife of United States Senator Sherrod Brown.[26]
- Doug Tompkins, co-founder of North Face and Esprit
- Danielle Nicolet, Actress
See also
- National Register of Historic Places listings in Ashtabula County, Ohio
References
- 2020 census
- "Find a County". National Association of Counties. Archived from the original on May 31, 2011. Retrieved June 7, 2011.
- "Ohio: Individual County Chronologies". Ohio Atlas of Historical County Boundaries. The Newberry Library. 2007. Archived from the original on April 6, 2016. Retrieved February 12, 2015.
- Cross, Tom (2008). Fishing Ohio: An Angler's Guide to Over 200 Fishing Spots in the Buckeye State. Lyons Press. p. 112. ISBN 978-0-7627-4326-1.
- Mahr, August C. (November 1959). "Practical Reasons for Algonkian Indian Stream and Place Names". Ohio Journal of Science. 59 (6): 365–375. hdl:1811/4658. ISSN 0030-0950. Retrieved August 3, 2016.
- "apchi". Lenape Talking Dictionary. Archived from the original on March 4, 2016. Retrieved August 3, 2016.
- "tèpihële". Lenape Talking Dictionary. Archived from the original on March 4, 2016. Retrieved August 3, 2016.
- "Ferrante Winery brings home the gold". The Ashtabula Wave. Archived from the original on April 14, 2016. Retrieved April 1, 2016.
- "Armed Rebellion in Ohio". Shepherdstown Register. Shepherdstown, West Virginia. May 5, 1860. p. 1 – via VirginiaChronicle.
- Terry, Shelley (December 15, 2019). "Dangerfield Newby a blacksmith from Ashtabula County who participated in John Brown's raid on Harpers Ferry". Star Beacon. Ashtabula, Ohio.
- "2010 Census Gazetteer Files". United States Census Bureau. August 22, 2012. Archived from the original on May 4, 2014. Retrieved February 7, 2015.
- "Ashtabula, Lake are Ohio's largest and smallest counties by area". cleveland.com. January 18, 2011. Retrieved December 30, 2015.
- "U.S. Decennial Census". United States Census Bureau. Retrieved February 7, 2015.
- "Historical Census Browser". University of Virginia Library. Retrieved February 7, 2015.
- Forstall, Richard L., ed. (March 27, 1995). "Population of Counties by Decennial Census: 1900 to 1990". United States Census Bureau. Retrieved February 7, 2015.
- "Census 2000 PHC-T-4. Ranking Tables for Counties: 1990 and 2000" (PDF). United States Census Bureau. April 2, 2001. Retrieved February 7, 2015.
- 2020 census
- "U.S. Census website". United States Census Bureau. Retrieved January 31, 2008.
- "Data Center Results". Archived from the original on August 15, 2013. Retrieved August 23, 2013.
- "DP-1 Profile of General Population and Housing Characteristics: 2010 Demographic Profile Data". United States Census Bureau. Archived from the original on February 13, 2020. Retrieved December 27, 2015.
- "Population, Housing Units, Area, and Density: 2010 - County". United States Census Bureau. Archived from the original on February 13, 2020. Retrieved December 27, 2015.
- "DP02 SELECTED SOCIAL CHARACTERISTICS IN THE UNITED STATES – 2006-2010 American Community Survey 5-Year Estimates". United States Census Bureau. Archived from the original on February 13, 2020. Retrieved December 27, 2015.
- "DP03 SELECTED ECONOMIC CHARACTERISTICS – 2006-2010 American Community Survey 5-Year Estimates". United States Census Bureau. Archived from the original on February 13, 2020. Retrieved December 27, 2015.
- Leip, David. "Dave Leip's Atlas of U.S. Presidential Elections". uselectionatlas.org. Retrieved March 21, 2018.
- Who Was Who in America, Historical Volume, 1607–1896. Chicago: Marquis Who's Who. 1963.
- "Ashtabula native Connie Schultz honored with signs".
External links
Places adjacent to Ashtabula County, Ohio | ||||||||||||||||
|---|---|---|---|---|---|---|---|---|---|---|---|---|---|---|---|---|
| ||||||||||||||||
Municipalities and communities of Ashtabula County, Ohio, United States | ||
|---|---|---|
County seat: Jefferson | ||
| Cities |  | |
| Villages | ||
| Townships | ||
| CDPs |
| |
| Unincorporated communities |
| |
| Footnotes | ‡This populated place also has portions in an adjacent county or counties | |
| ||
Authority control | |
|---|---|
| General | |
| National libraries | |
| Other | |
На других языках
[de] Ashtabula County
Ashtabula County[3][.mw-parser-output .IPA a{text-decoration:none}æʃtəˈbjuːlə] ist ein County im Bundesstaat Ohio der Vereinigten Staaten. Der Verwaltungssitz (County Seat) ist Jefferson.- [en] Ashtabula County, Ohio
[ru] Аштабьюла (округ)
Округ Аштабьюла (англ. Ashtabula County) располагается в штате Огайо, США. Официально образован 7-го июня 1807 года. По состоянию на 2010 год, численность населения составляла 101 497 человек.Другой контент может иметь иную лицензию. Перед использованием материалов сайта WikiSort.org внимательно изучите правила лицензирования конкретных элементов наполнения сайта.
WikiSort.org - проект по пересортировке и дополнению контента Википедии