world.wikisort.org - USA
Dauphin County (/ˈdɔːfɪn/; Pennsylvania Dutch: Daffin Kaundi) is a county in the Commonwealth of Pennsylvania. As of the 2020 census, the population was 286,401.[2] The county seat and the largest city is Harrisburg,[3] Pennsylvania's state capital and ninth largest city. The county was created ("erected") on March 4, 1785, from part of Lancaster County and was named after Louis Joseph, Dauphin of France,[4] the first son of King Louis XVI.
Dauphin County | |
|---|---|
U.S. county | |
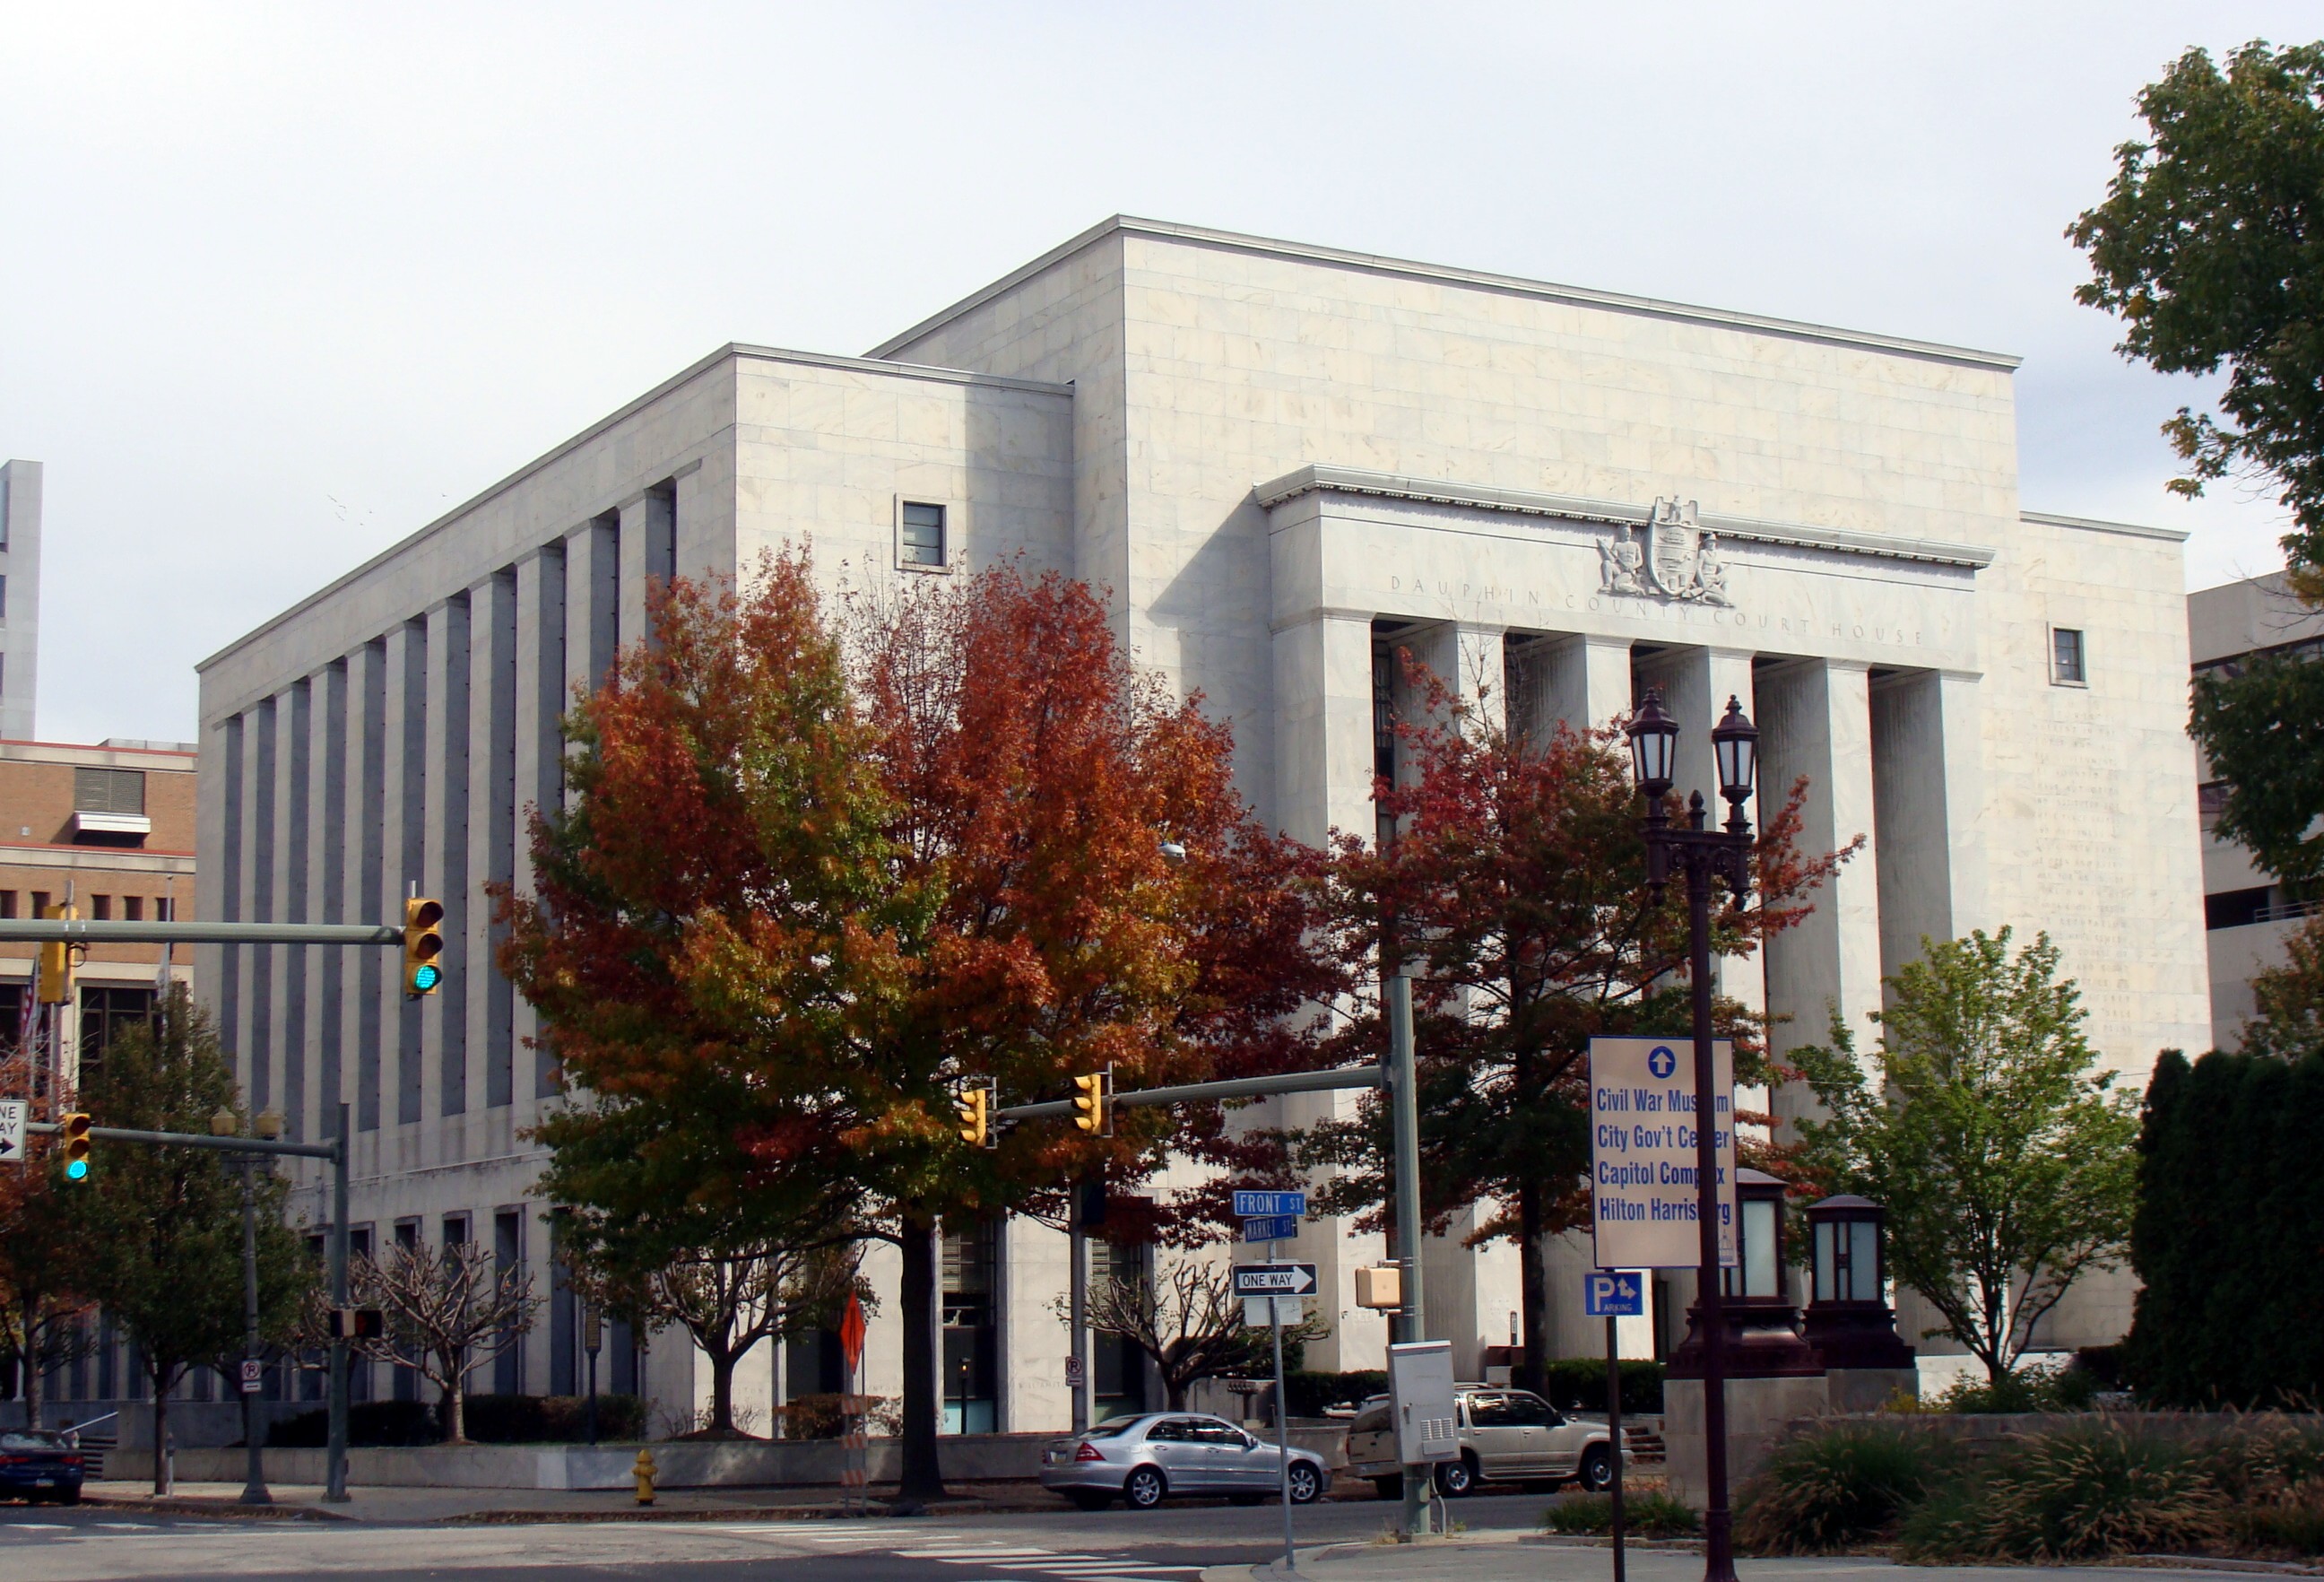 Dauphin County Courthouse | |
 Flag | |
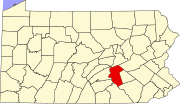
 Location within the U.S. state of Pennsylvania | |
 Pennsylvania's location within the U.S. | |
| Coordinates: 40°25′N 76°47′W | |
| Country | |
| State | |
| Founded | March 4, 1785 |
| Named for | Louis Joseph, Dauphin of France |
| Seat | Harrisburg |
| Largest city | Harrisburg |
| Area | |
| • Total | 558 sq mi (1,450 km2) |
| • Land | 525 sq mi (1,360 km2) |
| • Water | 33 sq mi (90 km2) 5.9%% |
| Population | |
| • Estimate (2021) | 287,400 |
| Time zone | UTC−5 (Eastern) |
| • Summer (DST) | UTC−4 (EDT) |
| Congressional district | 10th |
| Website | www |
Pennsylvania Historical Marker | |
| Designated | December 9, 1982[1] |
Dauphin County is included in the Harrisburg–Carlisle Metropolitan Statistical Area.
Located within the county is Three Mile Island Nuclear Generating Station, site of the 1979 nuclear core meltdown. The nuclear power plant closed in 2019.
Geography
According to the U.S. Census Bureau, the county has a total area of 558 square miles (1,450 km2), of which 525 square miles (1,360 km2) is land and 33 square miles (85 km2) (5.9%) is water.[5] The county is bound to its western border by the Susquehanna River (with the exception of a small peninsula next to Duncannon). The area code is 717 with an overlay of 223.
Adjacent counties
- Northumberland County (north)
- Schuylkill County (northeast)
- Lebanon County (east)
- Lancaster County (south)
- York County (southwest)
- Cumberland County (west)
- Perry County (west)
- Juniata County (northwest)
Major roads and highways

 I-76 / Penna Turnpike
 I-81
I-81 I-83
I-83 I-283
I-283
 US 11 / US 15
 US 22
US 22 US 209
 US 322
 US 422
 PA 25
PA 25 PA 39
PA 39 PA 147
 PA 225
 PA 230
 PA 283
 PA 325
 PA 341
 PA 441
 PA 443
 PA 743
 PA 849
 SR 3032
Climate
Most of the county by area has a humid continental climate (Dfa except for some Dfb in highlands.) The inclusion of temperature numbers for the past decade shows some lower areas including Harrisburg to have a humid subtropical climate (Cfa.) The hardiness zone ranges from 6a to 7a.
| Climate data for Harrisburg, Pennsylvania (Harrisburg Int'l), 1991–2020 normals,[lower-alpha 1] extremes 1888–present[lower-alpha 2] | |||||||||||||
|---|---|---|---|---|---|---|---|---|---|---|---|---|---|
| Month | Jan | Feb | Mar | Apr | May | Jun | Jul | Aug | Sep | Oct | Nov | Dec | Year |
| Record high °F (°C) | 73 (23) |
79 (26) |
87 (31) |
93 (34) |
97 (36) |
100 (38) |
107 (42) |
104 (40) |
102 (39) |
97 (36) |
84 (29) |
75 (24) |
107 (42) |
| Mean maximum °F (°C) | 60 (16) |
61 (16) |
73 (23) |
83 (28) |
89 (32) |
93 (34) |
96 (36) |
94 (34) |
90 (32) |
81 (27) |
71 (22) |
62 (17) |
96 (36) |
| Average high °F (°C) | 38.6 (3.7) |
42.0 (5.6) |
51.3 (10.7) |
63.8 (17.7) |
73.7 (23.2) |
82.4 (28.0) |
86.8 (30.4) |
84.7 (29.3) |
77.6 (25.3) |
65.7 (18.7) |
53.9 (12.2) |
43.3 (6.3) |
63.6 (17.6) |
| Daily mean °F (°C) | 30.8 (−0.7) |
33.4 (0.8) |
41.8 (5.4) |
53.2 (11.8) |
63.4 (17.4) |
72.5 (22.5) |
77.3 (25.2) |
75.2 (24.0) |
67.9 (19.9) |
55.8 (13.2) |
44.8 (7.1) |
35.8 (2.1) |
54.3 (12.4) |
| Average low °F (°C) | 23.0 (−5.0) |
24.7 (−4.1) |
32.3 (0.2) |
42.5 (5.8) |
53.1 (11.7) |
62.7 (17.1) |
67.8 (19.9) |
65.8 (18.8) |
58.2 (14.6) |
46.0 (7.8) |
35.8 (2.1) |
28.2 (−2.1) |
45.0 (7.2) |
| Mean minimum °F (°C) | 7 (−14) |
10 (−12) |
18 (−8) |
29 (−2) |
40 (4) |
51 (11) |
58 (14) |
56 (13) |
45 (7) |
33 (1) |
23 (−5) |
15 (−9) |
5 (−15) |
| Record low °F (°C) | −22 (−30) |
−13 (−25) |
−1 (−18) |
11 (−12) |
30 (−1) |
40 (4) |
49 (9) |
45 (7) |
30 (−1) |
23 (−5) |
10 (−12) |
−8 (−22) |
−22 (−30) |
| Average precipitation inches (mm) | 3.03 (77) |
2.59 (66) |
3.70 (94) |
3.55 (90) |
3.83 (97) |
3.98 (101) |
4.74 (120) |
3.77 (96) |
4.83 (123) |
3.81 (97) |
2.97 (75) |
3.43 (87) |
44.23 (1,123) |
| Average snowfall inches (cm) | 9.1 (23) |
9.4 (24) |
5.6 (14) |
0.4 (1.0) |
0.0 (0.0) |
0.0 (0.0) |
0.0 (0.0) |
0.0 (0.0) |
0.0 (0.0) |
0.2 (0.51) |
0.8 (2.0) |
4.4 (11) |
29.9 (76) |
| Average precipitation days (≥ 0.01 in) | 10.9 | 10.4 | 11.0 | 11.4 | 13.0 | 11.5 | 10.9 | 10.0 | 9.2 | 9.2 | 8.5 | 10.3 | 126.3 |
| Average snowy days (≥ 0.1 in) | 5.1 | 4.8 | 2.7 | 0.3 | 0.0 | 0.0 | 0.0 | 0.0 | 0.0 | 0.0 | 0.7 | 2.7 | 16.3 |
| Average ultraviolet index | 2 | 3 | 4 | 6 | 8 | 9 | 9 | 8 | 6 | 4 | 2 | 2 | 5 |
| Source 1: NOAA[7][8] | |||||||||||||
| Source 2: Weather Atlas (UV data)[9] | |||||||||||||
| Climate data for Harrisburg, Pennsylvania (Harrisburg Capital City Airport) 1991-2020 normals (Records 1939-2021) | |||||||||||||
|---|---|---|---|---|---|---|---|---|---|---|---|---|---|
| Month | Jan | Feb | Mar | Apr | May | Jun | Jul | Aug | Sep | Oct | Nov | Dec | Year |
| Record high °F (°C) | 73 (23) |
83 (28) |
86 (30) |
93 (34) |
97 (36) |
100 (38) |
107 (42) |
101 (38) |
102 (39) |
97 (36) |
84 (29) |
75 (24) |
107 (42) |
| Average high °F (°C) | 40.3 (4.6) |
43.2 (6.2) |
52.6 (11.4) |
64.9 (18.3) |
74.7 (23.7) |
83.2 (28.4) |
87.6 (30.9) |
85.4 (29.7) |
78.6 (25.9) |
66.7 (19.3) |
55.1 (12.8) |
44.4 (6.9) |
64.7 (18.2) |
| Daily mean °F (°C) | 32.6 (0.3) |
34.7 (1.5) |
43.2 (6.2) |
54.1 (12.3) |
64.0 (17.8) |
73.0 (22.8) |
77.5 (25.3) |
75.4 (24.1) |
68.5 (20.3) |
56.7 (13.7) |
46.0 (7.8) |
37.0 (2.8) |
55.2 (12.9) |
| Average low °F (°C) | 24.9 (−3.9) |
26.2 (−3.2) |
33.9 (1.1) |
43.3 (6.3) |
53.2 (11.8) |
62.8 (17.1) |
67.4 (19.7) |
65.5 (18.6) |
58.4 (14.7) |
46.7 (8.2) |
37.0 (2.8) |
29.5 (−1.4) |
45.7 (7.6) |
| Record low °F (°C) | −9 (−23) |
−5 (−21) |
2 (−17) |
19 (−7) |
31 (−1) |
40 (4) |
49 (9) |
45 (7) |
30 (−1) |
23 (−5) |
13 (−11) |
−8 (−22) |
−9 (−23) |
| Average precipitation inches (mm) | 2.64 (67) |
2.36 (60) |
3.35 (85) |
3.70 (94) |
3.48 (88) |
3.72 (94) |
4.30 (109) |
3.68 (93) |
4.12 (105) |
3.68 (93) |
2.80 (71) |
3.15 (80) |
40.98 (1,041) |
| Average precipitation days (≥ 0.01 in) | 9 | 9 | 10 | 12 | 14 | 12 | 12 | 11 | 10 | 11 | 9 | 10 | 127 |
| Source: NOAA[10] | |||||||||||||
Demographics
| Historical population | |||
|---|---|---|---|
| Census | Pop. | %± | |
| 1790 | 18,155 | — | |
| 1800 | 22,270 | 22.7% | |
| 1810 | 31,883 | 43.2% | |
| 1820 | 21,653 | −32.1% | |
| 1830 | 25,243 | 16.6% | |
| 1840 | 30,118 | 19.3% | |
| 1850 | 35,754 | 18.7% | |
| 1860 | 46,756 | 30.8% | |
| 1870 | 60,740 | 29.9% | |
| 1880 | 76,148 | 25.4% | |
| 1890 | 96,977 | 27.4% | |
| 1900 | 114,443 | 18.0% | |
| 1910 | 136,152 | 19.0% | |
| 1920 | 153,116 | 12.5% | |
| 1930 | 165,231 | 7.9% | |
| 1940 | 177,410 | 7.4% | |
| 1950 | 197,784 | 11.5% | |
| 1960 | 220,255 | 11.4% | |
| 1970 | 223,834 | 1.6% | |
| 1980 | 232,317 | 3.8% | |
| 1990 | 237,813 | 2.4% | |
| 2000 | 251,805 | 5.9% | |
| 2010 | 268,100 | 6.5% | |
| 2020 | 286,401 | 6.8% | |
| U.S. Decennial Census[11] 1790-1960[12] 1900-1990[13] 1990-2000[14]2010,<[15] 2020[2] | |||
This section needs to be updated. The reason given is: Newer information is available from the 2020 Census report. (September 2021) |
As of the 2010 census, the county was 72.7% White, 18.0% Black or African American, 0.2% Native American, 3.2% Asian, and 3.1% were two or more races. 7.0% of the population were of Hispanic or Latino ancestry.
As of the census[16] of 2000, there were 251,798 people, 102,670 households, and 66,119 families residing in the county. The population density was 479 people per square mile (185/km2). There were 111,133 housing units at an average density of 212 per square mile (82/km2). The racial makeup of the county was 77.11% White, 16.91% Black or African American, 0.16% Native American, 1.96% Asian, 0.03% Pacific Islander, 1.97% from other races, and 1.85% from two or more races. 4.13% of the population were Hispanic or Latino of any race. 29.2% were of German, 7.5% Irish, 7.3% American and 7.2% Italian ancestry. 91.8% spoke English and 3.9% Spanish as their first language.
According to 2005 estimates, 73.9% of the county's population was non-Hispanic whites. 17.8% of the population was African-Americans. 2.5% were Asians. Latinos now were 5.0% of the population.[17]
In 2000 there were 102,670 households, out of which 29.70% had children under the age of 18 living with them, 47.60% were married couples living together, 12.90% had a female householder with no husband present, and 35.60% were non-families. 30.00% of all households were made up of individuals, and 10.30% had someone living alone who was 65 years of age or older. The average household size was 2.39 and the average family size was 2.98.
In the county, the population was spread out, with 24.30% under the age of 18, 7.60% from 18 to 24, 30.10% from 25 to 44, 23.80% from 45 to 64, and 14.20% who were 65 years of age or older. The median age was 38 years. For every 100 females, there were 92.30 males. For every 100 females age 18 and over, there were 88.80 males.
A study by Echelon Insights found Dauphin County to be the most typical county in America, with its 2016 presidential vote, median income, higher education rate, and religiosity all very close to the national averages.[18]
2020 Census
| Race | Num. | Perc. |
|---|---|---|
| White (NH) | 175,175 | 61.16% |
| Black or African American (NH) | 48,404 | 17% |
| Native American (NH) | 396 | 0.14% |
| Asian (NH) | 17,183 | 6% |
| Pacific Islander (NH) | 88 | 0.03% |
| Other/Mixed (NH) | 13,904 | 4.85% |
| Hispanic or Latino | 31,251 | 11% |
Amish community
Dauphin County is home to an Amish community that resides in the Lykens Valley in the northern part of the county, consisting of eight church districts. The community was settled by Amish from Lancaster County seeking cheaper land.[20]
Metropolitan Statistical Area
The United States Office of Management and Budget[21] has designated Dauphin County as the Harrisburg-Carlisle, PA Metropolitan Statistical Area (MSA). As of the 2010 U.S. Census[22] the metropolitan area ranked 5th most populous in the State of Pennsylvania and the 96th most populous in the United States with a population of 549,475. Dauphin County is also a part of the larger Harrisburg-York-Lebanon, PA Combined Statistical Area (CSA), which combines the populations of Dauphin County as well as Adams, Cumberland, Lebanon, Perry and York Counties in Pennsylvania. The Combined Statistical Area ranked 5th in the State of Pennsylvania and 43rd most populous in the United States with a population of 1,219,422.
Politics and government
| Year | Republican | Democratic | Third party | |||
|---|---|---|---|---|---|---|
| No. | % | No. | % | No. | % | |
| 2020 | 66,408 | 44.90% | 78,983 | 53.40% | 2,510 | 1.70% |
| 2016 | 60,863 | 46.18% | 64,706 | 49.10% | 6,214 | 4.72% |
| 2012 | 57,450 | 46.22% | 64,965 | 52.26% | 1,886 | 1.52% |
| 2008 | 58,238 | 44.85% | 69,975 | 53.89% | 1,632 | 1.26% |
| 2004 | 65,296 | 53.87% | 55,299 | 45.62% | 613 | 0.51% |
| 2000 | 53,631 | 53.28% | 44,390 | 44.10% | 2,637 | 2.62% |
| 1996 | 44,417 | 47.78% | 40,936 | 44.03% | 7,618 | 8.19% |
| 1992 | 45,479 | 45.98% | 36,990 | 37.40% | 16,441 | 16.62% |
| 1988 | 48,917 | 57.77% | 35,079 | 41.43% | 681 | 0.80% |
| 1984 | 54,330 | 61.28% | 33,576 | 37.87% | 752 | 0.85% |
| 1980 | 44,039 | 56.18% | 27,252 | 34.77% | 7,096 | 9.05% |
| 1976 | 46,819 | 56.33% | 34,342 | 41.32% | 1,961 | 2.36% |
| 1972 | 54,307 | 69.38% | 22,587 | 28.86% | 1,376 | 1.76% |
| 1968 | 48,394 | 59.17% | 25,480 | 31.15% | 7,914 | 9.68% |
| 1964 | 42,718 | 47.77% | 46,119 | 51.57% | 594 | 0.66% |
| 1960 | 61,726 | 64.22% | 33,962 | 35.33% | 427 | 0.44% |
| 1956 | 61,342 | 67.45% | 29,226 | 32.14% | 375 | 0.41% |
| 1952 | 58,385 | 65.12% | 30,985 | 34.56% | 286 | 0.32% |
| 1948 | 46,861 | 62.16% | 27,729 | 36.78% | 796 | 1.06% |
| 1944 | 44,725 | 59.05% | 30,684 | 40.51% | 333 | 0.44% |
| 1940 | 42,394 | 52.35% | 38,305 | 47.30% | 282 | 0.35% |
| 1936 | 39,598 | 47.42% | 43,256 | 51.80% | 644 | 0.77% |
| 1932 | 36,278 | 60.31% | 22,412 | 37.26% | 1,462 | 2.43% |
| 1928 | 49,108 | 83.78% | 9,115 | 15.55% | 394 | 0.67% |
| 1924 | 27,838 | 68.04% | 9,004 | 22.01% | 4,074 | 9.96% |
| 1920 | 26,094 | 65.36% | 11,990 | 30.03% | 1,839 | 4.61% |
| 1916 | 13,954 | 52.16% | 11,483 | 42.92% | 1,315 | 4.92% |
| 1912 | 6,012 | 23.29% | 7,470 | 28.93% | 12,337 | 47.78% |
| 1908 | 15,637 | 63.38% | 7,546 | 30.59% | 1,488 | 6.03% |
| 1904 | 16,508 | 72.61% | 5,040 | 22.17% | 1,186 | 5.22% |
| 1900 | 14,673 | 64.23% | 7,390 | 32.35% | 783 | 3.43% |
| 1896 | 14,752 | 66.84% | 6,584 | 29.83% | 733 | 3.32% |
| 1892 | 11,010 | 57.47% | 7,520 | 39.25% | 627 | 3.27% |
| 1888 | 10,852 | 57.66% | 7,684 | 40.82% | 286 | 1.52% |
| 1884 | 9,394 | 58.46% | 6,378 | 39.69% | 298 | 1.85% |
| 1880 | 8,573 | 55.21% | 6,619 | 42.62% | 337 | 2.17% |
Dauphin County was historically a Republican stronghold, like most of south-central Pennsylvania. It was long one of the more conservative urban counties in the nation, having only supported a Democrat for president twice from 1880 to 2004. However, there has been a decided shift toward the Democrats in national and statewide elections in recent years. This culminated when the Democrats overtook the Republicans in countywide registration during the summer of 2008. As of November 1, 2021, 45.5% of registered voters in the county were Democrats, 38.9% Republicans, and 15.5% other party/non-affiliated.[24] Bob Casey Jr. carried the county in the 2006 Senate election when he unseated Rick Santorum. According to the Dauphin County Board of Elections, in 2008 Barack Obama became the first Democratic presidential candidate to carry Dauphin County since 1964, receiving 9.0% more of the vote than John McCain.[25] It was also only the third time Dauphin County had supported a Democrat for president since 1936. Obama won Dauphin with a slightly reduced majority in 2012, while Hillary Clinton won it with a narrow plurality in 2016. It is now the only blue county in the traditionally powerfully Republican Susquehanna Valley.
Nonetheless, the GOP still holds all of the county row offices, as well as a majority on the county commission. All but one state house seat is in Republican hands, as well as both of the state senate seats and the congressional seat. Most local elected officials are also Republican, by a margin of 3 to 1. This is because most of the Democratic gains have been in already heavily Democratic Harrisburg, which has had a Democratic mayor since 1982 and has been represented in the state house by a Democrat since 1975. In contrast, the suburbs and rural areas remain some of the most Republican areas in Pennsylvania.
Party registration stats according to the Secretary of State's office:
| Dauphin County Voter Registration Statistics as of November 7, 2022[26] | |||||
|---|---|---|---|---|---|
| Political Party | Total Voters | Percentage | |||
| Democratic | 88,154 | 45.22% | |||
| Republican | 75,049 | 38.50% | |||
| No party affiliation | 23,331 | 11.97% | |||
| Minor parties | 8,407 | 4.31% | |||
| Total | 194,941 | 100.00% | |||
County commissioners
- Michael Pries, Chairman, Republican
- Chad Saylor, Vice Chairman, Republican
- George P. Hartwick III, Secretary, Democrat
Other county offices
- Clerk of Courts, Dale Klein, Republican
- Controller, Jim Markel (acting), Republican
- Coroner, Graham Hetrick, Republican
- District Attorney, Fran Chardo, Republican
- Prothonotary, Matt Krupp, Republican
- Recorder of Deeds, Jim Zugay, Republican
- Register of Wills and Clerk of the Orphans' Court, Jean Marfizo King, Republican
- Sheriff, Nick Chimienti, Republican
- Treasurer, Janis Creason, Republican
- Solicitor, Joseph A. Curcillo III, Esquire
State Representatives
- David Hickernell, Republican, 98th district
- Patty Kim, Democrat, 103rd district
- Sue Helm, Republican, 104th district
- Andrew Lewis, Republican, 105th district
- Tom Mehaffie, Republican, 106th district
- Joseph Kerwin, Republican, 125th district
State Senate
- John DiSanto, Republican, 15th district
- Chris Gebhard, Republican, 48th district
United States House of Representatives
- Scott Perry, Republican, 10th district
United States Senate
| Senator | Party |
|---|---|
| Bob Casey | Democrat |
| Pat Toomey | Republican |
Education
Colleges and universities
- Dixon University Center
- Harrisburg Area Community College
- Harrisburg University of Science and Technology
- Penn State Harrisburg
- Penn State Hershey Medical Center
- Temple University Harrisburg Campus
- Widener University School of Law
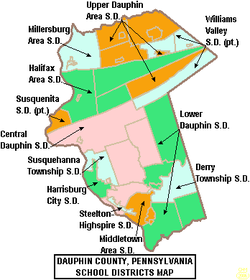
Public school districts
School districts include:[29]
- Central Dauphin School District
- Derry Township School District
- Halifax Area School District
- Harrisburg School District (Pennsylvania)
- Lower Dauphin School District
- Middletown Area School District
- Millersburg School District
- Steelton-Highspire School District
- Susquehanna Township School District
- Susquenita School District (also in Perry County)
- Upper Dauphin School District
- Williams Valley School District (also in Schuylkill County)
Public charter schools
Several public charter schools are established in Dauphin County [30]
- Infinity Charter School
- Sylvan Heights Science Charter School
- Capital Area School for the Arts
- Premier Arts and Science Charter School
Intermediate unit
The Capital Area Intermediate Unit 15 is a state approved education agency that offers: school districts, charter schools, private schools, and home school students, a variety of services including: a completely developed K–12 curriculum that is mapped and aligned with the Pennsylvania Academic Standards (available online), shared services, a group purchasing program and a wide variety of special education and special needs services.
Library system
The Dauphin County Library System provides library service to the residents of the county through a main central library in the state capital and county seat of Harrisburg, Pennsylvania and eight branch libraries. DCLS is a private, non-profit corporation. It is governed by a 17-member Board of Trustees, five appointed annually by the Dauphin County Commissioners, and twelve elected for three-year terms. The Library is a member of the Pennsylvania library system.
Private schools
As reported by the National Center for Educational Statistics[31]
- Armstrong Valley Christian School – Halifax
- Berrysburg Christian Academy – Elizabethvile
- Bishop McDevitt High School – Harrisburg
- Cathedral Consolidated School – Harrisburg
- Covenant Christian Academy – Harrisburg
- East Shore Montessori School – Harrisburg
- Emmanuel Wesleyan Academy – Gratz
- Garden Spot Amish School – Millersburg
- Garden Spot School – Millersburg
- Goddard School – Harrisburg
- Hansel and Gretel Early Learning Centers – Harrisburg
- Harrisburg Adventist School – Harrisburg
- Harrisburg Christian School – Harrisburg
- Hillside Amish School – Harrisville
- Hillside Seventh Day Adventist School – Harrisburg
- Keystone Math and Science Academy – Harrisburg
- Kinder-Care Learning Center – Harrisburg
- KinderCare Learning Center – Hershey
- Londonderry School – Harrisburg
- Mahantango School – Lykens
- Matterstown School – Millersburg
- Middletown Christian School – Middletown
- Milton Hershey School – Hershey
- North Mountain View Amish – Millersburg
- Northern Dauphin Christian School – Millersburg
- Pride of the Neighborhood Academies – Harrisburg
- Rakers Mill School – Elizabethville
- Rolling Acres School – Lykens
- Seven Sorrows of BMV School – Middletown
- Sonshine Learning Station – Middletown
- South Mountain View School – Spring Glen
- Specktown School – Lykens
- St. Catherine Laboure School – Harrisburg
- St Joan of Arc Elementary School – Hershey
- St. Margaret Mary School – Harrisburg
- St. Stephen's Episcopal School – Harrisburg
- Tender Years Inc. – Hershey
- The Nativity School of Harrisburg – Harrisburg
- Windy Knoll School – Spring Glen
- Wordsworth Academy – Harrisbrug
- Yeshiva Academy – Harrisburg
Economy
The largest employers in Dauphin County in 2019 were:[32]
- Commonwealth Government
- Milton S. Hershey Medical Center
- The Hershey Company
- Hershey Entertainment & Resorts Co.
- UPMC Pinnacle Hospitals
- Federal Government
- Pennsylvania State University
- PHEAA – Pennsylvania Higher Education Assistance Agency
- United Parcel Service Inc
- TYCO Electronics Corp.
Recreation
There are two Pennsylvania state parks in Dauphin County.
- Boyd Big Tree Preserve Conservation Area
- Joseph E. Ibberson Conservation Area
Communities

Under Pennsylvania law, there are four types of incorporated municipalities: cities, boroughs, townships, and, in at most two cases, towns. The following cities, boroughs and townships are located in Dauphin County:
City
- Harrisburg (county seat)
Boroughs
- Berrysburg
- Dauphin
- Elizabethville
- Gratz
- Halifax
- Highspire
- Hummelstown
- Lykens
- Middletown
- Millersburg
- Paxtang
- Penbrook
- Pillow
- Royalton
- Steelton
- Williamstown
Townships
Census-designated places
Census-designated places are geographical areas designated by the U.S. Census Bureau for the purposes of compiling demographic data. They are not actual jurisdictions under Pennsylvania law. Other unincorporated communities, such as villages, may be listed here as well.
Unincorporated communities
- Bachmanville
- Cartin
- Chambers Hill
- Clifton
- Dietrich
- Deodate
- Dayton
- Carsonville
- Ebenezer
- Edgemont
- Ellendale Forge
- Enders
- Enterline
- Erdman
- Estherton
- Freys Grove
- Fort Hunter
- Grantville
- Greenfield
- Hanoverdale
- Heckton
- Hockersville
- Hoernerstown
- Inglenook
- Jednota
- Killinger
- Loyalton
- Lucknow
- Manada Gap
- Manada Hill
- Matamoras
- Matterstown
- Montrose Park
- Oakleigh
- Oakmont
- Oberlin Gardens
- Paxtang Manor
- Piketown
- Powells Valley
- Rockville
- Sand Beach
- Shellsville
- Singersville
- Speeceville
- Swatara
- Vaughn
- Waynesville
Population ranking
The population ranking of the following table is based on the 2010 census of Dauphin County.[22]
† county seat
| Rank | City/Town/etc. | Municipal type | Population (2010 Census) |
|---|---|---|---|
| 1 | † Harrisburg (State Capital) | City | 49,528 |
| 2 | Hershey | CDP | 14,257 |
| 3 | Colonial Park | CDP | 13,229 |
| 4 | Progress | CDP | 9,765 |
| 5 | Middletown | Borough | 8,901 |
| 6 | Linglestown | CDP | 6,334 |
| 7 | Steelton | Borough | 5,990 |
| 8 | Paxtonia | CDP | 5,412 |
| 9 | Hummelstown | Borough | 4,538 |
| 10 | Rutherford | CDP | 4,303 |
| 11 | Skyline View | CDP | 4,003 |
| 12 | Lawnton | CDP | 3,813 |
| 13 | Penbrook | Borough | 3,008 |
| 14 | Millersburg | Borough | 2,557 |
| 15 | Highspire | Borough | 2,399 |
| 16 | Lykens | Borough | 1,799 |
| 17 | Paxtang | Borough | 1,561 |
| 18 | Elizabethville | Borough | 1,510 |
| 19 | Bressler | CDP | 1,437 |
| 20 | Williamstown | Borough | 1,387 |
| 21 | Palmdale | CDP | 1,308 |
| 22 | Enhaut | CDP | 1,007 |
| 23 | Wiconsico | CDP | 921 |
| 24 | Royalton | Borough | 907 |
| 25 | Halifax | Borough | 841 |
| 26 | Dauphin | Borough | 791 |
| 27 | Gratz | Borough | 765 |
| 28 | Oberlin | CDP | 588 |
| 29 | Lenkerville | CDP | 550 |
| 30 | Union Deposit | CDP | 407 |
| 31 | Berrysburg | Borough | 368 |
| 32 | Pillow | Borough | 298 |
Notable people
- Milton S. Hershey (1857–1945), founder of The Hershey Company and the town of Hershey
- H.B. Reese (1879–1956), inventor of Reese's Peanut Butter Cups
- Samuel B. Garver (1839–1911), an Illinois state representative, businessman, and farmer, was born in Dauphin County.
- Nicholas H. Heck (1882–1953), a geophysicist, seismologist, oceanographer, hydrographic surveyor, and United States Coast and Geodetic Survey officer, was born in Dauphin County in Heckton Mills, near Heckton.
- Michelle Wolf (1985–), comedian, was born and lived in Dauphin County
See also
- Hummelstown brownstone
- National Register of Historic Places listings in Dauphin County, Pennsylvania
Notes
- Mean monthly maxima and minima (i.e. the highest and lowest temperature readings during an entire month or year) calculated based on data at said location from 1981 to 2010.
- Official records for Harrisburg kept at downtown from July 1888 to December 1938, Capital City Airport from January 1939 to September 1991, and at Harrisburg Int'l in Middletown since October 1991.[6]
References
- "PHMC Historical Markers Search". Pennsylvania Historical and Museum Commission. Commonwealth of Pennsylvania. Archived from the original (Searchable database) on March 21, 2016. Retrieved January 25, 2014.
- Bureau, US Census. "2020 Census Demographic Data Map Viewer". The United States Census Bureau. Retrieved August 13, 2021.
- "Find a County". National Association of Counties. Archived from the original on May 31, 2011. Retrieved June 7, 2011.
- Gannett, Henry (1905). The Origin of Certain Place Names in the United States. Govt. Print. Off. pp. 100.
- "2010 Census Gazetteer Files". United States Census Bureau. August 22, 2012. Retrieved March 6, 2015.
- ThreadEx
- "NowData – NOAA Online Weather Data". National Oceanic and Atmospheric Administration. Retrieved August 7, 2021.
- "Station: Middletown Harrisburg INTL AP, PA". U.S. Climate Normals 2020: U.S. Monthly Climate Normals (1991-2020). National Oceanic and Atmospheric Administration. Retrieved August 7, 2021.
- "Harrisburg, Pennsylvania, USA - Monthly weather forecast and Climate data". Weather Atlas. Retrieved July 4, 2019.
- "NowData - NOAA Online Weather Data". National Oceanic and Atmospheric Administration. Retrieved May 12, 2021.
- "U.S. Decennial Census". United States Census Bureau. Retrieved March 6, 2015.
- "Historical Census Browser". University of Virginia Library. Retrieved March 6, 2015.
- Forstall, Richard L., ed. (March 24, 1995). "Population of Counties by Decennial Census: 1900 to 1990". United States Census Bureau. Retrieved March 6, 2015.
- "Census 2000 PHC-T-4. Ranking Tables for Counties: 1990 and 2000" (PDF). United States Census Bureau. April 2, 2001. Archived (PDF) from the original on October 9, 2022. Retrieved March 6, 2015.
- "State & County QuickFacts". United States Census Bureau. Archived from the original on June 6, 2011. Retrieved November 16, 2013.
- "U.S. Census website". United States Census Bureau. Retrieved January 31, 2008.
- Dauphin County QuickFacts from the US Census Bureau Archived June 6, 2011, at the Wayback Machine
- "Middle America Project". Echelon Insights. Retrieved December 17, 2018.
- "P2 HISPANIC OR LATINO, AND NOT HISPANIC OR LATINO BY RACE – 2020: DEC Redistricting Data (PL 94-171) – Dauphin County, Pennsylvania".
- Warner, David (August 8, 2010). "Amish community in Lykens Valley is a microcosm of national population boom". PennLive. Retrieved March 24, 2020.
- "Office of Management and Budget". February 7, 2017.
- "2010 U.S. Census website". United States Census Bureau. Retrieved February 13, 2016.
- Leip, David. "Dave Leip's Atlas of U.S. Presidential Elections". uselectionatlas.org.
- Pennsylvania Department of States, Voter registration statistics by county, accessed November 2, 2021
- "Pennsylvania Election Returns". Archived from the original on November 16, 2012. Retrieved July 12, 2017.
- Commonwealth of Pennsylvania Department of State. "November 2022 Voter Registration Statistics" (XLS). Retrieved November 7, 2022.
- Center, Legislativate Data Processing. "Find Your Legislator". The official website for the Pennsylvania General Assembly. Retrieved April 21, 2017.
- "Pennsylvania Senators, Representatives, and Congressional District Maps - GovTrack.us". GovTrack.us. Retrieved April 21, 2017.
- "2020 CENSUS - SCHOOL DISTRICT REFERENCE MAP: Dauphin County, PA" (PDF). U.S. Census Bureau. Archived (PDF) from the original on October 9, 2022. Retrieved July 20, 2022. - Text list
- Pennsylvania Department of Education Approved Public Charter Schools, January 2010
- ies, National Center for Education Statistics, US Department of Education, Institute of Education Sciences, Private School Universe Survey 2008
- "Pennsylvania Top 50 Employers & Industries" (PDF). Department of Labor and Industry. Center for Workforce Information and Analysis. Archived (PDF) from the original on October 9, 2022. Retrieved October 9, 2019.
External links
Municipalities and communities of Dauphin County, Pennsylvania, United States | ||
|---|---|---|
County seat: Harrisburg | ||
| City |
|  |
| Boroughs | ||
| Townships | ||
| CDPs | ||
| Unincorporated communities |
| |
| ||
| Topics |
|
|---|---|
| City Government |
|
| |
Authority control | |
|---|---|
| General | |
| National libraries | |
| Other |
|
На других языках
[de] Dauphin County
Dauphin County[1] ist ein County im Bundesstaat Pennsylvania der Vereinigten Staaten. Im Jahr 2020 hatte das County 286.401 Einwohner und eine Bevölkerungsdichte von 211 Einwohner pro Quadratkilometer.[2] Der Verwaltungssitz (County Seat) ist seit 1812 Harrisburg.- [en] Dauphin County, Pennsylvania
[ru] Дофин (округ)
Дофин (англ. Dauphin County) — округ в штате Пенсильвания, США. Официально образован 4-го марта 1785 года выделением из округа Ланкастер, назван в честь французского дофина Людовика Жозефа. По состоянию на 2010 год, численность населения составляла 268 100 человек.Другой контент может иметь иную лицензию. Перед использованием материалов сайта WikiSort.org внимательно изучите правила лицензирования конкретных элементов наполнения сайта.
WikiSort.org - проект по пересортировке и дополнению контента Википедии