world.wikisort.org - USA
Lebanon County (/ˈlɛbənən/ Pennsylvania Dutch: Lebanon Kaundi) is a county located in the U.S. state of Pennsylvania. As of the 2010 census, the population was 133,568.[1] Its county seat is the city of Lebanon.[2]
Lebanon County | |
|---|---|
U.S. county | |
 St. Luke's Episcopal Church | |
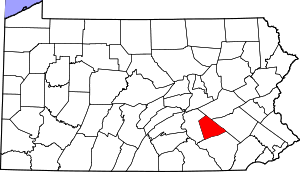 Location within the U.S. state of Pennsylvania | |
 Pennsylvania's location within the U.S. | |
| Coordinates: 40°22′N 76°28′W | |
| Country | |
| State | |
| Founded | February 16, 1813 |
| Seat | Lebanon |
| Largest city | Lebanon |
| Area | |
| • Total | 362 sq mi (940 km2) |
| • Land | 362 sq mi (940 km2) |
| • Water | 0.7 sq mi (2 km2) 0.2%% |
| Population | |
| • Estimate (2019) | 141,793 |
| • Density | 390/sq mi (150/km2) |
| Time zone | UTC−5 (Eastern) |
| • Summer (DST) | UTC−4 (EDT) |
| Congressional district | 9th |
| Website | www |
The county was formed from portions of Dauphin and Lancaster counties in 1813, with minor boundary revisions in 1814 and 1821.[3] Lebanon County comprises the Lebanon, Pennsylvania, Metropolitan Statistical Area, which is also included in the Harrisburg-York-Lebanon, Pennsylvania Combined Statistical Area. Lebanon is 72 miles northwest of Philadelphia, which is the nearest major city.
Geography
According to the U.S. Census Bureau, the county has a total area of 362 square miles (940 km2), of which 362 square miles (940 km2) is land and 0.7 square miles (1.8 km2) (0.2%) is water.[4] Most of it is drained by the Swatara Creek into the Susquehanna River while some eastern portions are drained by the Tulpehocken Creek (which originates in the county near Myerstown) eastward into the Schuylkill River. It consists in large part of a valley.[5]
Climate
The county has a hot-summer humid continental climate (Dfa) and the hardiness zone is 6b except along the northern boundary with Dauphin where it is 6a. Average monthly temperatures in center-city Lebanon range from 29.4 °F in January to 74.3 °F in July.[6]
Adjacent counties
- Schuylkill County, Pennsylvania (northeast)
- Berks County, Pennsylvania (east)
- Lancaster County, Pennsylvania (south)
- Dauphin County, Pennsylvania (west and northwest)
Major highways

 I-76 / Penna Turnpike
 I-78
I-78 I-81
I-81 US 22
US 22 US 322
 US 422
 PA 72
PA 72 PA 117
 PA 241
 PA 341
 PA 343
 PA 419
 PA 443
 PA 501
 PA 645
 PA 897
 PA 934
Demographics
| Historical population | |||
|---|---|---|---|
| Census | Pop. | %± | |
| 1820 | 16,988 | — | |
| 1830 | 20,557 | 21.0% | |
| 1840 | 21,872 | 6.4% | |
| 1850 | 26,071 | 19.2% | |
| 1860 | 31,831 | 22.1% | |
| 1870 | 34,096 | 7.1% | |
| 1880 | 38,476 | 12.8% | |
| 1890 | 48,131 | 25.1% | |
| 1900 | 53,827 | 11.8% | |
| 1910 | 59,565 | 10.7% | |
| 1920 | 63,152 | 6.0% | |
| 1930 | 67,103 | 6.3% | |
| 1940 | 72,641 | 8.3% | |
| 1950 | 81,683 | 12.4% | |
| 1960 | 90,853 | 11.2% | |
| 1970 | 99,665 | 9.7% | |
| 1980 | 108,582 | 8.9% | |
| 1990 | 113,744 | 4.8% | |
| 2000 | 120,327 | 5.8% | |
| 2010 | 133,568 | 11.0% | |
| 2020 | 143,257 | 7.3% | |
| U.S. Decennial Census[7] 1790-1960[8] 1900-1990[9] 1990-2000[10] 2010-2019[1][11] | |||
As of the census[12] of 2000, there were 120,327 people and 32,771 families residing in the county. The population density was 332 people per square mile (128/km2). There were 49,320 housing units at an average density of 136 per square mile (53/km2). The racial makeup of the county was 94.46% White, 1.29% Black or African American, 0.13% Native American, 0.89% Asian, 0.04% Pacific Islander, 2.26% from other races, and 0.94% from two or more races. 4.96% of the population were Hispanic or Latino of any race. 45.6% were of German, 11.8% American and 6.1% Irish ancestry. 92.5% spoke English, 4.2% Spanish and 1.1% Pennsylvania Dutch as their first language.
There were 46,551 households, out of which 30.40% had children under the age of 18 living with them, 57.40% were married couples living together, 9.20% had a female householder with no husband present, and 29.60% were non-families. 25.20% of all households were made up of individuals, and 11.10% had someone living alone who was 65 years of age or older. The average household size was 2.49 and the average family size was 2.98.
In the county, the population was spread out, with 23.70% under the age of 18, 8.20% from 18 to 24, 28.00% from 25 to 44, 23.70% from 45 to 64, and 16.40% who were 65 years of age or older. The median age was 39 years. For every 100 females there were 95.00 males. For every 100 females age 18 and over, there were 91.70 males.
2020 Census
| Race | Num. | Perc. |
|---|---|---|
| White (NH) | 114,004 | 79.6% |
| Black or African American (NH) | 2,555 | 1.8% |
| Native American (NH) | 119 | 0.1% |
| Asian (NH) | 2,192 | 1.53% |
| Pacific Islander (NH) | 39 | 0.03% |
| Other/Mixed (NH) | 4,000 | 2.8% |
| Hispanic or Latino | 20,348 | 14.2% |
Metropolitan Statistical Area
The United States Office of Management and Budget[14] has designated Lebanon County as the Lebanon, PA Metropolitan Statistical Area (MSA). As of the 2010 U.S. Census[15] the metropolitan area ranked 16th most populous in the State of Pennsylvania and the 296th most populous in the United States with a population of 133,568. Lebanon County is also a part of the larger Harrisburg-York-Lebanon, PA Combined Statistical Area (CSA), which combines the populations of Lebanon County as well as Adams, Cumberland, Dauphin, Perry and York Counties in Pennsylvania. The Combined Statistical Area ranked 5th in the State of Pennsylvania and 43rd most populous in the United States with a population of 1,219,422.
Politics and government
| Year | Republican | Democratic | Third party | |||
|---|---|---|---|---|---|---|
| No. | % | No. | % | No. | % | |
| 2020 | 46,731 | 65.03% | 23,932 | 33.30% | 1,195 | 1.66% |
| 2016 | 40,525 | 64.84% | 18,953 | 30.32% | 3,025 | 4.84% |
| 2012 | 35,872 | 63.18% | 19,900 | 35.05% | 1,005 | 1.77% |
| 2008 | 34,314 | 58.59% | 23,310 | 39.80% | 939 | 1.60% |
| 2004 | 37,089 | 66.63% | 18,109 | 32.53% | 467 | 0.84% |
| 2000 | 28,534 | 62.17% | 16,093 | 35.06% | 1,270 | 2.77% |
| 1996 | 21,885 | 53.73% | 14,187 | 34.83% | 4,663 | 11.45% |
| 1992 | 21,512 | 50.00% | 12,350 | 28.71% | 9,159 | 21.29% |
| 1988 | 24,415 | 66.69% | 11,912 | 32.54% | 281 | 0.77% |
| 1984 | 27,008 | 71.61% | 10,520 | 27.89% | 188 | 0.50% |
| 1980 | 24,495 | 68.99% | 8,281 | 23.32% | 2,731 | 7.69% |
| 1976 | 20,880 | 62.65% | 11,785 | 35.36% | 665 | 2.00% |
| 1972 | 25,008 | 77.38% | 6,683 | 20.68% | 629 | 1.95% |
| 1968 | 21,832 | 64.16% | 9,529 | 28.01% | 2,664 | 7.83% |
| 1964 | 17,891 | 52.86% | 15,882 | 46.93% | 72 | 0.21% |
| 1960 | 25,525 | 68.33% | 11,761 | 31.49% | 67 | 0.18% |
| 1956 | 22,556 | 68.35% | 10,406 | 31.53% | 41 | 0.12% |
| 1952 | 20,726 | 63.83% | 11,611 | 35.76% | 135 | 0.42% |
| 1948 | 15,553 | 61.62% | 9,418 | 37.31% | 270 | 1.07% |
| 1944 | 15,206 | 56.00% | 11,818 | 43.52% | 129 | 0.48% |
| 1940 | 13,449 | 50.08% | 13,315 | 49.58% | 93 | 0.35% |
| 1936 | 13,213 | 48.09% | 13,800 | 50.23% | 463 | 1.69% |
| 1932 | 10,487 | 58.97% | 5,924 | 33.31% | 1,373 | 7.72% |
| 1928 | 16,841 | 82.30% | 3,278 | 16.02% | 345 | 1.69% |
| 1924 | 9,494 | 74.27% | 2,464 | 19.28% | 825 | 6.45% |
| 1920 | 8,778 | 70.78% | 3,016 | 24.32% | 608 | 4.90% |
| 1916 | 5,876 | 57.45% | 3,821 | 37.36% | 531 | 5.19% |
| 1912 | 2,378 | 22.48% | 2,972 | 28.09% | 5,230 | 49.43% |
| 1908 | 6,874 | 67.08% | 2,858 | 27.89% | 515 | 5.03% |
| 1904 | 6,938 | 70.19% | 2,449 | 24.78% | 497 | 5.03% |
| 1900 | 7,089 | 66.76% | 3,050 | 28.72% | 479 | 4.51% |
| 1896 | 7,288 | 70.60% | 2,819 | 27.31% | 216 | 2.09% |
| 1892 | 5,403 | 59.11% | 3,409 | 37.29% | 329 | 3.60% |
| 1888 | 6,096 | 61.61% | 3,670 | 37.09% | 129 | 1.30% |
| 1884 | 5,207 | 63.45% | 2,977 | 36.28% | 22 | 0.27% |
| 1880 | 5,042 | 60.95% | 3,218 | 38.90% | 13 | 0.16% |
Voter registration
According to the Secretary of State's office, Republicans comprise a majority of registered voters in Lebanon County.
| Lebanon County Voter Registration Statistics as of November 7, 2022[18] | |||||
|---|---|---|---|---|---|
| Political Party | Total Voters | Percentage | |||
| Republican | 50,481 | 55.15% | |||
| Democratic | 26,701 | 29.17% | |||
| No party affiliation | 10,264 | 11.21% | |||
| Minor parties | 4,081 | 4.46% | |||
| Total | 91,527 | 100.00% | |||
United States House of Representatives
The county is located in the 9th congressional district, represented by Dan Meuser, Republican.
State Senate
All of the county falls within the 48th Senatorial District. The seat is currently held by Lebanon business owner and Republican Chris Gebhard.
State House of Representatives
The county is divided into the 101st, 102nd and 104th Pennsylvania House Districts.
101st District
- The 101st District, served by Republican Frank Ryan, includes:
|
102nd District
- The 102nd District, served by Republican Russ Diamond, includes:
|
|
|
104th District
The 104th District, which includes North Annville Twp. and East Hanover Twp., is represented by Republican Sue Helm.
County government
The county is governed by three commissioners, who are elected every four years from a slate of four candidates (two Democrats and two Republicans). Other elected officials include County Controller, Sheriff, Coroner, Prothonotary and Clerk of Court, Recorder of Deeds, County Treasurer, and Register of Wills and Clerk of Orphans' Court.
Electoral history
For most of its history, Lebanon County has been one of the most Republican counties in Pennsylvania. The county is strongly Republican even by the standards of south-central Pennsylvania. It is very conservative for an urban county, having only supported a Democrat for president once since 1880. That came when Franklin D. Roosevelt won it in his 46-state landslide reelection; even then, FDR only carried it by 587 votes. The only other time since 1880 that the county has failed to support a Republican was in 1912, when the GOP was mortally divided and Theodore Roosevelt carried it on the Bull Moose ticket.
As a measure of how Republican the county has been, Democrats have only crossed the 40 percent mark three times since 1936–FDR in 1940 and 1944, and Lyndon B. Johnson in 1964. In the latter election, Lebanon County was one of only four counties in the state to vote for Barry Goldwater, along with Snyder, Union, and Wayne counties.
Republicans are no less dominant at the state and local level. The row offices and all but one county commission seat are held by Republicans, and there are no elected Democrats above the county level.
In the 2006 election for U.S. Senate, the county cast 21,756 votes (55.1%) for Republican Rick Santorum and 17,737 (44.9%) for Democrat Bob Casey, Jr., who won the race. In that year's gubernatorial election, the county cast 22,775 votes (57.5%) for Republican Lynn Swann and 16,813 (42.5%) for Democrat Ed Rendell, who won the race.[19]
In the 2004 presidential election, the county cast 37,089 votes (66.6%) for Republican George W. Bush and 18,109 (32.5%) for Democrat John Kerry. In that same year's election for U.S. Senate, the county cast 35,336 votes (66.8%) for Republican Arlen Specter, 13,182 for Democrat Joe Hoeffel, 3,320 (6.3%) for Constitution Party candidate Jim Clymer, and 1,083 (2.0%) for Libertarian Betsy Summers.[20] In the 2008 presidential election the county cast 34,314 votes (58.59%) for Republican John McCain and 23,310 votes (39.8%) for Barack Obama.[21] In the 2016 presidential election, the county cast 38,804 votes (65,9 %) for Republican Donald Trump and 17,860 votes (30,3 %) for Democrat Hillary Clinton.[22]
In the 2002 gubernatorial election, the county cast 22,659 votes (62.7%) for Republican Mike Fisher and 12,712 (35.2%) for Democrat Ed Rendell, who won the race. In the 2002 race for the U.S. House of Representatives, Republican George Gekas received 21,733 votes (60.9%) from the county while Democrat Tim Holden received 13,945 (39.1%); Holden won.[23]
Education
Colleges and universities
- Harrisburg Area Community College (Lebanon Campus)
- Lebanon Valley College
- Evangelical Seminary
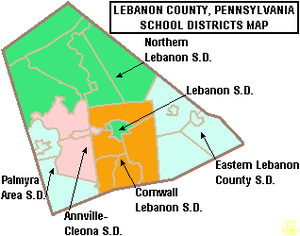
Public school districts
- Annville-Cleona School District
- Cornwall-Lebanon School District
- Eastern Lebanon County School District
- Lebanon School District
- Northern Lebanon School District
- Palmyra Area School District
Communities

Under Pennsylvania law, there are four types of incorporated municipalities: cities, boroughs, townships, and, in at most two cases, towns. The following cities, boroughs and townships are located in Lebanon County:
City
- Lebanon (county seat)
Boroughs
Townships
- Annville
- Bethel
- Cold Spring
- East Hanover
- Heidelberg
- Jackson
- Millcreek
- North Annville
- North Cornwall
- North Lebanon
- North Londonderry
- South Annville
- South Lebanon
- South Londonderry
- Swatara
- Union
- West Cornwall
- West Lebanon
Census-designated places
Census-designated places are geographical areas designated by the U.S. Census Bureau for the purposes of compiling demographic data. They are not actual jurisdictions under Pennsylvania law.
- Annville
- Avon
- Campbelltown
- Fort Indiantown Gap
- Fredericksburg
- Hebron
- Lebanon South
- Mount Gretna Heights
- Newmanstown
- Pleasant Hill
- Quentin
- Sand Hill
- Schaefferstown
- Timber Hills
Other unincorporated communities
- Anthracite
- Bellegrove
- Beverly Heights
- Bordnersville
- Buffalo Springs
- Bunker Hill
- Canaan Grove
- Clear Spring
- Coffeetown
- Colebrook
- Coheva
- Dogtown
- East Hanover
- Ebenezer
- Edisonville
- Eustontown
- Flintville
- Fontana
- Freeport Mills
- Gold Mine
- Gravel Hill
- Greble
- Green Point
- Hamlin
- Harper Tavern
- Hauckville
- Heilmandale
- Indiantown
- Inwood
- Iona
- Johnstown
- Kleinfeltersville
- Kutztown
- Lawn
- Lickdale
- McGillstown
- Midway
- Millardsville
- Millbach
- Millbach Springs
- Mount Ararat
- Mount Pleasant
- Mount Wilson
- Mount Zion
- Murray
- Nacetown
- Ono
- Pansy Hill
- Plainville
- Prescott
- Reinoeldville
- Reistville
- Rocherty
- Rockwood
- Sheridan
- Shirksville
- Springhaven
- Stricklerstown
- Syner
- Union Water Works
- Upper Lawn
- Valley Glenn
- Waldeck
- Weavertown, Jackson Township
- Weavertown, North Lebanon Township
- West Jonestown
- Westmont
- Woodfort
- Zinns Mill
Ghost towns
- Cold Spring
- Rausch Gap
Population ranking
The population ranking of the following table is based on the 2010 census of Lebanon County.[15]
† county seat
| Rank | City/Town/etc. | Municipal type | Population (2010 Census) |
|---|---|---|---|
| 1 | † Lebanon | City | 25,477 |
| 2 | Palmyra | Borough | 7,320 |
| 3 | Annville (township) | CDP | 4,767 |
| 4 | Cornwall | Borough | 4,112 |
| 5 | Campbelltown | CDP | 3,616 |
| 6 | Myerstown | Borough | 3,062 |
| 7 | Pleasant Hill | CDP | 2,643 |
| 8 | Sand Hill | CDP | 2,496 |
| 9 | Newmanstown | CDP | 2,478 |
| 10 | Lebanon South | CDP | 2,270 |
| 11 | Cleona | Borough | 2,080 |
| 12 | Jonestown | Borough | 1,905 |
| 13 | Avon | CDP | 1,667 |
| 14 | Richland | Borough | 1,519 |
| 15 | Fredericksburg | CDP | 1,357 |
| 16 | Hebron | CDP | 1,305 |
| 17 | Schaefferstown | CDP | 941 |
| 18 | Quentin | CDP | 594 |
| 19 | Timber Hills | CDP | 360 |
| 20 | Mount Gretna Heights | CDP | 323 |
| 21 | Mount Gretna | Borough | 196 |
| 22 | Fort Indiantown Gap | CDP | 143 |
Parks and recreational places
- Memorial Lake State Park
- Swatara State Park
- Union Canal Tunnel Park
- Lions Lake Park
- Coleman's Memorial Park
- Stoever's Dam Park
- South Hill's Park
- Mount Gretna Lake
- Middle Creek Wildlife Management Area
- Lebanon Valley Rails to Trails
- Bordner Cabin
See also
- National Register of Historic Places listings in Lebanon County, Pennsylvania
References
- "State & County QuickFacts". United States Census Bureau. Archived from the original on June 6, 2011. Retrieved November 17, 2013.
- "Find a County". National Association of Counties. Archived from the original on May 31, 2011. Retrieved June 7, 2011.
- Our County Archived July 9, 2013, at the Wayback Machine. Lebanon County Historical Society. Retrieved on July 23, 2013.
- "2010 Census Gazetteer Files". United States Census Bureau. August 22, 2012. Retrieved March 9, 2015.
- Ripley, George; Dana, Charles A., eds. (1879). . The American Cyclopædia.
- "PRISM Climate Group, Oregon State U". prism.oregonstate.edu. Retrieved July 29, 2021.
- "U.S. Decennial Census". United States Census Bureau. Retrieved March 9, 2015.
- "Historical Census Browser". University of Virginia Library. Archived from the original on August 11, 2012. Retrieved March 9, 2015.
- Forstall, Richard L., ed. (March 24, 1995). "Population of Counties by Decennial Census: 1900 to 1990". United States Census Bureau. Archived from the original on March 20, 2015. Retrieved March 9, 2015.
- "Census 2000 PHC-T-4. Ranking Tables for Counties: 1990 and 2000" (PDF). United States Census Bureau. April 2, 2001. Archived (PDF) from the original on December 18, 2014. Retrieved March 9, 2015.
- "Census 2020".
- "U.S. Census website". United States Census Bureau. Retrieved January 31, 2008.
- "P2 HISPANIC OR LATINO, AND NOT HISPANIC OR LATINO BY RACE – 2020: DEC Redistricting Data (PL 94-171) – Lebanon County, Pennsylvania".
- "Office of Management and Budget". whitehouse.gov. Archived from the original on April 29, 2018. Retrieved May 4, 2018.
- "2010 U.S. Census website". United States Census Bureau. Retrieved July 10, 2016.
- Leip, David. "Dave Leip's Atlas of U.S. Presidential Elections". uselectionatlas.org. Archived from the original on March 23, 2018. Retrieved May 4, 2018.
- http://geoelections.free.fr/. Retrieved January 13, 2021.
{{cite web}}: Missing or empty|title=(help) - Commonwealth of Pennsylvania Department of State. "November 2022 Voter Registration Statistics". Archived from the original (XLS) on March 9, 2021. Retrieved November 7, 2022.
- "Commonwealth of PA - Elections Information". Archived from the original on May 29, 2008. Retrieved March 10, 2009.
- "Commonwealth of PA - Elections Information". Archived from the original on November 27, 2008. Retrieved March 10, 2009.
- "Dave Leip's Atlas of U.S. Presidential Elections - State Data". Archived from the original on December 1, 2008. Retrieved January 5, 2009.
- "Pennsylvania Election Results 2016: President Live Map by County, Real-Time Voting Updates". Election Hub. Archived from the original on November 7, 2017. Retrieved May 4, 2018.
- "Commonwealth of PA - Elections Information". Archived from the original on May 15, 2008. Retrieved May 16, 2008.
External links
 Geographic data related to Lebanon County, Pennsylvania at OpenStreetMap
- County of Lebanon (official website)
- Lebanon County Pages
- Lebanon County Historical Society
- Lebanon County Tourism Promotion Agency
- Lebanon Valley Exposition Center and Fairgrounds
Municipalities and communities of Lebanon County, Pennsylvania, United States | ||
|---|---|---|
County seat: Lebanon | ||
| City |  | |
| Boroughs | ||
| Townships |
| |
| CDPs |
| |
| Unincorporated communities |
| |
| ||
Authority control | |
|---|---|
| General | |
| National libraries | |
| Other | |
На других языках
[de] Lebanon County
Lebanon County[1] ist ein County im Bundesstaat Pennsylvania der Vereinigten Staaten. Bei der Volkszählung im Jahr 2020 hatte das County 143.257 Einwohner und eine Bevölkerungsdichte von 153 Einwohnern pro Quadratkilometer. Der Verwaltungssitz (County Seat) ist Lebanon.- [en] Lebanon County, Pennsylvania
[ru] Лебанон (округ)
Округ Ле́банон (англ. Lebanon County) располагается в штате Пенсильвания, США. Официально образован 16-го февраля 1813 года. По состоянию на 2010 год, численность населения составляла 133 568 человек.Другой контент может иметь иную лицензию. Перед использованием материалов сайта WikiSort.org внимательно изучите правила лицензирования конкретных элементов наполнения сайта.
WikiSort.org - проект по пересортировке и дополнению контента Википедии