world.wikisort.org - USA
Elk County is a county in the U.S. state of Pennsylvania. As of the 2020 United States Census, the population was 30,990.[2] Its county seat is Ridgway.[3] The county was created on April 18, 1843, from parts of Jefferson, Clearfield and McKean Counties, and is named for the eastern elk (Cervus canadensis canadensis) that historically inhabited the region.
Elk County | |
|---|---|
U.S. county | |
 County courthouse in Ridgway | |
 Location within the U.S. state of Pennsylvania | |
 Pennsylvania's location within the U.S. | |
| Coordinates: 41°25′N 78°39′W | |
| Country | |
| State | |
| Founded | 18 April 1843 |
| Named for | Eastern elk |
| Seat | Ridgway |
| Largest city | St. Marys |
| Area | |
| • Total | 832 sq mi (2,150 km2) |
| • Land | 827 sq mi (2,140 km2) |
| • Water | 4.9 sq mi (13 km2) 0.6%% |
| Population (2020) | |
| • Total | 30,990[1] |
| • Density | 37.5/sq mi (14.5/km2) |
| Time zone | UTC−5 (Eastern) |
| • Summer (DST) | UTC−4 (EDT) |
| Congressional district | 15th |
| Website | www |
The county is notable for having one of the highest concentrations of Roman Catholics in the United States, with 69% of the county's residents identifying as Catholic.
Geography
Elk County consists of low rolling hills, carved by frequent drainages and heavily wooded.
According to the United States Census Bureau, the county has a total area of 832 square miles (2,150 km2), of which 827 square miles (2,140 km2) is land and 4.9 square miles (13 km2) (0.6%) is water.[4] Elk has a warm-summer humid continental climate (Dfb) and average monthly temperatures in Ridgway range from 23.2 °F in January to 67.4 °F in July, while in Saint Marys they range from 22.6 °F in January to 66.8 °F in July.
Adjacent counties
- McKean County - north
- Cameron County - east
- Clearfield County - south
- Jefferson County - southwest
- Forest County - west
- Warren County - northwest
National protected area
- Allegheny National Forest (part)
State protected areas
- Bendigo State Park
- Elk State Park
Major highways
 US 219
 US 219 Truck
 PA 66
PA 66 PA 120
 PA 153
 PA 255
 PA 321
 PA 555
 PA 948
 PA 949
Demographics
| Historical population | |||
|---|---|---|---|
| Census | Pop. | %± | |
| 1850 | 3,531 | — | |
| 1860 | 5,915 | 67.5% | |
| 1870 | 8,488 | 43.5% | |
| 1880 | 12,800 | 50.8% | |
| 1890 | 22,239 | 73.7% | |
| 1900 | 32,903 | 48.0% | |
| 1910 | 35,871 | 9.0% | |
| 1920 | 34,981 | −2.5% | |
| 1930 | 33,431 | −4.4% | |
| 1940 | 34,443 | 3.0% | |
| 1950 | 34,503 | 0.2% | |
| 1960 | 37,328 | 8.2% | |
| 1970 | 37,770 | 1.2% | |
| 1980 | 38,338 | 1.5% | |
| 1990 | 34,878 | −9.0% | |
| 2000 | 35,111 | 0.7% | |
| 2010 | 31,946 | −9.0% | |
| 2020 | 30,990 | −3.0% | |
| [5] | |||

As of the 2020 United States Census,[6] there were 30,990 people and 14,215 households. The population density was 38/sqmi (16/km2). There were 16,855 housing units at an average density of 20/sqmi (8/km2). The racial makeup of the county was 97.9% White, 0.5% Black or African American, 0.2% Native American, 0.4% Asian, and 1.0% from two or more races. 0.8% of the population were Hispanic or Latino of any race. 41% were of German, 13% Italian, 9% American, 6% Irish, 4% Polish, 4% Swedish, 3% English.
There were 14,124 households, out of which 31.00% had children under the age of 18 living with them, 56.00% were married couples living together, 8.70% had a female householder with no husband present, and 31.00% were non-families. 27.30% of all households were made up of individuals, and 13.60% had someone living alone who was 65 years of age or older. The average household size was 2.45 and the average family size was 2.99.
The county population contained 24.00% under the age of 18, 6.80% from 18 to 24, 28.60% from 25 to 44, 23.30% from 45 to 64, and 17.30% who were 65 years of age or older. The median age was 39 years. For every 100 females there were 98.00 males. For every 100 females age 18 and over, there were 95.30 males.
Elk County has one of the highest concentrations of Roman Catholics in the United States. As of 2010, nearly 70% of the county's residents identified as Catholic.
2020 Census
| Race | Num. | Perc. |
|---|---|---|
| White (NH) | 30,339 | 97.9% |
| Black or African American (NH) | 155 | 0.5% |
| Native American (NH) | 62 | 0.2% |
| Asian (NH) | 124 | 0.4% |
| Other/Mixed (NH) | 310 | 1.0% |
| Hispanic or Latino | 279 | .9% |
Politics and government

Trump: 50–60% 60–70% 70–80%
| Year | Republican | Democratic | Third party | |||
|---|---|---|---|---|---|---|
| No. | % | No. | % | No. | % | |
| 2020 | 12,140 | 71.64% | 4,522 | 26.68% | 284 | 1.68% |
| 2016 | 10,025 | 68.91% | 3,853 | 26.49% | 669 | 4.60% |
| 2012 | 7,579 | 57.08% | 5,463 | 41.14% | 237 | 1.78% |
| 2008 | 6,676 | 46.48% | 7,290 | 50.76% | 396 | 2.76% |
| 2004 | 7,872 | 54.10% | 6,602 | 45.37% | 76 | 0.52% |
| 2000 | 7,347 | 54.10% | 5,754 | 42.37% | 479 | 3.53% |
| 1996 | 4,889 | 37.57% | 5,749 | 44.18% | 2,375 | 18.25% |
| 1992 | 4,908 | 35.48% | 5,016 | 36.26% | 3,908 | 28.25% |
| 1988 | 6,737 | 52.86% | 5,879 | 46.13% | 128 | 1.00% |
| 1984 | 8,470 | 60.47% | 5,486 | 39.17% | 51 | 0.36% |
| 1980 | 7,175 | 52.49% | 5,898 | 43.15% | 596 | 4.36% |
| 1976 | 6,159 | 46.98% | 6,713 | 51.21% | 237 | 1.81% |
| 1972 | 7,900 | 61.20% | 4,710 | 36.49% | 298 | 2.31% |
| 1968 | 6,193 | 44.09% | 6,886 | 49.02% | 967 | 6.88% |
| 1964 | 4,354 | 29.36% | 10,455 | 70.51% | 19 | 0.13% |
| 1960 | 7,155 | 45.96% | 8,398 | 53.95% | 14 | 0.09% |
| 1956 | 8,947 | 61.84% | 5,498 | 38.00% | 23 | 0.16% |
| 1952 | 7,702 | 54.26% | 6,448 | 45.42% | 45 | 0.32% |
| 1948 | 5,148 | 48.98% | 5,363 | 51.02% | 0 | 0.00% |
| 1944 | 5,645 | 47.80% | 6,097 | 51.63% | 67 | 0.57% |
| 1940 | 6,949 | 49.99% | 6,920 | 49.78% | 31 | 0.22% |
| 1936 | 5,489 | 35.12% | 9,035 | 57.80% | 1,107 | 7.08% |
| 1932 | 5,797 | 46.39% | 6,461 | 51.70% | 239 | 1.91% |
| 1928 | 5,234 | 40.23% | 7,705 | 59.23% | 70 | 0.54% |
| 1924 | 6,626 | 70.85% | 1,370 | 14.65% | 1,356 | 14.50% |
| 1920 | 5,267 | 66.14% | 2,093 | 26.28% | 604 | 7.58% |
| 1916 | 2,829 | 52.34% | 2,186 | 40.44% | 390 | 7.22% |
| 1912 | 603 | 10.50% | 2,057 | 35.82% | 3,082 | 53.67% |
| 1908 | 2,991 | 51.52% | 2,531 | 43.60% | 283 | 4.88% |
| 1904 | 3,820 | 55.25% | 2,857 | 41.32% | 237 | 3.43% |
| 1900 | 3,254 | 50.06% | 3,105 | 47.77% | 141 | 2.17% |
| 1896 | 2,807 | 49.57% | 2,717 | 47.98% | 139 | 2.45% |
| 1892 | 1,438 | 38.94% | 2,126 | 57.57% | 129 | 3.49% |
| 1888 | 1,321 | 41.09% | 1,824 | 56.73% | 70 | 2.18% |
Voter Registration
As of November 4, 2022, there are 20,227 registered voters in Elk County.[9]
Chart of Voter Registration
- Democratic: 6,768 (33.46%)
- Republican: 11,123 (54.99%)
- Third Party: 2,336 (11.55%)
Elk County was primarily settled by German Catholics and the county's politics have historically been defined by the county's Catholic heritage. Prior to 1896, the county was a Democratic stronghold, similar to most other German Catholic counties with populations opposed to the Civil War, and while Republicans won the county from 1896 to 1908, their margins were far narrower than their margins nationwide. In the 1910s, the county's predominantly German-American populace became opposed to the foreign policies of the Wilson Administration, and thus voted against Wilson in 1916, as well as giving Republicans Warren G. Harding and Calvin Coolidge over 65% of the vote. In 1928, however, with Catholic Al Smith as the Democratic nominee, he won nearly 60% of the county's vote and received a higher percentage of the vote than FDR did in any of his four presidential runs, even though FDR won his four elections with landslide margins and Smith lost by a landslide.
Elk County tended to be politically competitive in statewide and national elections. The county has frequently voted with the eventual winner of national elections, from 1920 to 2008, except for 1928 when Al Smith carried the county with nearly 60% of the vote over winner Herbert Hoover (due to the county's Catholicsm), 1940 when Wendell Willkie carried the county with a very slim margin of 29 votes over incumbent Franklin D. Roosevelt(due to tensions between the Roosevelt administration and Germany), and in 1968, when Hubert Humphrey won it over eventual winner Richard Nixon. The county was carried by George W. Bush in 2000 and 2004, and by Barack Obama in 2008
The county has recently become a solid Republican county like most of rural Pennsylvania. Mitt Romney won the county in 2012 over Obama's victorious ticket. Like most other rural counties, both in Pennsylvania and nationwide, Donald Trump strongly won the county in 2016 and 2020 -- increasing his margin in the latter, making it the strongest performance by any single candidate in the county's history (although Coolidge had carried the county by a larger margin in 1924).
County commissioners
- Joseph Daghir, Republican
- M. Fritz Lecker, Republican
- Matthew G. Quesenberry, Democrat
Other county offices
- Clerk of Courts and Prothonotary, Susanne Schneider, Republican
- Coroner, Michelle Muccio, Republican
- District Attorney, Shawn McMahon,
- Register of Wills and Recorder of Deeds, Lee Neureiter, Republican
- Sheriff, Todd Caltagarone, Republican
- Treasurer, Peggy Schneider, Democrat
State representative[11]
- Mike Armanini, Republican, 75th district
State senator[11]
- Cris Dush, Republican, 25th district
U.S. representative
- Glenn "G.T." Thompson, Republican, 15th district
Education

Public school districts
- Brockway Area School District
- Forest Area School District
- Kane Area School District
- Johnsonburg Area School District
- Ridgway Area School District
- Saint Marys Area School District
Private schools
- Elk County Catholic High School
- St Boniface School - Kersey
- St Leo School - Ridgway
- St Marys Catholic Elementary School = Saint Marys
- St Marys Catholic Middle School = Saint Marys
- North Central Workforce Investment Board - Ridgway
- Anne Forbes Nursery School - Ridgway
Libraries
- Elk County Library System - Saint Marys
- Johnsonburg Public Library - Johnsonburg
- Ridgway Free Public Library - Ridgway
- Saint Marys Public Library - Saint Marys
- Tri State Coll Library Co-Op - Rosemont
- Wilcox Public Library - Wilcox
Communities

Under Pennsylvania law, there are four types of incorporated municipalities: cities, boroughs, townships, and, in at most two cases, towns. The following cities, boroughs, and townships are located in Elk County:
City
Boroughs
- Johnsonburg
- Ridgway (county seat)
Census-designated places
Unincorporated communities
- Arroyo
- Dagus Mines
- Loleta
- Portland Mills[12]
Townships
Population ranking
The population ranking of the following table is based on the 2010 census of Elk County.[13]
† county seat
| Rank | City/Town/etc. | Municipal type | Population (2010 Census) |
|---|---|---|---|
| 1 | St. Marys | City | 13,070 |
| 2 | † Ridgway | Borough | 4,078 |
| 3 | Johnsonburg | Borough | 2,483 |
| 4 | Kersey | CDP | 937 |
| 5 | Weedville | CDP | 542 |
| 6 | Byrnedale | CDP | 427 |
| 7 | Wilcox | CDP | 383 |
| 8 | James City | CDP | 287 |
| 9 | Force | CDP | 253 |
See also
- National Register of Historic Places listings in Elk County, Pennsylvania
References
- "Population and Housing Unit Estimates". Retrieved March 14, 2022.
- "Census - Geography Profile: Elk County, Pennsylvania". United States Census Bureau. Retrieved June 26, 2022.
- "Find a County". National Association of Counties. Archived from the original on May 31, 2011. Retrieved June 7, 2011.
- "2010 Census Gazetteer Files". US Census Bureau. August 22, 2012. Retrieved March 5, 2015.
- "Census 2020".
- "U.S. Census website". US Census Bureau. Retrieved August 31, 2022.
- "P2 HISPANIC OR LATINO, AND NOT HISPANIC OR LATINO BY RACE – 2020: DEC Redistricting Data (PL 94-171) – Elk County, Pennsylvania".
- Leip, David. "Atlas of US Presidential Elections". uselectionatlas.org. Retrieved November 25, 2018.
- "Voter registration statistics by county". Dos.state.pa.us. Retrieved August 5, 2022.
- "Meet the Commissioners".
- Center, Legislativate Data Processing. "Find Your Legislator". The official website for the Pennsylvania General Assembly. Retrieved May 11, 2017.
- Portland Mills PA (Google Maps - accessed 11 November 2019)
- "2010 U.S. Census website". United States Census Bureau. Retrieved February 10, 2013.
Municipalities and communities of Elk County, Pennsylvania, United States | ||
|---|---|---|
County seat: Ridgway | ||
| City | 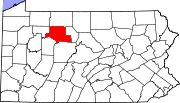 | |
| Boroughs | ||
| Townships | ||
| CDPs | ||
| Unincorporated communities | ||
| ||
Authority control | |
|---|---|
| General | |
| National libraries | |
| Other | |
На других языках
[de] Elk County (Pennsylvania)
Elk County[1] ist ein County im Bundesstaat Pennsylvania der Vereinigten Staaten. Bei der Volkszählung im Jahr 2020 hatte das County 30.990 Einwohner und eine Bevölkerungsdichte von 15 Einwohner pro Quadratkilometer.[2] Der Verwaltungssitz (County Seat) ist Ridgway.- [en] Elk County, Pennsylvania
[ru] Элк (округ, Пенсильвания)
Округ Элк (англ. Elk County) располагается в штате Пенсильвания, США. Официально образован 18-го апреля 1843 года. По состоянию на 2010 год, численность населения составляла 31 946 человек.Другой контент может иметь иную лицензию. Перед использованием материалов сайта WikiSort.org внимательно изучите правила лицензирования конкретных элементов наполнения сайта.
WikiSort.org - проект по пересортировке и дополнению контента Википедии