world.wikisort.org - USA
Clarion County is a county located in the U.S. state of Pennsylvania. As of the 2020 census, the population was 37,241.[2] Its county seat is Clarion.[3] The county was formed on March 11, 1839, from parts of Venango and Armstrong counties. Clarion County is entirely defined as part of the Pittsburgh media market.
Clarion County | |
|---|---|
U.S. county | |
 Clarion County Courthouse | |
 Seal | |
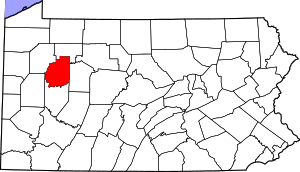 Location within the U.S. state of Pennsylvania | |
 Pennsylvania's location within the U.S. | |
| Coordinates: 41°11′N 79°25′W | |
| Country | |
| State | |
| Founded | March 11, 1839 |
| Named for | Clarion River |
| Seat | Clarion |
| Largest borough | Clarion |
| Area | |
| • Total | 610 sq mi (1,600 km2) |
| • Land | 601 sq mi (1,560 km2) |
| • Water | 9.0 sq mi (23 km2) 1.5%% |
| Population | |
| • Estimate (2020) | 37,241 |
| • Density | 66/sq mi (25/km2) |
| Time zone | UTC−5 (Eastern) |
| • Summer (DST) | UTC−4 (EDT) |
| Congressional district | 15th |
| Website | www |
Pennsylvania Historical Marker | |
| Designated | April 26, 1982[1] |
Geography
According to the U.S. Census Bureau, the county has a total area of 610 square miles (1,600 km2), of which 601 square miles (1,560 km2) is land and 9.0 square miles (23 km2) (1.5%) is water.[4] It has a warm-summer humid continental climate (Dfb), and average temperatures in Clarion borough range from 24.5 °F in January to 82 °F in July.[5]
Adjacent counties
- Forest County (north)
- Jefferson County (east)
- Armstrong County (south)
- Butler County (west)
- Venango County (west)
Parks
Part of Cook Forest State Park is in Clarion County.
The Clarion County Park is located in Paint Township. Clarion County Veterans Memorial Park is located directly across Main Street (Route 322) from the Clarion County Courthouse in the center of the Borough of Clarion.
Major highways
 I-80
I-80 US 322
 PA 28
PA 28 PA 36
PA 36 PA 58
PA 58 PA 66
PA 66 PA 68
PA 68 PA 157
 PA 208
 PA 338
 PA 368
 PA 478
 PA 536
 PA 861
Demographics
| Historical population | |||
|---|---|---|---|
| Census | Pop. | %± | |
| 1850 | 23,565 | — | |
| 1860 | 24,988 | 6.0% | |
| 1870 | 26,537 | 6.2% | |
| 1880 | 40,328 | 52.0% | |
| 1890 | 36,802 | −8.7% | |
| 1900 | 34,283 | −6.8% | |
| 1910 | 36,683 | 7.0% | |
| 1920 | 36,170 | −1.4% | |
| 1930 | 34,531 | −4.5% | |
| 1940 | 38,410 | 11.2% | |
| 1950 | 38,334 | −0.2% | |
| 1960 | 37,480 | −2.2% | |
| 1970 | 38,414 | 2.5% | |
| 1980 | 43,362 | 12.9% | |
| 1990 | 41,699 | −3.8% | |
| 2000 | 41,765 | 0.2% | |
| 2010 | 39,988 | −4.3% | |
| 2020 | 37,241 | −6.9% | |
| U.S. Decennial Census[6] 1790-1960[7] 1900-1990[8] 1990-2000[9] 2010-2017[2] | |||
As of the census[10] of 2000, there were 41,765 people, 16,052 households, and 10,738 families residing in the county. The population density was 69 people per square mile (27/km2). There were 19,426 housing units at an average density of 32 per square mile (12/km2). The racial makeup of the county was 98.16% White, 0.79% Black or African American, 0.11% Native American, 0.34% Asian, 0.08% from other races, and 0.52% from two or more races. 0.41% of the population were Hispanic or Latino of any race. 43.9% were English or Welsh, 12.9% American, 10.5% German, 8.0% Irish, 6.3% Scotch-Irish, 5.5% Italian and 2.6% Dutch, and 2.0% French ancestry.
There were 16,052 households, out of which 28.60% had children under the age of 18 living with them, 54.90% were married couples living together, 8.40% had a female householder with no husband present, and 33.10% were non-families. 26.00% of all households were made up of individuals, and 11.30% had someone living alone who was 65 years of age or older. The average household size was 2.46 and the average family size was 2.95.
In the county, the population was spread out, with 21.60% under the age of 18, 15.40% from 18 to 24, 25.20% from 25 to 44, 22.70% from 45 to 64, and 15.20% who were 65 years of age or older. The median age was 36 years. For every 100 females there were 93.30 males. For every 100 females age 18 and over, there were 90.40 males.
2020 Census
| Race | Num. | Perc. |
|---|---|---|
| White (NH) | 35,023 | 94% |
| Black or African American (NH) | 521 | 1.4% |
| Native American (NH) | 39 | 0.1% |
| Asian (NH) | 175 | 0.47% |
| Pacific Islander (NH) | 15 | 0.04% |
| Other/Mixed (NH) | 1,081 | 3% |
| Hispanic or Latino | 387 | 1% |
Government
| Year | Republican | Democratic | Third party | |||
|---|---|---|---|---|---|---|
| No. | % | No. | % | No. | % | |
| 2020 | 14,578 | 74.67% | 4,678 | 23.96% | 268 | 1.37% |
| 2016 | 12,576 | 71.21% | 4,273 | 24.20% | 811 | 4.59% |
| 2012 | 10,828 | 66.55% | 5,056 | 31.08% | 386 | 2.37% |
| 2008 | 10,737 | 60.06% | 6,756 | 37.79% | 384 | 2.15% |
| 2004 | 11,063 | 64.38% | 6,049 | 35.20% | 72 | 0.42% |
| 2000 | 9,796 | 61.81% | 5,605 | 35.37% | 448 | 2.83% |
| 1996 | 6,916 | 45.89% | 5,954 | 39.51% | 2,201 | 14.60% |
| 1992 | 6,477 | 41.21% | 5,584 | 35.53% | 3,657 | 23.27% |
| 1988 | 8,026 | 58.37% | 5,616 | 40.84% | 109 | 0.79% |
| 1984 | 9,836 | 64.27% | 5,407 | 35.33% | 61 | 0.40% |
| 1980 | 8,812 | 58.35% | 5,472 | 36.24% | 817 | 5.41% |
| 1976 | 8,360 | 54.96% | 6,585 | 43.29% | 265 | 1.74% |
| 1972 | 10,073 | 67.96% | 4,509 | 30.42% | 239 | 1.61% |
| 1968 | 8,077 | 56.00% | 5,341 | 37.03% | 1,005 | 6.97% |
| 1964 | 6,143 | 39.92% | 9,235 | 60.01% | 11 | 0.07% |
| 1960 | 10,307 | 65.04% | 5,506 | 34.74% | 34 | 0.21% |
| 1956 | 10,048 | 66.94% | 4,955 | 33.01% | 8 | 0.05% |
| 1952 | 9,340 | 63.76% | 5,212 | 35.58% | 97 | 0.66% |
| 1948 | 6,866 | 57.94% | 4,984 | 42.06% | 0 | 0.00% |
| 1944 | 8,098 | 60.16% | 5,263 | 39.10% | 99 | 0.74% |
| 1940 | 9,035 | 57.76% | 6,564 | 41.96% | 44 | 0.28% |
| 1936 | 8,477 | 49.32% | 8,412 | 48.94% | 300 | 1.75% |
| 1932 | 5,991 | 46.03% | 6,651 | 51.10% | 373 | 2.87% |
| 1928 | 9,183 | 70.43% | 3,746 | 28.73% | 109 | 0.84% |
| 1924 | 5,913 | 55.27% | 3,642 | 34.04% | 1,143 | 10.68% |
| 1920 | 4,615 | 53.28% | 3,487 | 40.26% | 560 | 6.47% |
| 1916 | 2,595 | 41.07% | 3,269 | 51.74% | 454 | 7.19% |
| 1912 | 916 | 14.63% | 3,079 | 49.17% | 2,267 | 36.20% |
| 1908 | 2,915 | 42.92% | 3,291 | 48.46% | 585 | 8.61% |
| 1904 | 2,978 | 50.95% | 2,466 | 42.19% | 401 | 6.86% |
| 1900 | 3,002 | 44.69% | 3,472 | 51.68% | 244 | 3.63% |
| 1896 | 3,338 | 43.57% | 4,097 | 53.47% | 227 | 2.96% |
| 1892 | 2,543 | 39.23% | 3,746 | 57.79% | 193 | 2.98% |
| 1888 | 2,950 | 41.71% | 3,880 | 54.86% | 243 | 3.44% |
Voter Registration
As of February 21, 2022, there are 23,454 registered voters in Clarion County.[13]
Chart of Voter Registration
- Democratic: 6,247 (26.64%)
- Republican: 14,567 (62.11%)
- Independent: 1,851 (7.89%)
- Third Party: 789 (3.36%)
County Commissioners
- Wayne Brosius; Republican
- Ted Tharan; Republican
- Ed Heasley; Democrat
Other county officials
- Hon. James G. Arner, senior judge, Pennsylvania Courts of Common Pleas
- Hon. Sara Seidle-Patton, president judge, Pennsylvania Courts of Common Pleas
- Duane L. Quinn (18-3-01), district judge
- Timothy P. Schill (18-3-02), district judge
- Jarah L Heeter (18-3-03), district judge
- Jeffery C. Miller (18-3-04), district judge
- Drew Welsh; Republican, District Attorney
- Rex Munsee; Republican, sheriff
- Karyn Montana; Republican, treasurer
State Senate
| District | Senator | Party |
|---|---|---|
| 21 | Scott E. Hutchinson | Republican |
State House of Representatives
| District | Representative | Party |
|---|---|---|
| 63 | Donna Oberlander | Republican |
United States House of Representatives
| District | Representative | Party |
|---|---|---|
| 15 | Glenn Thompson | Republican |
United States Senate
| Senator | Party |
|---|---|
| Pat Toomey | Republican |
| Bob Casey | Democrat |
Education

Colleges and universities
- Clarion University of Pennsylvania
Public school districts
- Allegheny-Clarion Valley School District
- Clarion Area School District
- Clarion-Limestone Area School District
- Karns City Area School District
- Keystone School District
- North Clarion County School District
- Redbank Valley School District
- Union School District
Intermediate unit
Public school districts and private schools in the county are served by Riverview Intermediate Unit IU6 which provides special education and professional development services.
Technical school
Clarion County Career Center is located along State Route 66 in Marianne (Shippenville address).
Private schools
- Alexander Amish School - Venus
- Bear Run School - Knox
- Christs Dominion Academy - Summerville
- Clarion Center School - Clarion
- County Corner - Knox
- Deer View School - Mayport
- Immaculate Conception School - Clarion
- Little Bird Preschool - New Bethlehem
- Meadow View Amish School - Knox
- New Bethlehem Mennonite School - New Bethlehem
- Shady Nook Amish School - Sligo
- St Josephs School - Lucinda
- Zacheral Amish School - Venus
Communities
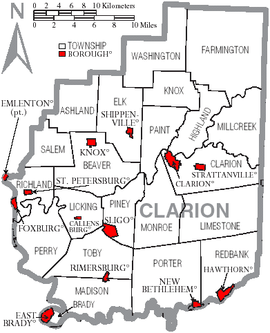
Under Pennsylvania law, there are four types of incorporated municipalities: cities, boroughs, townships, and, in at most two cases, towns. The following boroughs and townships are located in Clarion County:
Boroughs
Townships
Census-designated places
Population ranking
The population ranking of the following table is based on the 2010 census of Clarion County.[14]
† county seat
| Rank | City/town/etc. | Municipal type | Population (2010 Census) |
|---|---|---|---|
| 1 | † Clarion | Borough | 5,276 |
| 2 | Marianne | CDP | 1,167 |
| 3 | Knox | Borough | 1,146 |
| 4 | New Bethlehem | Borough | 989 |
| 5 | Rimersburg | Borough | 951 |
| 6 | East Brady | Borough | 942 |
| 7 | Sligo | Borough | 720 |
| 8 | Strattanville | Borough | 550 |
| 9 | Hawthorn | Borough | 494 |
| 10 | Shippenville | Borough | 480 |
| 11 | St. Petersburg | Borough | 400 |
| 12 | Callensburg | Borough | 207 |
| 13 | Tylersburg | CDP | 196 |
| T-14 | Foxburg | Borough | 183 |
| T-14 | Crown | CDP | 183 |
| 15 | Leeper | CDP | 158 |
| 16 | Vowinckel | CDP | 139 |
Notable people
- Marietta Bones (1842–1901) - suffragist, social reformer, philanthropist
- Fred Caligiuri (1918–2018) - Major League Baseball pitcher (Philadelphia Athletics, 1941, 1942); as of 2018 was the oldest living major-league player; born in Forest County; former resident of Knox and Rimersburg
- Hunter Corbett - pioneer American Presbyterian missionary to China, ministered in China for 56 years
- Jim Kelly - NFL athlete (Buffalo Bills); grew up in East Brady
- Chris Kirkpatrick - musician ('N Sync); born in Clarion
- Dominick Labino - glass artist; born in Fairmount City (Redbank Township); managed the Owens-Illinois glass plant in Clarion
- Ossee Schreckengost - Major League Baseball player; born in New Bethlehem
- Randall Silvis - author and screenwriter; born in Madison Township
- Grace M. Sloan (1902–2001), Pennsylvania state treasurer and auditor general
- Ernest M. Skinner - pipe organ builder, inventor; born in Clarion
- Jane Wolfe - silent film actress and thelemite; born in St. Petersburg
See also
- National Register of Historic Places listings in Clarion County, Pennsylvania
- Oil Creek Library District
References
- "PHMC Historical Markers Search". Pennsylvania Historical and Museum Commission. Commonwealth of Pennsylvania. Archived from the original (Searchable database) on March 21, 2016. Retrieved January 25, 2014.
- "State & County QuickFacts". United States Census Bureau. Archived from the original on June 6, 2011. Retrieved November 16, 2013.
- "Find a County". National Association of Counties. Archived from the original on May 31, 2011. Retrieved June 7, 2011.
- "2010 Census Gazetteer Files". United States Census Bureau. August 22, 2012. Retrieved March 6, 2015.
- "PRISM Climate Group, Oregon State U".
- "U.S. Decennial Census". United States Census Bureau. Retrieved March 6, 2015.
- "Historical Census Browser". University of Virginia Library. Retrieved March 6, 2015.
- Forstall, Richard L., ed. (March 24, 1995). "Population of Counties by Decennial Census: 1900 to 1990". United States Census Bureau. Retrieved March 6, 2015.
- "Census 2000 PHC-T-4. Ranking Tables for Counties: 1990 and 2000" (PDF). United States Census Bureau. April 2, 2001. Archived (PDF) from the original on October 9, 2022. Retrieved March 6, 2015.
- "U.S. Census website". United States Census Bureau. Retrieved January 31, 2008.
- "P2 HISPANIC OR LATINO, AND NOT HISPANIC OR LATINO BY RACE – 2020: DEC Redistricting Data (PL 94-171) – Clarion County, Pennsylvania".
- Leip, David. "Dave Leip's Atlas of U.S. Presidential Elections". uselectionatlas.org. Retrieved November 22, 2018.
- "Voter registration statistics by county". Dos.state.pa.us. Retrieved February 23, 2022.
- "2010 U.S. Census website". United States Census Bureau. Retrieved February 10, 2013.
Municipalities and communities of Clarion County, Pennsylvania, United States | ||
|---|---|---|
County seat: Clarion | ||
| Boroughs |  | |
| Townships | ||
| CDPs | ||
| Unincorporated communities | ||
| Footnotes | ‡This populated place also has portions in an adjacent county or counties | |
| ||
Authority control | |
|---|---|
| General | |
| National libraries | |
| Other |
|
На других языках
[de] Clarion County
Clarion County[1] ist ein County im US-Bundesstaat Pennsylvania der Vereinigten Staaten. Bei der Volkszählung im Jahr 2020 hatte das County 37.241 Einwohner und eine Bevölkerungsdichte von 24 Einwohner pro Quadratkilometer. Der Verwaltungssitz (County Seat) ist Clarion.[2]- [en] Clarion County, Pennsylvania
[ru] Кларион (округ)
Округ Кларион (англ. Clarion County) располагается в штате Пенсильвания, США. Официально образован 11-го марта 1839 года. По состоянию на 2010 год, численность населения составляла 39 988 человек.Другой контент может иметь иную лицензию. Перед использованием материалов сайта WikiSort.org внимательно изучите правила лицензирования конкретных элементов наполнения сайта.
WikiSort.org - проект по пересортировке и дополнению контента Википедии