world.wikisort.org - USA
Burke County is a county located in the U.S. state of North Carolina. As of the 2020 Census, the population was 87,570.[1] Its county seat is Morganton.[2] Burke County is part of the Hickory–Lenoir–Morganton, NC Metropolitan Statistical Area.
Burke County | |
|---|---|
U.S. county | |
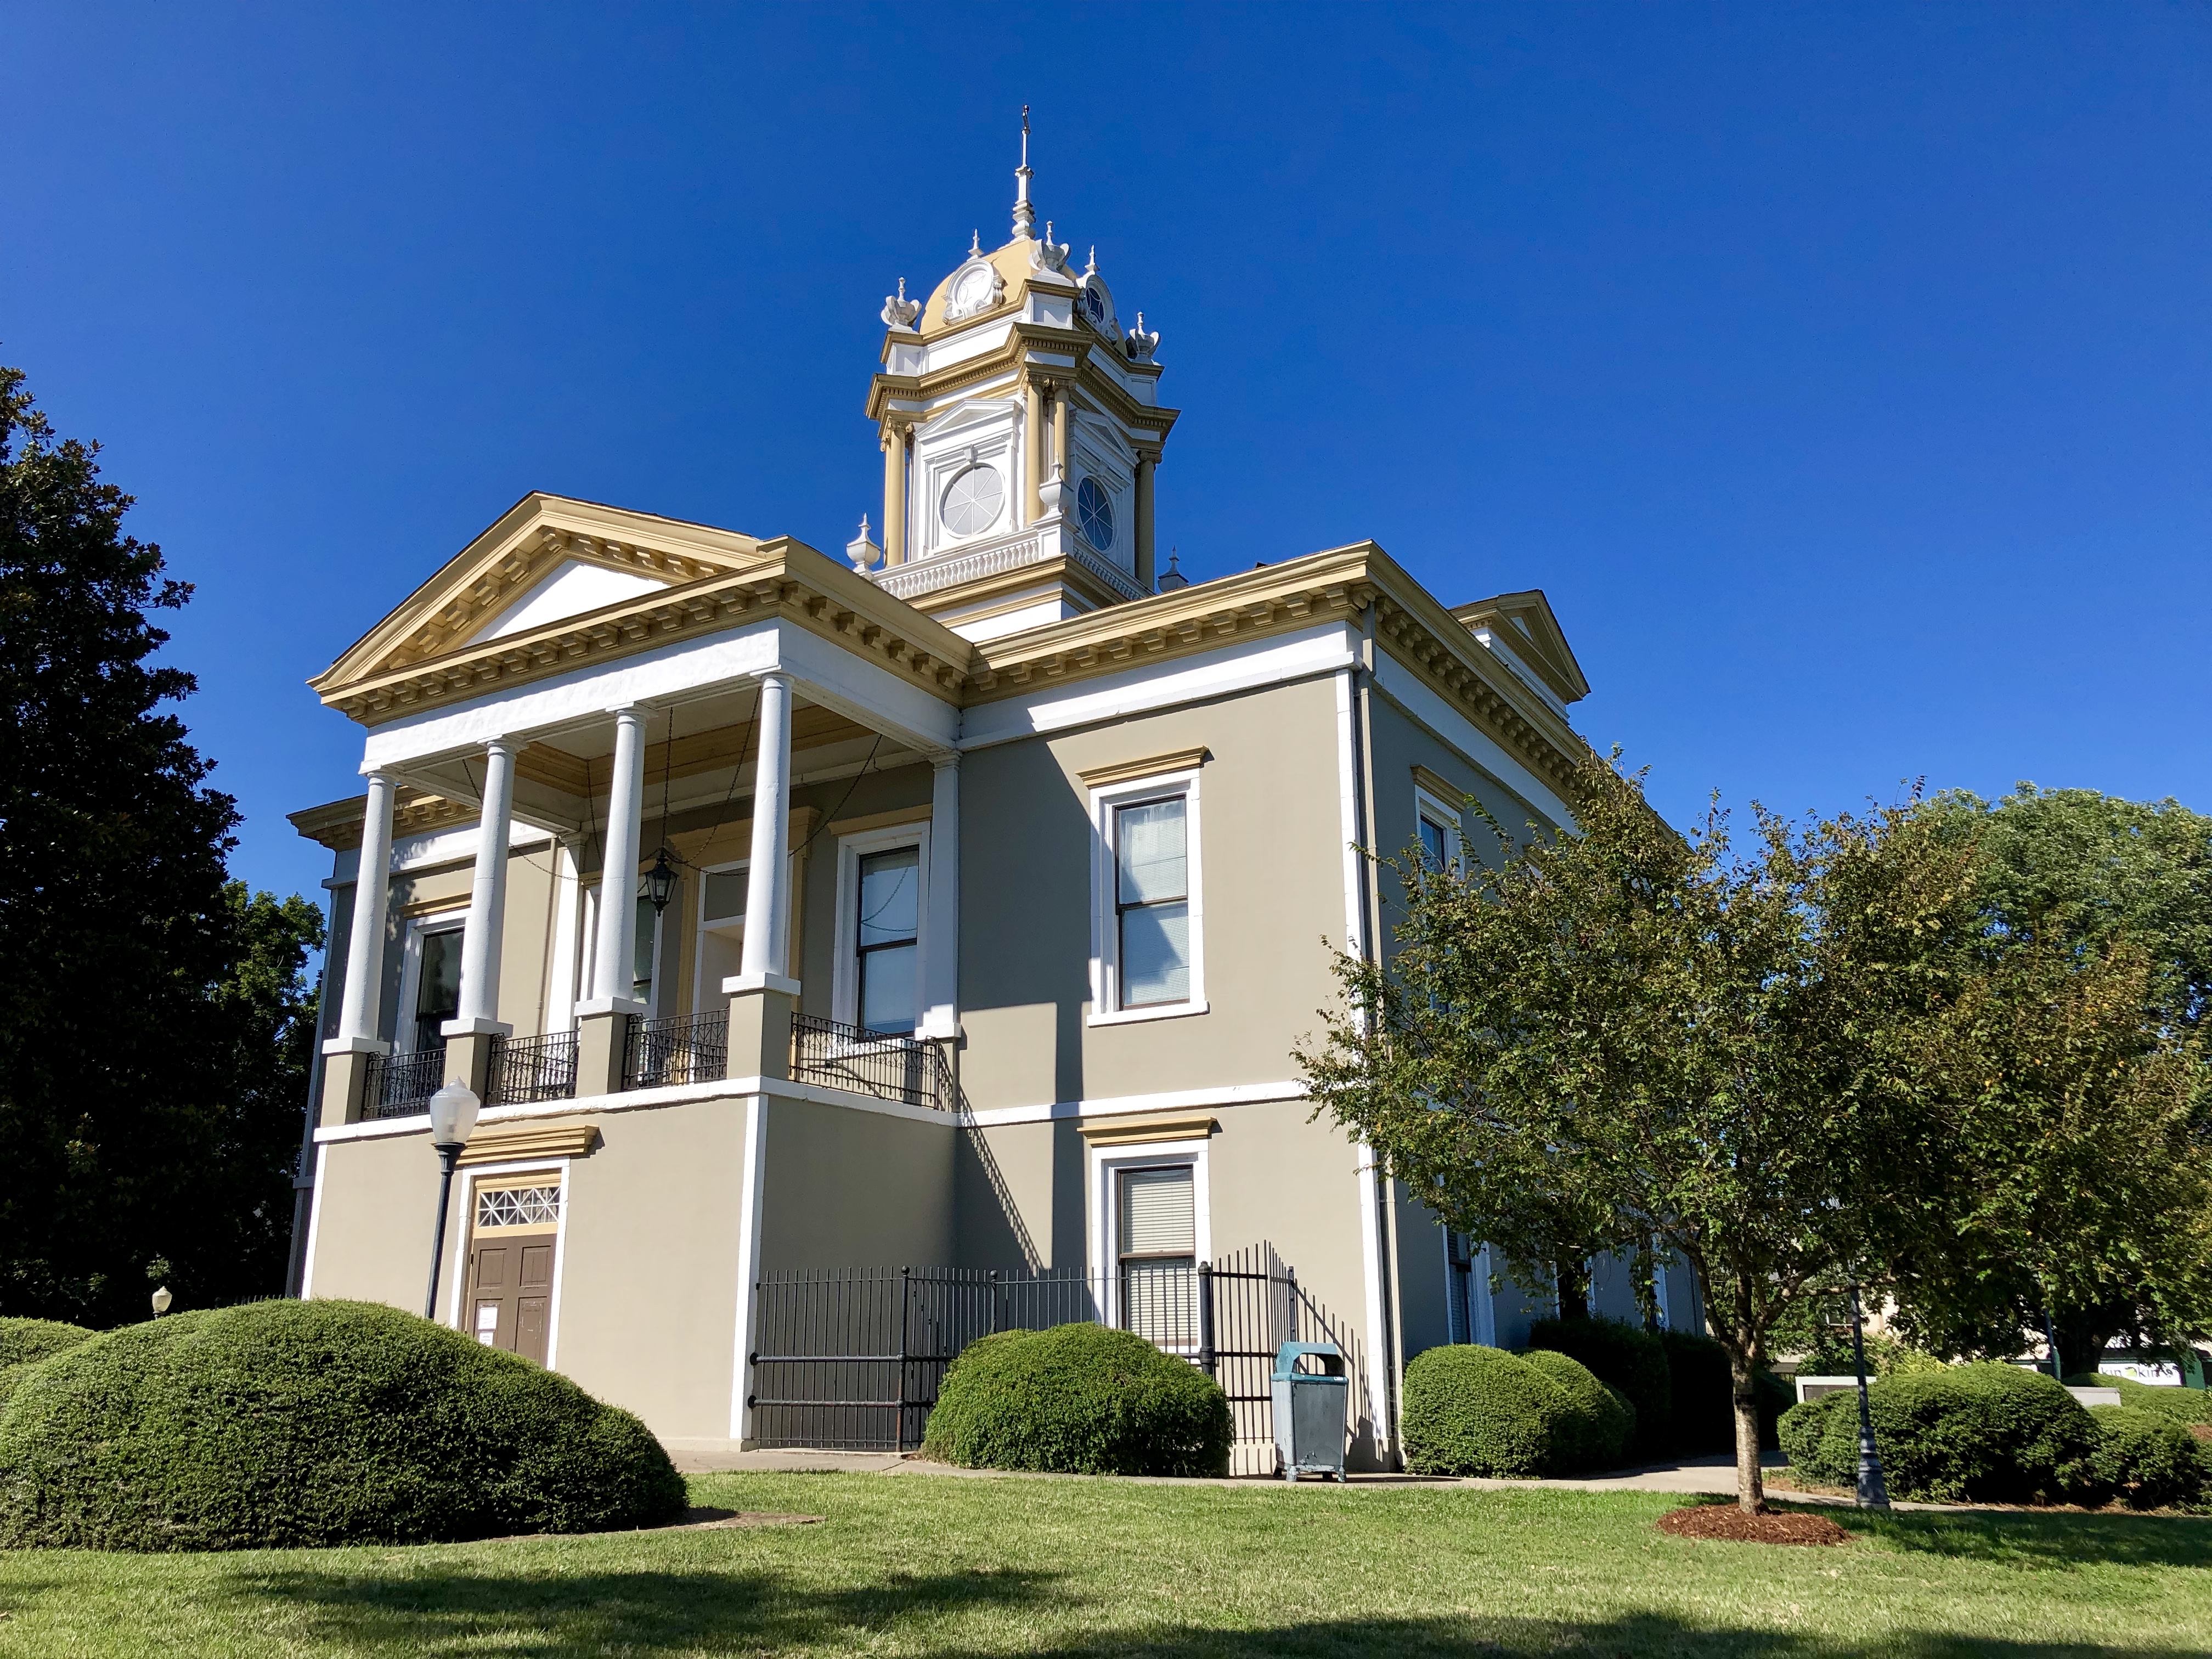 Burke County Courthouse | |
 Seal Logo | |
| Motto: "All About Advancing" | |
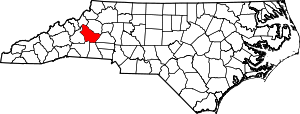 Location within the U.S. state of North Carolina | |
 North Carolina's location within the U.S. | |
| Coordinates: 35°45′N 81°43′W | |
| Country | |
| State | |
| Founded | 1777 |
| Named for | Thomas Burke |
| Seat | Morganton |
| Largest city | Morganton |
| Area | |
| • Total | 515 sq mi (1,330 km2) |
| • Land | 507 sq mi (1,310 km2) |
| • Water | 8.0 sq mi (21 km2) 1.5% |
| Population | |
| • Estimate (2021) | 87,611 |
| • Density | 172.8/sq mi (66.7/km2) |
| Time zone | UTC−5 (Eastern) |
| • Summer (DST) | UTC−4 (EDT) |
| Congressional district | 5th |
| Website | www |
History
Indigenous peoples inhabited the interior as well as the coastal areas for thousands of years. Native Americans of the complex and far-flung Mississippian culture inhabited the county long before Europeans arrived in the New World. They were part of a trade network extending from the Gulf Coast to the Great Lakes. They built earthwork mounds, including at Joara, a 12-acre (49,000 m2) site and regional chiefdom in North Carolina. (Present-day Morganton developed near this site.) It was the center of the largest Native American settlement in North Carolina, dating from about 1000 AD and expanding into the next centuries.[3]
In 1567, the Spanish Juan Pardo expedition arrived and built Fort San Juan at Joara, claiming the area for the colony of Spanish Florida. Pardo renamed the settlement as Cuenca, after his home city.[3] They had been sent by the governor at Santa Elena (Parris Island) in South Carolina to find an overland route to the silver mines in central Mexico, believing that the Appalachians were connected to a range there.
Captain Juan Pardo, leader of the expedition, left about 30 soldiers at the fort while continuing his exploration. His expedition built another five forts to the west, in the foothills of the mountains. In the spring of 1568 the Indians attacked Fort San Juan, killing the soldiers and burning the fort. The natives would kill all soldiers except one at the garrisons, at five other Spanish forts in the interior.[3]
In 1777, during the American Revolutionary War, Burke County was formed from Rowan County. It was named for Thomas Burke, then serving as a delegate to the Continental Congress (1777 to 1781). He was later elected as Governor of North Carolina, serving one term from 1781 to 1782. The western Piedmont was settled by many Scots-Irish and German immigrants in the mid-to-late 18th century. They were generally yeoman farmers and fiercely independent.
As population increased, the county was divided to form other jurisdictions. In 1791, parts of Burke County and Rutherford County were combined to form Buncombe County. In 1833, parts of Burke and Buncombe counties were combined to form Yancey County. In 1841, parts of Burke and Wilkes counties were combined to form Caldwell County. In 1842 additional parts of Burke and Rutherford counties were combined to form McDowell County. Finally, in 1861, parts of Burke, Caldwell, McDowell, Watauga, and Yancey counties were combined to form Mitchell County.
The Burke County Regiment participated in the Battle of Kings Mountain, which pitted Appalachian frontiersmen against the Loyalist forces of the British commander Ferguson at Kings Mountain, SC in the American Revolution. Rather than waiting for Ferguson to invade their territory, militiamen throughout the Blue Ridge crossed over the mountains to meet the enemy and were known as the Over Mountain Men.[4]
It was not until the late 20th century that a record of the 1567 Spanish expedition was discovered and translated into English. In the 1990s, excavation was started at a site believed to be Joara, continuing into the 21st century. In 2013 archeologists announced that they had found remains of Fort San Juan at Joara, confirming early accounts. This has changed knowledge of and interpretation of early European encounters and colonization efforts in what would become the United States, as Spanish efforts preceded the successful efforts of England in Jamestown, Virginia by 40 years.[5]
Geography


According to the U.S. Census Bureau, the county has a total area of 515 square miles (1,330 km2), of which 507 square miles (1,310 km2) is land and 8.0 square miles (21 km2) (1.5%) is water.[6] The county contains portions of two lakes: Lake James along its western border with McDowell County and Lake Rhodhiss along its northeastern border with Caldwell County.
Table Rock, a prominent peak in the county in the east rim of Linville Gorge, part of Pisgah National Forest, has been described as "the most visible symbol in the region".[7]
In the southern part of the county, the South Mountains State Park covers almost 21,000 acres and features waterfalls and hiking trails.
National protected areas
- Blue Ridge Parkway (part)
- Linville Gorge Wilderness (part)
- Pisgah National Forest (part)
State and local protected areas
- Lake James State Park (part)
- South Mountains Game Lands (part)
- South Mountains State Park
Major water bodies
- Canoe Creek
- Catawba River
- Dales Creek
- Drowning Creek
- Hall Creek
- Henry Fork (South Fork Catawba River tributary)
- Irish Creek
- Jacob Fork (South Fork Catawba River tributary)
- Lake James
- Linville River
- Little River
- Old Catawba River
- Pearcey Creek
- Rhodhiss Lake
- Rock Creek
- Roses Creek
- Silver Creek
- Upper Creek
Adjacent counties
- Avery County - northwest
- Caldwell County - north
- Catawba County - east
- Cleveland County - south
- Rutherford County - south
- McDowell County - west
Major highways
 I-40
I-40 US 64
US 64 US 64 Bus.
 US 70
US 70- US 70 Bus.
 US 221
 US 321
 NC 18
NC 18 NC 114
 NC 126
 NC 181
 NC 183
Major infrastructure
- Foothills Regional Airport (partially in Caldwell County)
- Hickory Regional Airport (partially in Catawba County)
Demographics
| Historical population | |||
|---|---|---|---|
| Census | Pop. | %± | |
| 1790 | 8,106 | — | |
| 1800 | 9,929 | 22.5% | |
| 1810 | 11,007 | 10.9% | |
| 1820 | 13,411 | 21.8% | |
| 1830 | 17,888 | 33.4% | |
| 1840 | 15,799 | −11.7% | |
| 1850 | 7,772 | −50.8% | |
| 1860 | 9,237 | 18.8% | |
| 1870 | 9,777 | 5.8% | |
| 1880 | 12,809 | 31.0% | |
| 1890 | 14,939 | 16.6% | |
| 1900 | 17,699 | 18.5% | |
| 1910 | 21,408 | 21.0% | |
| 1920 | 23,297 | 8.8% | |
| 1930 | 29,410 | 26.2% | |
| 1940 | 38,615 | 31.3% | |
| 1950 | 45,518 | 17.9% | |
| 1960 | 52,701 | 15.8% | |
| 1970 | 60,364 | 14.5% | |
| 1980 | 72,504 | 20.1% | |
| 1990 | 75,744 | 4.5% | |
| 2000 | 89,148 | 17.7% | |
| 2010 | 90,912 | 2.0% | |
| 2020 | 87,570 | −3.7% | |
| 2021 (est.) | 87,611 | [8] | 0.0% |
| U.S. Decennial Census[9] 1790–1960[10] 1900–1990[11] 1990–2000[12] 2010–2014[13] 2020[14] | |||
2020 census
| Race | Number | Percentage |
|---|---|---|
| White (non-Hispanic) | 68,664 | 78.41% |
| Black or African American (non-Hispanic) | 4,762 | 5.44% |
| Native American | 238 | 0.27% |
| Asian | 3,150 | 3.6% |
| Pacific Islander | 64 | 0.07% |
| Other/Mixed | 3,508 | 4.01% |
| Hispanic or Latino | 7,184 | 8.2% |
As of the 2020 United States census, there were 87,570 people, 36,634 households, and 25,391 families residing in the county.
2000 census
As of the census[16] of 2000, there were 89,148 people, 34,528 households, and 24,342 families residing in the county. The population density was 176 people per square mile (68/km2). There were 37,427 housing units at an average density of 74 per square mile (29/km2). The racial makeup of the county was 86.01% White, 6.71% Black or African American, 0.30% Native American, 3.48% Asian, 0.21% Pacific Islander, 2.17% from other races, and 1.11% from two or more races. 3.57% of the population were Hispanic or Latino of any race.
There were 34,528 households, out of which 31.00% had children under the age of 18 living with them, 54.90% were married couples living together, 11.00% had a female householder with no husband present, and 29.50% were non-families. 25.50% of all households were made up of individuals, and 9.90% had someone living alone who was 65 years of age or older. The average household size was 2.48 and the average family size was 2.94.
In the county, the population was spread out, with 24.00% under the age of 18, 8.90% from 18 to 24, 29.60% from 25 to 44, 24.00% from 45 to 64, and 13.40% who were 65 years of age or older. The median age was 37 years. For every 100 females there were 100.00 males. For every 100 females age 18 and over, there were 97.70 males.
The median income for a household in the county was $35,629, and the median income for a family was $42,114. Males had a median income of $27,591 versus $21,993 for females. The per capita income for the county was $17,397. About 8.00% of families and 10.70% of the population were below the poverty line, including 13.60% of those under age 18 and 12.50% of those age 65 or over.
Government and politics
Burke County leans heavily Republican in Presidential elections. The last Democrat to carry the county was Jimmy Carter in 1976. Lyndon Johnson, who won the county as a Democrat in 1964, was the only other one to do so since World War II. However, as late as the 1990s, Democratic presidential candidates have managed to garner 40 percent of the county's vote. As was typical for all of the South outside the Appalachian highlands and a few stronghold Republican counties, Burke County was mostly solidly Democratic before WWII.
| Year | Republican | Democratic | Third party | |||
|---|---|---|---|---|---|---|
| No. | % | No. | % | No. | % | |
| 2020 | 31,019 | 69.55% | 13,118 | 29.41% | 465 | 1.04% |
| 2016 | 26,238 | 67.42% | 11,251 | 28.91% | 1,431 | 3.68% |
| 2012 | 22,267 | 60.93% | 13,701 | 37.49% | 576 | 1.58% |
| 2008 | 22,102 | 59.03% | 14,901 | 39.80% | 440 | 1.18% |
| 2004 | 18,922 | 61.51% | 11,728 | 38.12% | 112 | 0.36% |
| 2000 | 18,466 | 60.23% | 11,924 | 38.89% | 268 | 0.87% |
| 1996 | 13,853 | 48.97% | 11,678 | 41.28% | 2,760 | 9.76% |
| 1992 | 13,397 | 44.48% | 12,565 | 41.71% | 4,160 | 13.81% |
| 1988 | 15,933 | 59.41% | 10,848 | 40.45% | 38 | 0.14% |
| 1984 | 18,766 | 64.32% | 10,353 | 35.48% | 59 | 0.20% |
| 1980 | 12,956 | 50.97% | 11,680 | 45.95% | 781 | 3.07% |
| 1976 | 10,070 | 41.22% | 14,254 | 58.34% | 107 | 0.44% |
| 1972 | 14,447 | 68.96% | 6,197 | 29.58% | 306 | 1.46% |
| 1968 | 11,068 | 48.84% | 5,704 | 25.17% | 5,892 | 26.00% |
| 1964 | 10,081 | 44.03% | 12,815 | 55.97% | 0 | 0.00% |
| 1960 | 12,925 | 56.34% | 10,015 | 43.66% | 0 | 0.00% |
| 1956 | 11,823 | 59.65% | 7,999 | 40.35% | 0 | 0.00% |
| 1952 | 11,113 | 58.97% | 7,732 | 41.03% | 0 | 0.00% |
| 1948 | 6,374 | 47.26% | 6,226 | 46.16% | 888 | 6.58% |
| 1944 | 5,855 | 46.28% | 6,795 | 53.72% | 0 | 0.00% |
| 1940 | 4,889 | 40.30% | 7,242 | 59.70% | 0 | 0.00% |
| 1936 | 5,506 | 42.48% | 7,454 | 57.52% | 0 | 0.00% |
| 1932 | 4,823 | 44.92% | 5,866 | 54.64% | 47 | 0.44% |
| 1928 | 5,108 | 63.94% | 2,881 | 36.06% | 0 | 0.00% |
| 1924 | 3,190 | 43.54% | 4,137 | 56.46% | 0 | 0.00% |
| 1920 | 3,592 | 52.41% | 3,262 | 47.59% | 0 | 0.00% |
| 1916 | 1,474 | 47.63% | 1,621 | 52.37% | 0 | 0.00% |
| 1912 | 48 | 1.78% | 1,365 | 50.54% | 1,288 | 47.69% |
In the North Carolina Senate, Burke County lies within the 46th Senate District, which also covers Cleveland County and is represented by Republican Senator Warren Daniel. In the North Carolina House of Representatives, the northern two-thirds of Burke County comprises the 86th District represented by Republican Hugh Blackwell. The southern third lies within the 112nd District, which also covers Rutherford County and is represented by Republican David Rogers.
Burke County is a member of the regional Western Piedmont Council of Governments. The county is governed by a five-member Board of Commissioners, elected to serve four-year terms.[18]
Communities
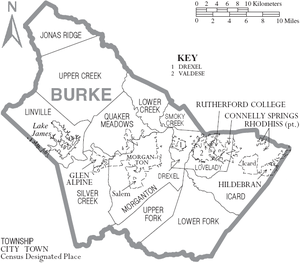
City
- Morganton (county seat and largest city)
Towns
Townships
- Drexel
- Icard
- Jonas Ridge
- Linville
- Lovelady
- Lower Creek
- Lower Fork
- Quaker Meadows
- Silver Creek
- Smoky Creek
- Upper Creek
- Upper Fork
- Hildebran
- Connelly Springs
- Rutherford College
- Valdese
Census-designated places
Unincorporated communities
- Jonas Ridge
- Linville Falls
- Petersburg
In popular culture
Although never explicitly mentioned by name in the novel, the hideout of Robur-the villain in Jules Verne's Master of the World-is thought to be Table Rock mountain in Burke County.
Many scenes from the 1992 film Last of the Mohicans were filmed in Burke County. A full-scale fort was built next to the Linville boat access on Lake James for the filming. The fort was later destroyed and the land replanted with trees. Many of the extras who played settlers, British soldiers, and Native Americans were locals from Burke and surrounding counties.
The final scene from The Hunt for Red October had the backdrop filmed on Lake James, while the actors stayed in Hollywood
In 2011, scenes for the Lionsgate adaptation of The Hunger Games were filmed near Hildebran, North Carolina at the Henry River Mill Village.
See also
- List of counties in North Carolina
- National Register of Historic Places listings in Burke County, North Carolina
- Burke County Regiment of the Salisbury District Brigade
- North Carolina State Parks
- National Park Service
- List of national forests of the United States
References
- "U.S. Census Bureau QuickFacts: Burke County, North Carolina". www.census.gov. Retrieved May 3, 2022.
- "Find a County". National Association of Counties. Archived from the original on May 31, 2011. Retrieved June 7, 2011.
- David Moore, Robin Beck, and Christopher Rodning, "In Search of Fort San Juan: Sixteenth Century Spanish and Native Interaction in the North Carolina Piedmont" Archived June 17, 2009, at the Wayback Machine, Warren Wilson College Archaeology Home Page, 2004, accessed June 26, 2008
- (Clark, "Burke County," pp. 37–39)
- John Noble Wilford, "Fort Tells of Spain’s Early Ambitions", New York Times, 22 July 2013, accessed 22 July 2013
- "2010 Census Gazetteer Files". United States Census Bureau. August 22, 2012. Archived from the original on January 12, 2015. Retrieved January 12, 2015.
- Clark, Larry (2007). Burke County, North Carolina: Historic Tales from the Gateway to the Blue Ridge. The History Press. pp. 11–12. ISBN 1-59629-323-3.
- "U.S. Census Bureau QuickFacts: Burke County, North Carolina". www.census.gov. Retrieved May 31, 2022.
- "U.S. Decennial Census". United States Census Bureau. Retrieved January 12, 2015.
- "Historical Census Browser". University of Virginia Library. Retrieved January 12, 2015.
- Forstall, Richard L., ed. (March 27, 1995). "Population of Counties by Decennial Census: 1900 to 1990". United States Census Bureau. Retrieved January 12, 2015.
- "Census 2000 PHC-T-4. Ranking Tables for Counties: 1990 and 2000" (PDF). United States Census Bureau. April 2, 2001. Archived (PDF) from the original on March 27, 2010. Retrieved January 12, 2015.
- "State & County QuickFacts". United States Census Bureau. Archived from the original on June 6, 2011. Retrieved October 17, 2013.
- "U.S. Census Bureau QuickFacts: Burke County, North Carolina". www.census.gov. Retrieved May 31, 2022.
- "Explore Census Data". data.census.gov. Retrieved December 21, 2021.
- "U.S. Census website". United States Census Bureau. Retrieved January 31, 2008.
- Leip, David. "Dave Leip's Atlas of U.S. Presidential Elections". uselectionatlas.org. Retrieved March 14, 2018.
- "Burke County Board of Commissioners". Archived from the original on July 3, 2017. Retrieved May 30, 2017.
External links
![]() Geographic data related to Burke County, North Carolina at OpenStreetMap
Geographic data related to Burke County, North Carolina at OpenStreetMap
Places adjacent to Burke County, North Carolina | ||||||||||||||||
|---|---|---|---|---|---|---|---|---|---|---|---|---|---|---|---|---|
| ||||||||||||||||
Municipalities and communities of Burke County, North Carolina, United States | ||
|---|---|---|
County seat: Morganton | ||
| Cities |  | |
| Towns | ||
| CDPs | ||
| Unincorporated communities |
| |
| Footnotes | ‡This populated place also has portions in an adjacent county or counties | |
| ||
Authority control | |
|---|---|
| General | |
| National libraries | |
| Other |
|
На других языках
[de] Burke County (North Carolina)
Burke County[1] ist ein County im Bundesstaat North Carolina der Vereinigten Staaten. Der Verwaltungssitz (County Seat) ist Morganton am Catawba River, das nach Daniel Morgan benannt wurde, einem General im Amerikanischen Unabhängigkeitskrieg.- [en] Burke County, North Carolina
[fr] Comté de Burke (Caroline du Nord)
Le comté de Burke est un des comtés situé dans l'État de Caroline du Nord aux États-Unis. En 2010, sa population est de 90 912 habitants. Son siège est la ville de Morganton.[it] Contea di Burke (Carolina del Nord)
La contea di Burke, in inglese Burke County, è una contea dello Stato della Carolina del Nord, negli Stati Uniti. La popolazione al censimento del 2000 era di 89.148 abitanti. Il capoluogo di contea è Morganton.[ru] Берк (округ, Северная Каролина)
Округ Берк (англ. Burke County) располагается в штате Северная Каролина, США. Официально образован в 1777 году. По состоянию на 2010 год, численность населения составляла 90 912 человек.Другой контент может иметь иную лицензию. Перед использованием материалов сайта WikiSort.org внимательно изучите правила лицензирования конкретных элементов наполнения сайта.
WikiSort.org - проект по пересортировке и дополнению контента Википедии