world.wikisort.org - USA
Traverse County (locally /ˈtrævərs/ TRAV-ərss) is a county in the U.S. state of Minnesota. As of the 2020 census, the population was 3,360,[2] making it the least-populous county in Minnesota. Its county seat is Wheaton.[3] The county was founded in 1862 and organized in 1881.[4]
Traverse County | |
|---|---|
U.S. county | |
 Old District No. 44 School | |
 Location within the U.S. state of Minnesota | |
 Minnesota's location within the U.S. | |
| Coordinates: 45°46′N 96°28′W | |
| Country | |
| State | |
| Founded | February 20, 1862 (created) 1881 (organized) |
| Named for | Lake Traverse[1] |
| Seat | Wheaton |
| Largest city | Wheaton |
| Area | |
| • Total | 586 sq mi (1,520 km2) |
| • Land | 574 sq mi (1,490 km2) |
| • Water | 12 sq mi (30 km2) 2.0%% |
| Population (2020) | |
| • Total | 3,360 |
| • Estimate (2021) | 3,286 |
| • Density | 5.9/sq mi (2.3/km2) |
| Time zone | UTC−6 (Central) |
| • Summer (DST) | UTC−5 (CDT) |
| Congressional district | 7th |
| Website | www |
Geography
Traverse County lies on the western edge of Minnesota. Its western border abuts the eastern borders of the states of North and South Dakota. The Red River flows northward along the county's western line. The Mustinka River flows southwestward through the county's upper portion, discharging into Lake Traverse. The county terrain consists of low rolling hills, fully devoted to agriculture except in developed areas.[5] The terrain slopes to the west and north, with its highest point at the southeastern corner, at 1,119' (341m) ASL.[6] The county has a total area of 586 square miles (1,520 km2), of which 574 square miles (1,490 km2) is land and 12 square miles (31 km2) (2.0%) is water.[7]
![Soils of Traverse County[8]](http://upload.wikimedia.org/wikipedia/commons/thumb/e/ec/Traverse_Co_Pie_Chart_No_Text_Version.pdf/page1-220px-Traverse_Co_Pie_Chart_No_Text_Version.pdf.jpg)
Major highways
 U.S. Route 75
 Minnesota State Highway 9
 Minnesota State Highway 27
 Minnesota State Highway 28
 Minnesota State Highway 117
Adjacent counties
- Wilkin County - north
- Grant County - northeast
- Stevens County - southeast
- Big Stone County - south
- Roberts County, South Dakota - southwest
- Richland County, North Dakota northwest
Protected areas
- Reservation Dam State Wildlife Management Area
- White Rock Dam State Wildlife Management Area
Lakes[5]
- Lake Traverse (part)
- Mud Lake - (part)
- Saint Marys Lake
- Wet Lake
Demographics
| Historical population | |||
|---|---|---|---|
| Census | Pop. | %± | |
| 1870 | 13 | — | |
| 1880 | 1,507 | 11,492.3% | |
| 1890 | 4,516 | 199.7% | |
| 1900 | 7,573 | 67.7% | |
| 1910 | 8,049 | 6.3% | |
| 1920 | 7,943 | −1.3% | |
| 1930 | 7,938 | −0.1% | |
| 1940 | 8,283 | 4.3% | |
| 1950 | 8,053 | −2.8% | |
| 1960 | 7,503 | −6.8% | |
| 1970 | 6,254 | −16.6% | |
| 1980 | 5,542 | −11.4% | |
| 1990 | 4,463 | −19.5% | |
| 2000 | 4,134 | −7.4% | |
| 2010 | 3,558 | −13.9% | |
| 2020 | 3,360 | −5.6% | |
| 2021 (est.) | 3,286 | [9] | −2.2% |
| U.S. Decennial Census[10] 1790-1960[11] 1900-1990[12] 1990-2000[13] 2010-2020[2] | |||

2000 census
As of the 2000 census, there were 4,134 people, 1,717 households, and 1,129 families in the county. The population density was 7.2/sqmi (2.78/km2). There were 2,199 housing units at an average density of 3.83/sqmi (1.48/km2). The racial makeup of the county was 96.42% White, 0.02% Black or African American, 2.81% Native American, 0.27% Asian, 0.07% Pacific Islander, 0.05% from other races, and 0.36% from two or more races. 1.21% of the population were Hispanic or Latino of any race. 52.2% were of German, 13.0% Norwegian, 7.6% Swedish and 5.4% Irish ancestry.
There were 1,717 households, out of which 28.30% had children under the age of 18 living with them, 57.00% were married couples living together, 6.00% had a female householder with no husband present, and 34.20% were non-families. 32.00% of all households were made up of individuals, and 19.20% had someone living alone who was 65 years of age or older. The average household size was 2.34 and the average family size was 2.97.
The county population contained 25.30% under the age of 18, 5.60% from 18 to 24, 21.70% from 25 to 44, 21.20% from 45 to 64, and 26.20% who were 65 years of age or older. The median age was 43 years. For every 100 females there were 96.70 males. For every 100 females age 18 and over, there were 93.80 males.
The median income for a household in the county was $30,617, and the median income for a family was $39,655. Males had a median income of $29,821 versus $20,100 for females. The per capita income for the county was $16,378. About 9.30% of families and 12.00% of the population were below the poverty line, including 13.10% of those under age 18 and 10.80% of those age 65 or over.
2020 Census
| Race | Num. | Perc. |
|---|---|---|
| White (NH) | 2,851 | 84.85% |
| Black or African American (NH) | 21 | 0.63% |
| Native American (NH) | 183 | 5.45% |
| Asian (NH) | 0 | 0% |
| Pacific Islander (NH) | 0 | 0% |
| Other/Mixed (NH) | 108 | 3.21% |
| Hispanic or Latino | 197 | 5.86% |
Communities
Cities
- Browns Valley
- Dumont
- Tintah
- Wheaton (county seat)
Unincorporated communities
- Boisberg
- Charlesville (partial)
- Collis
- Dakomin
Townships
Government and Politics
Traverse County has a balanced electorate. Since 1980 the county has selected the Republican Party candidate 50% of the time in national elections (as of 2020).
| Year | Republican | Democratic | Third party | |||
|---|---|---|---|---|---|---|
| No. | % | No. | % | No. | % | |
| 2020 | 1,172 | 62.88% | 661 | 35.46% | 31 | 1.66% |
| 2016 | 1,049 | 58.34% | 630 | 35.04% | 119 | 6.62% |
| 2012 | 861 | 46.62% | 943 | 51.06% | 43 | 2.33% |
| 2008 | 933 | 45.85% | 1,043 | 51.25% | 59 | 2.90% |
| 2004 | 1,076 | 50.26% | 1,026 | 47.92% | 39 | 1.82% |
| 2000 | 1,074 | 51.00% | 884 | 41.98% | 148 | 7.03% |
| 1996 | 775 | 34.77% | 1,135 | 50.92% | 319 | 14.31% |
| 1992 | 841 | 33.86% | 1,053 | 42.39% | 590 | 23.75% |
| 1988 | 1,061 | 42.85% | 1,399 | 56.50% | 16 | 0.65% |
| 1984 | 1,399 | 51.00% | 1,325 | 48.30% | 19 | 0.69% |
| 1980 | 1,574 | 51.95% | 1,258 | 41.52% | 198 | 6.53% |
| 1976 | 1,130 | 35.24% | 2,020 | 62.99% | 57 | 1.78% |
| 1972 | 1,276 | 41.77% | 1,744 | 57.09% | 35 | 1.15% |
| 1968 | 1,277 | 41.41% | 1,669 | 54.12% | 138 | 4.47% |
| 1964 | 1,073 | 32.30% | 2,247 | 67.64% | 2 | 0.06% |
| 1960 | 1,463 | 40.75% | 2,122 | 59.11% | 5 | 0.14% |
| 1956 | 1,467 | 45.87% | 1,724 | 53.91% | 7 | 0.22% |
| 1952 | 1,809 | 50.63% | 1,756 | 49.15% | 8 | 0.22% |
| 1948 | 1,008 | 31.28% | 2,151 | 66.74% | 64 | 1.99% |
| 1944 | 1,296 | 42.76% | 1,721 | 56.78% | 14 | 0.46% |
| 1940 | 1,434 | 40.50% | 2,094 | 59.14% | 13 | 0.37% |
| 1936 | 761 | 24.20% | 2,297 | 73.06% | 86 | 2.74% |
| 1932 | 608 | 18.53% | 2,633 | 80.23% | 41 | 1.25% |
| 1928 | 1,214 | 38.79% | 1,899 | 60.67% | 17 | 0.54% |
| 1924 | 1,002 | 39.32% | 202 | 7.93% | 1,344 | 52.75% |
| 1920 | 1,759 | 73.20% | 550 | 22.89% | 94 | 3.91% |
| 1916 | 774 | 48.71% | 779 | 49.02% | 36 | 2.27% |
| 1912 | 131 | 10.34% | 561 | 44.28% | 575 | 45.38% |
| 1908 | 685 | 54.93% | 514 | 41.22% | 48 | 3.85% |
| 1904 | 885 | 77.50% | 247 | 21.63% | 10 | 0.88% |
| 1900 | 768 | 50.29% | 720 | 47.15% | 39 | 2.55% |
| 1896 | 589 | 36.65% | 963 | 59.93% | 55 | 3.42% |
| 1892 | 413 | 39.33% | 317 | 30.19% | 320 | 30.48% |
| Position | Name | District | |
|---|---|---|---|
| Commissioner | Todd Johnson | District 1 | |
| Commissioner | Kayla Schmidt | District 2 | |
| Commissioner | Mark Gail | District 3 | |
| Commissioner and Chairperson | David Salberg | District 4 | |
| Commissioner | Vacant | District 5 | |
| Position | Name | Affiliation | District | |
|---|---|---|---|---|
| Senate | Torrey Westrom[17] | Republican | District 12 | |
| House of Representatives | Jeff Backer[18] | Republican | District 12A | |
| Position | Name | Affiliation | District | |
|---|---|---|---|---|
| House of Representatives | Michelle Fischbach | Republican | 7th | |
| Senate | Amy Klobuchar[19] | Democrat | N/A | |
| Senate | Tina Smith[20] | Democrat | N/A | |
See also
- National Register of Historic Places listings in Traverse County, Minnesota
References
- Upham, Warren (1920). Minnesota Geographic Names: Their Origin and Historic Significance. Minnesota Historical Society. p. 550.
- "U.S. Census Bureau QuickFacts: Traverse County, Minnesota". www.census.gov. United States Census Bureau. Retrieved April 1, 2022.
- "Find a County". National Association of Counties. Retrieved June 7, 2011.
- "Minnesota Place Names". Minnesota Historical Society. Retrieved March 19, 2014.
- Traverse County MN Google Maps (accessed April 2, 2019)
- "Find an Altitude/Traverse County MN" Google Maps (accessed April 2, 2019)
- "2010 Census Gazetteer Files". United States Census Bureau. August 22, 2012. Archived from the original on October 6, 2014. Retrieved October 25, 2014.
- Nelson, Steven (2011). Savanna Soils of Minnesota. Minnesota: Self. pp. 65-67. ISBN 978-0-615-50320-2.
- "Annual Estimates of the Resident Population for Counties: April 1, 2020 to July 1, 2021". Retrieved April 1, 2022.
- "U.S. Decennial Census". United States Census Bureau. Retrieved October 25, 2014.
- "Historical Census Browser". University of Virginia Library. Retrieved October 25, 2014.
- "Population of Counties by Decennial Census: 1900 to 1990". United States Census Bureau. Retrieved October 25, 2014.
- "Census 2000 PHC-T-4. Ranking Tables for Counties: 1990 and 2000" (PDF). United States Census Bureau. Retrieved October 25, 2014.
- "P2 HISPANIC OR LATINO, AND NOT HISPANIC OR LATINO BY RACE – 2020: DEC Redistricting Data (PL 94-171) – Traverse County, Minnesota".
- Leip, David. "Atlas of US Presidential Elections". uselectionatlas.org. Retrieved October 10, 2018.
- "County Commissioners | Traverse County, Minnesota". Retrieved June 25, 2020.
- "MN State Senate". www.senate.mn. Retrieved June 24, 2020.
- "Rep. Jeff Backer (12A) - Minnesota House of Representatives". www.house.leg.state.mn.us. Retrieved June 24, 2020.
- "U.S. Senator Amy Klobuchar". www.klobuchar.senate.gov. Retrieved June 24, 2020.
- "Home". Senator Tina Smith. Retrieved June 24, 2020.
Places adjacent to Traverse County, Minnesota | ||||||||||||||||
|---|---|---|---|---|---|---|---|---|---|---|---|---|---|---|---|---|
| ||||||||||||||||
Municipalities and communities of Traverse County, Minnesota, United States | ||
|---|---|---|
County seat: Wheaton | ||
| Cities | 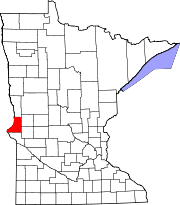 | |
| Townships | ||
| Unincorporated communities | ||
| Footnotes | ‡This populated place also has portions in an adjacent county or counties | |
| ||
Authority control | |
|---|---|
| General | |
| National libraries | |
| Other | |
На других языках
[de] Traverse County
Das Traverse County[1] ist ein County im US-amerikanischen Bundesstaat Minnesota. Im Jahr 2010 hatte das County 3558 Einwohner und eine Bevölkerungsdichte von 2,4 Einwohnern pro Quadratkilometer.[2] Der Verwaltungssitz (County Seat) ist Wheaton.[3]- [en] Traverse County, Minnesota
[ru] Траверс (округ)
Траверс (англ. Traverse County) — округ в штате Миннесота, США. Столица и крупнейший город — Уитон. По переписи 2000 года в округе проживают 4134 человека. Площадь — 1518 км², из которых 1511,3 км² — суша, а 6,68 км² — вода. Плотность населения составляет 3 чел./км².Другой контент может иметь иную лицензию. Перед использованием материалов сайта WikiSort.org внимательно изучите правила лицензирования конкретных элементов наполнения сайта.
WikiSort.org - проект по пересортировке и дополнению контента Википедии