world.wikisort.org - USA
Polk County is a county in the northwestern part of the U.S. state of Minnesota. Its population was 31,192 at the 2020 census.[1] Its county seat is Crookston,[2] and the largest community is East Grand Forks.
Polk County | |
|---|---|
U.S. county | |
 Polk County Government Center in Crookston | |
 Location within the U.S. state of Minnesota | |
 Minnesota's location within the U.S. | |
| Coordinates: 47°46′N 96°24′W | |
| Country | |
| State | |
| Founded | July 20, 1858 (created) 1872 (organized) |
| Named for | James Knox Polk |
| Seat | Crookston |
| Largest city | East Grand Forks |
| Area | |
| • Total | 1,998 sq mi (5,170 km2) |
| • Land | 1,971 sq mi (5,100 km2) |
| • Water | 27 sq mi (70 km2) 1.3% |
| Population (2020) | |
| • Total | 31,192 |
| • Estimate (2021) | 30,757 |
| • Density | 15.8/sq mi (6.1/km2) |
| Time zone | UTC−6 (Central) |
| • Summer (DST) | UTC−5 (CDT) |
| Congressional district | 7th |
| Website | www |
Polk County is part of the Grand Forks, ND-MN metropolitan statistical area.
History
In one of its early acts as a state entity, the Minnesota Legislature created the county on July 20, 1858, but did not organize it at that time. The county was named for the 11th president of the United States, James Knox Polk, who signed the congressional act that organized the Minnesota Territory. The county was organized in 1872 and 1873, with the newly settled community of Crookston as the county seat.[3]
Geography
Polk County lies on Minnesota's border with North Dakota (across the Red River). The Red Lake River flows west through the upper central part of the county, discharging into the Red at Grand Forks. The county terrain consists of low, rolling hills, devoted to agriculture.[4] The county slopes to the west and north, with its highest point near its southeast corner, at 1,519 ft (463 m) above sea level.[5] The county has an area of 1,998 square miles (5,170 km2), of which 27 square miles (70 km2) (1.3%) is covered by water.[6]
![Soils of Polk County[7]](http://upload.wikimedia.org/wikipedia/commons/thumb/8/88/Polk_Co_Pie_Chart_No_Text_Version.pdf/page1-220px-Polk_Co_Pie_Chart_No_Text_Version.pdf.jpg)
USGS surveys show the county's high point to be 1575 ft, 1 km south of U.S. 2, about 2 km east of Spring Lake, at 47.5197°N, 95.5906°W.
Major highways
 U.S. Highway 2
 U.S. Highway 59
 U.S. Highway 75
 Minnesota State Highway 9
 Minnesota State Highway 32
 Minnesota State Highway 92
 Minnesota State Highway 102
 Minnesota State Highway 220
 Polk County State-Aid Highway 21: This is the major connector between Grand Forks and Pennington County, and connects with Pennington County State-Aid Highway 3.
 Polk County State-Aid Highway 9: A major connector between Crookston and the south end of Grand Forks, it connects with Grand Forks County Road 7, and functions as a southside connector between US 75 and US 2 in Crookston.
 Polk County State-Aid Highways 11 & 46: US 2 Truck Bypass of Crookston
 Polk County State-Aid Highway 2: Designated and designed for heavy truck traffic connecting US 2 to Roseau County and Marshall County.
Adjacent counties
- Marshall County (north)
- Pennington County (northeast)
- Red Lake County (northeast)
- Clearwater County (east)
- Mahnomen County (southeast)
- Norman County (south)
- Traill County, North Dakota (southwest)
- Grand Forks County, North Dakota (west)
Protected areas[4]
- Agassiz Dunes Scientific and Natural Area (part)
- Belgium State Wildlife Management Area
- Brandsvold State Wildlife Management Area
- Castor State Wildlife Management Area
- Enerson State Wildlife Management Area
- Erskine State Wildlife Management Area
- Glacial Ridge National Wildlife Refuge
- Gully Fen Scientific and Natural Area
- Hangaard State Wildlife Management Area
- Hasselton State Wildlife Management Area (part)
- Hill River State Wildlife Management Area
- Kroening State Wildlife Management Area
- Lavoi State Wildlife Management Area
- Lessor State Wildlife Management Area
- Mahgre State Wildlife Management Area
- Malmberg Prairie Scientific and Natural Area
- Pembina State Wildlife Management Area
- Polk State Wildlife Management Area
- Red River State Recreation Area (part)
- Red River Valley Natural History Area
- Rindahl State Wildlife Management Area
- Rydell National Wildlife Refuge
- Sand Hill Recreation Area
- Shypoke State Wildlife Management Area
- Stipa State Wildlife Management Area
Demographics
| Historical population | |||
|---|---|---|---|
| Census | Pop. | %± | |
| 1880 | 11,433 | — | |
| 1890 | 30,192 | 164.1% | |
| 1900 | 35,429 | 17.3% | |
| 1910 | 36,001 | 1.6% | |
| 1920 | 37,090 | 3.0% | |
| 1930 | 36,019 | −2.9% | |
| 1940 | 37,734 | 4.8% | |
| 1950 | 35,900 | −4.9% | |
| 1960 | 36,182 | 0.8% | |
| 1970 | 34,435 | −4.8% | |
| 1980 | 34,844 | 1.2% | |
| 1990 | 32,498 | −6.7% | |
| 2000 | 31,369 | −3.5% | |
| 2010 | 31,600 | 0.7% | |
| 2020 | 31,192 | −1.3% | |
| 2021 (est.) | 30,757 | [8] | −1.4% |
| U.S. Decennial Census[9] 1790-1960[10] 1900-1990[11] 1990-2000[12] 2010-2020[1] | |||

2000 census
As of the 2000 United States census, 31,369 people, 12,070 households, and 8,050 families were in the county. The population density was 15.9/sq mi (6.14/km2). The 14,008 housing units had an average density of 7.11/sq mi (2.74/km2). The racial makeup of the county was 94.18% White, 0.33% African American, 1.30% Native American, 0.30% Asian, 2.77% from other races, and 1.30% from two or more races. About 4.79% of the population were Hispanics or Latinos of any race; 41.7% were of Norwegian, 19.7% German, and 5.8% French ancestry.
Of the 12,070 households, 32.3% had children under 18 living with them, 54.9% were married couples living together, 8.5% had a female householder with no husband present, and 33.3% were not families. About 28.9% of all households were made up of individuals, and 13.8% had someone living alone who was 65 or older. The average household size was 2.47, and the average family size was 3.07.
The county's age distribution was 25.9% under 18, 9.7% from 18 to 24, 24.8% from 25 to 44, 22.2% from 45 to 64, and 17.4% who were 65 or older. The median age was 38. For every 100 females, there were 98.1 males. For every 100 females 18 and over, there were 95.5 males.
The median income for a household was $35,105, and for a family was $44,310. Males had a median income of $31,472 versus $21,535 for females. The per capita income was $17,279. About 7.3% of families and 10.9% of the population were below the poverty line, including 13.3% of those under age 18 and 10.9% of those 65 or over.
2020 Census
| Race | Num. | Perc. |
|---|---|---|
| White (NH) | 26,538 | 85.1% |
| Black or African American (NH) | 958 | 3.1% |
| Native American (NH) | 376 | 1.21% |
| Asian (NH) | 156 | 0.5% |
| Pacific Islander (NH) | 4 | 0.01% |
| Other/mixed (NH) | 1,161 | 3.72% |
| Hispanic or Latino | 1,999 | 6.41% |
Communities
Cities
Unincorporated communities
Townships
- Andover Township
- Angus Township
- Badger Township
- Belgium Township
- Brandsvold Township
- Brandt Township
- Brislet Township
- Bygland Township
- Chester Township
- Columbia Township
- Crookston Township
- Eden Township
- Esther Township
- Euclid Township
- Fairfax Township
- Fanny Township
- Farley Township
- Fisher Township
- Garden Township
- Garfield Township
- Gentilly Township
- Godfrey Township
- Grand Forks Township
- Grove Park-Tilden Township
- Gully Township
- Hammond Township
- Helgeland Township
- Higdem Township
- Hill River Township
- Hubbard Township
- Huntsville Township
- Johnson Township
- Kertsonville Township
- Keystone Township
- King Township
- Knute Township
- Lessor Township
- Liberty Township
- Lowell Township
- Nesbit Township
- Northland Township
- Onstad Township
- Parnell Township
- Queen Township
- Reis Township
- Rhinehart Township
- Roome Township
- Rosebud Township
- Russia Township
- Sandsville Township
- Scandia Township
- Sletten Township
- Sullivan Township
- Tabor Township
- Tynsid Township
- Vineland Township
- Winger Township
- Woodside Township
Government and politics
Polk County has been a swing district for several decades. As of 2020, it has selected the Republican nominee in presidential elections in 56% of elections since 1980.
| Year | Republican | Democratic | Third party | |||
|---|---|---|---|---|---|---|
| No. | % | No. | % | No. | % | |
| 2020 | 9,865 | 63.26% | 5,439 | 34.88% | 290 | 1.86% |
| 2016 | 8,979 | 60.69% | 4,712 | 31.85% | 1,105 | 7.47% |
| 2012 | 7,615 | 51.83% | 6,773 | 46.10% | 305 | 2.08% |
| 2008 | 7,148 | 46.62% | 7,850 | 51.19% | 336 | 2.19% |
| 2004 | 8,724 | 55.68% | 6,729 | 42.95% | 215 | 1.37% |
| 2000 | 7,609 | 53.81% | 5,764 | 40.76% | 767 | 5.42% |
| 1996 | 5,563 | 40.94% | 6,369 | 46.88% | 1,655 | 12.18% |
| 1992 | 5,817 | 38.95% | 5,850 | 39.17% | 3,267 | 21.88% |
| 1988 | 7,032 | 47.96% | 7,523 | 51.31% | 107 | 0.73% |
| 1984 | 8,617 | 54.60% | 7,033 | 44.56% | 132 | 0.84% |
| 1980 | 9,036 | 51.21% | 7,151 | 40.53% | 1,457 | 8.26% |
| 1976 | 6,552 | 40.86% | 9,078 | 56.62% | 404 | 2.52% |
| 1972 | 8,139 | 51.24% | 7,366 | 46.37% | 380 | 2.39% |
| 1968 | 6,074 | 40.04% | 8,380 | 55.24% | 715 | 4.71% |
| 1964 | 5,039 | 31.28% | 11,052 | 68.60% | 20 | 0.12% |
| 1960 | 7,528 | 44.52% | 9,346 | 55.27% | 35 | 0.21% |
| 1956 | 6,847 | 46.10% | 7,980 | 53.73% | 26 | 0.18% |
| 1952 | 8,326 | 53.09% | 7,244 | 46.19% | 113 | 0.72% |
| 1948 | 4,662 | 31.98% | 9,279 | 63.64% | 639 | 4.38% |
| 1944 | 4,402 | 33.07% | 8,808 | 66.18% | 100 | 0.75% |
| 1940 | 5,200 | 32.53% | 10,652 | 66.64% | 133 | 0.83% |
| 1936 | 3,751 | 24.30% | 11,337 | 73.44% | 349 | 2.26% |
| 1932 | 3,604 | 27.32% | 8,751 | 66.35% | 835 | 6.33% |
| 1928 | 7,215 | 56.08% | 5,357 | 41.64% | 294 | 2.29% |
| 1924 | 5,027 | 43.94% | 663 | 5.80% | 5,750 | 50.26% |
| 1920 | 8,197 | 69.47% | 2,111 | 17.89% | 1,492 | 12.64% |
| 1916 | 2,471 | 37.93% | 3,498 | 53.70% | 545 | 8.37% |
| 1912 | 735 | 12.79% | 1,662 | 28.92% | 3,350 | 58.29% |
| 1908 | 3,311 | 55.21% | 1,928 | 32.15% | 758 | 12.64% |
| 1904 | 3,549 | 71.71% | 696 | 14.06% | 704 | 14.23% |
| 1900 | 2,863 | 49.62% | 2,533 | 43.90% | 374 | 6.48% |
| 1896 | 2,855 | 35.39% | 5,054 | 62.65% | 158 | 1.96% |
| 1892 | 1,376 | 23.35% | 1,510 | 25.63% | 3,006 | 51.02% |
| Position | Name | District | Next Election | |
|---|---|---|---|---|
| Commissioner and vice chairperson | Gerald Jacobson | District 1 | 2020 | |
| Commissioner | Warren Strandell | District 2 | 2022 | |
| Commissioner and chairperson | Gary Willhite | District 3 | 2020 | |
| Commissioner | Joan Lee | District 4 | 2022 | |
| Commissioner | Don Diedrich | District 5 | 2020 | |
| Position | Name | Affiliation | District | |
|---|---|---|---|---|
| Senate | Mark Johnson[16] | Republican | District 1 | |
| House of Representatives | Deb Kiel[17] | Republican | District 1B | |
| Position | Name | Affiliation | District | |
|---|---|---|---|---|
| House of Representatives | Michelle Fischbach[18] | Republican | 7th | |
| Senate | Amy Klobuchar[19] | Democrat | N/A | |
| Senate | Tina Smith[20] | Democrat | N/A | |
See also
- National Register of Historic Places listings in Polk County, Minnesota
References
- "U.S. Census Bureau QuickFacts: Polk County, Minnesota". www.census.gov. United States Census Bureau. Retrieved March 30, 2022.
- "Find a County". National Association of Counties. Retrieved June 7, 2011.
- Upham, Warren (1920). Minnesota Geographic Names: Their Origin and Historic Significance. Minnesota Historical Society. pp. 42-28.
- Polk County MN Google Maps (accessed March 16, 2019)
- ""Find an Altitude/Polk County MN" Google Maps (accessed March 16, 2019)". Archived from the original on May 21, 2019. Retrieved March 17, 2019.
- "2010 Census Gazetteer Files". US Census Bureau. August 22, 2012. Archived from the original on September 21, 2013. Retrieved October 24, 2014.
- Nelson, Steven (2011). Savanna Soils of Minnesota. Minnesota: Self. pp. 57-60. ISBN 978-0-615-50320-2.
- "Annual Estimates of the Resident Population for Counties: April 1, 2020 to July 1, 2021". Retrieved March 30, 2022.
- "U.S. Decennial Census". United States Census Bureau. Retrieved October 24, 2014.
- "Historical Census Browser". University of Virginia Library. Retrieved October 24, 2014.
- "Population of Counties by Decennial Census: 1900 to 1990". United States Census Bureau. Retrieved October 24, 2014.
- "Census 2000 PHC-T-4. Ranking Tables for Counties: 1990 and 2000" (PDF). United States Census Bureau. Retrieved October 24, 2014.
- "P2 HISPANIC OR LATINO, AND NOT HISPANIC OR LATINO BY RACE – 2020: DEC Redistricting Data (PL 94-171) – Polk County, Minnesota".
- Leip, David. "Atlas of US Presidential Elections". uselectionatlas.org. Retrieved October 10, 2018.
- "Board of Commissioners | Polk County, MN". www.co.polk.mn.us. Retrieved June 25, 2020.
- "MN State Senate". www.senate.mn. Retrieved June 25, 2020.
- "Rep. Debra Kiel (01B) - Minnesota House of Representatives". www.house.leg.state.mn.us. Retrieved June 25, 2020.
- "Congresswoman Michelle Fischbach". Congresswoman Michelle Fischbach. Retrieved June 25, 2020.
- "U.S. Senator Amy Klobuchar". www.klobuchar.senate.gov. Retrieved June 24, 2020.
- "Home". Senator Tina Smith. Retrieved June 24, 2020.
Further reading
- R.I. Holcombe and William H Bingham, Compendium of History and Biography of Polk County, Minnesota. Minneapolis: W. H. Bingham & Co., 1916.
- Huber D. McLellan, The History of the Early Settlement and Development of Polk County, Minnesota. PhD dissertation. Northwestern University, 1928.
- Polk County Historical Society, Bicentennial History of Polk County, Minnesota: Pioneers of the Valley. n.c.: Polk County Historical Society, 1976.
- Polk County Historical Society, The Polk County Historian. (journal)
- Claude Eugene Wentsel, Polk County, Minnesota, in the World War. Ada, MN: C.E. Wentsel, 1922.
- Winger Golden Jubilee Historical Committee, Golden Jubilee, Winger, Minnesota, 1904-1954. Winger, MN: Winger Enterprise, n.d. [1954].
- Maxine Workman, Minnesota Cemeteries, Polk County. West Fargo, ND: Red River Genealogy Society, 1988.
External links
Places adjacent to Polk County, Minnesota | |
|---|---|
Municipalities and communities of Polk County, Minnesota, United States | ||
|---|---|---|
County seat: Crookston | ||
| Cities | 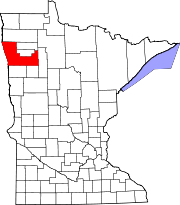 | |
| Townships |
| |
| Unincorporated communities | ||
| Indian reservation | ||
| Footnotes | ‡This populated place also has portions in an adjacent county or counties | |
| ||
| Counties |   | |
|---|---|---|
| Main cities | ||
| Surrounding areas | ||
† - county seat | ||
Authority control | |
|---|---|
| General | |
| National libraries | |
| Other |
|
На других языках
[de] Polk County (Minnesota)
Das Polk County[1] ist ein County im US-amerikanischen Bundesstaat Minnesota. Im Jahr 2010 hatte das County 31.600 Einwohner und eine Bevölkerungsdichte von 6,2 Einwohnern pro Quadratkilometer.[2] Der Verwaltungssitz (County Seat) ist Crookston.[3] Die größte Stadt im County ist East Grand Forks.- [en] Polk County, Minnesota
[ru] Полк (округ, Миннесота)
Полк (англ. Polk County) — округ в штате Миннесота, США. Столица и крупнейший город — Крукстон. По оценочной переписи 2009 года в округе проживают 30 776 человек. Площадь — 5174 км², из которых 5103,1 км² — суша, а 70,9 км² — вода. Плотность населения составляет 6 чел./км².Другой контент может иметь иную лицензию. Перед использованием материалов сайта WikiSort.org внимательно изучите правила лицензирования конкретных элементов наполнения сайта.
WikiSort.org - проект по пересортировке и дополнению контента Википедии