world.wikisort.org - USA
Clearwater County is a county in the northwestern part of the U.S. state of Minnesota. As of the 2020 census, the population was 8,524.[3] Its county seat is Bagley.[4]
Clearwater County | |
|---|---|
U.S. county | |
Clearwater County Building and Courthouse in Bagley, Minnesota. | |
Location within the U.S. state of Minnesota | |
 Minnesota's location within the U.S. | |
| Coordinates: 47°34′N 95°23′W | |
| Country | |
| State | |
| Founded | December 20, 1902[1] |
| Named for | Clearwater Lake Clearwater River[2] |
| Seat | Bagley |
| Largest city | Bagley |
| Area | |
| • Total | 1,030 sq mi (2,700 km2) |
| • Land | 999 sq mi (2,590 km2) |
| • Water | 31 sq mi (80 km2) 3.0%% |
| Population (2020) | |
| • Total | 8,524 |
| • Estimate (2021) | 8,576 |
| • Density | 8.5/sq mi (3.3/km2) |
| Time zone | UTC−6 (Central) |
| • Summer (DST) | UTC−5 (CDT) |
| Congressional district | 7th |
| Website | www |
Clearwater County is home to Lake Itasca, the source of the Mississippi River. Parts of the Red Lake and White Earth Indian reservations extend into the county.
Geography
The Red Lake River flows west out of Red Lake across the top of Clearwater County on its way to discharge into the Red River at Grand Forks, North Dakota. The Clearwater River flows west-southwest across the central part of the county on its way to discharge into the Red Lake River. The county terrain consists of wooded rolling hills, dotted with lakes and ponds.[5] The terrain slopes to the north, with the highest point on the lower west boundary, at 1,781' (543m) ASL.[6] The county has an area of 1,030 square miles (2,700 km2), of which 999 square miles (2,590 km2) is land and 31 square miles (80 km2) (3.0%) is water.[7]
![Soils of Clearwater County[8]](http://upload.wikimedia.org/wikipedia/commons/thumb/c/c8/Clearwater_Co_Pie_Chart_No_Text_Version.pdf/page1-220px-Clearwater_Co_Pie_Chart_No_Text_Version.pdf.jpg)
The county's high point, just south of Scoop Lake, is one of a few places to exceed 2000 feet in Minnesota, rising to 2005 feet at 47.2318°N, -95.5034°W.
Major highways
 U.S. Highway 2
 Minnesota State Highway 1
 Minnesota State Highway 92
 Minnesota State Highway 113
 Minnesota State Highway 200
 Minnesota State Highway 223
Adjacent counties
- Beltrami County - northeast
- Hubbard County - southeast
- Becker County - south
- Mahnomen County - southwest
- Polk County - west
- Pennington County - northwest
Protected areas
- Bagley Lake State Wildlife Management Area
- Clearwater State Wildlife Management Area
- Iron Springs Bog Scientific and Natural Area
- Itasca State Park (part)
- Jackson Lake State Wildlife Management Area
- Little Pine State Wildlife Management Area
- Lower Rice Lake State Wildlife Management Area
- Old Red Lake Trail State Wildlife Management Area
- Upper Rice Lake State Wildlife Management Area
Climate and weather
| Bagley, Minnesota | ||||||||||||||||||||||||||||||||||||||||||||||||||||||||||||
|---|---|---|---|---|---|---|---|---|---|---|---|---|---|---|---|---|---|---|---|---|---|---|---|---|---|---|---|---|---|---|---|---|---|---|---|---|---|---|---|---|---|---|---|---|---|---|---|---|---|---|---|---|---|---|---|---|---|---|---|---|
| Climate chart (explanation) | ||||||||||||||||||||||||||||||||||||||||||||||||||||||||||||
| ||||||||||||||||||||||||||||||||||||||||||||||||||||||||||||
| ||||||||||||||||||||||||||||||||||||||||||||||||||||||||||||
In recent years average temperatures in Bagley have ranged from a low of −15 °F (−26 °C) in January to a high of 85 °F (29 °C) in July, with a record low of −53 °F (−47 °C) recorded in February 1996 and a record high of 103 °F (39 °C) recorded in August 1976. Average monthly precipitation ranged from 0.64 inches (16 mm) in December to 4.62 inches (117 mm) in June.[9]
Demographics
| Historical population | |||
|---|---|---|---|
| Census | Pop. | %± | |
| 1910 | 6,870 | — | |
| 1920 | 8,569 | 24.7% | |
| 1930 | 9,546 | 11.4% | |
| 1940 | 11,153 | 16.8% | |
| 1950 | 10,204 | −8.5% | |
| 1960 | 8,864 | −13.1% | |
| 1970 | 8,013 | −9.6% | |
| 1980 | 8,761 | 9.3% | |
| 1990 | 8,309 | −5.2% | |
| 2000 | 8,423 | 1.4% | |
| 2010 | 8,695 | 3.2% | |
| 2020 | 8,524 | −2.0% | |
| 2021 (est.) | 8,576 | [10] | 0.6% |
| U.S. Decennial Census[11] 1790-1960[12] 1900-1990[13] 1990-2000[14] 2010-2020[3] | |||
2000 census
As of the 2000 census there were 8,423 people, 3,330 households, and 2,287 families in the county. The population density was 8.43/sqmi (3.26/km2). There were 4,114 housing units at an average density of 4.12/sqmi (1.59/km2). The racial makeup of the county was 89.26% White, 0.19% Black or African American, 8.58% Native American, 0.25% Asian, 0.01% Pacific Islander, 0.24% from other races, and 1.47% from two or more races. 0.77% of the population were Hispanic or Latino of any race. 43.6% were of Norwegian, 15.6% German, 6.5% Swedish, and 6.2% American ancestry.
There were 3,330 households, out of which 30.60% had children under the age of 18 living with them, 56.80% were married couples living together, 7.50% had a female householder with no husband present, and 31.30% were non-families. 27.90% of all households were made up of individuals, and 14.50% had someone living alone who was 65 years of age or older. The average household size was 2.48 and the average family size was 3.02.
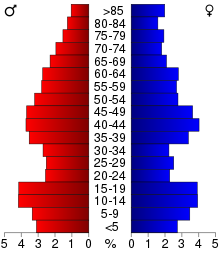
The county population contained 26.00% under the age of 18, 7.60% from 18 to 24, 24.60% from 25 to 44, 24.30% from 45 to 64, and 17.50% who were 65 years of age or older. The median age was 40 years. For every 100 females there were 101.10 males. For every 100 females age 18 and over, there were 100.30 males.
The median income for a household in the county was $30,517, and the median income for a family was $39,698. Males had a median income of $29,338 versus $20,417 for females. The per capita income for the county was $15,694. About 11.00% of families and 15.10% of the population were below the poverty line, including 18.90% of those under age 18 and 18.20% of those age 65 or over.
2020 Census
| Race | Num. | Perc. |
|---|---|---|
| White (NH) | 7,151 | 83.9% |
| Black or African American (NH) | 19 | 0.2% |
| Native American (NH) | 752 | 8.82% |
| Asian (NH) | 23 | 0.3% |
| Pacific Islander (NH) | 2 | 0.02% |
| Other/Mixed (NH) | 476 | 5.6% |
| Hispanic or Latino | 101 | 1.2% |
Communities
Cities
- Bagley (county seat)
- Clearbrook
- Gonvick
- Leonard
- Shevlin
Census-designated places
Unincorporated communities
- Alida
- Big Bear Landing
- Bonga Landing
- Bush Landing
- Lake Itasca
- Mallard
- Ponsford Landing
- Vern
- Weme
- Zerkel
Townships
- Bear Creek Township
- Clover Township
- Copley Township
- Dudley Township
- Eddy Township
- Falk Township
- Greenwood Township
- Hangaard Township
- Holst Township
- Itasca Township
- La Prairie Township
- Leon Township
- Long Lost Lake Township
- Minerva Township
- Moose Creek Township
- Nora Township
- Pine Lake Township
- Popple Township
- Rice Township
- Shevlin Township
- Sinclair Township
- Winsor Township
Unorganized territories
- North Clearwater
- South Clearwater
Government and politics
Clearwater County was long a swing precinct (from 1968 through 2020, the Republican presidential candidate won 58% of the time), but no Democratic presidential candidate has carried the county since 1996.
| Year | Republican | Democratic | Third party | |||
|---|---|---|---|---|---|---|
| No. | % | No. | % | No. | % | |
| 2020 | 3,372 | 71.62% | 1,260 | 26.76% | 76 | 1.61% |
| 2016 | 2,925 | 68.90% | 1,100 | 25.91% | 220 | 5.18% |
| 2012 | 2,359 | 56.21% | 1,753 | 41.77% | 85 | 2.03% |
| 2008 | 2,291 | 53.77% | 1,877 | 44.05% | 93 | 2.18% |
| 2004 | 2,438 | 55.90% | 1,871 | 42.90% | 52 | 1.19% |
| 2000 | 2,137 | 55.88% | 1,466 | 38.34% | 221 | 5.78% |
| 1996 | 1,423 | 40.50% | 1,578 | 44.91% | 513 | 14.60% |
| 1992 | 1,315 | 34.99% | 1,587 | 42.23% | 856 | 22.78% |
| 1988 | 1,763 | 49.43% | 1,769 | 49.59% | 35 | 0.98% |
| 1984 | 2,066 | 51.33% | 1,917 | 47.63% | 42 | 1.04% |
| 1980 | 1,919 | 46.39% | 1,955 | 47.26% | 263 | 6.36% |
| 1976 | 1,374 | 34.22% | 2,437 | 60.70% | 204 | 5.08% |
| 1972 | 1,819 | 49.39% | 1,751 | 47.54% | 113 | 3.07% |
| 1968 | 1,284 | 36.06% | 2,046 | 57.46% | 231 | 6.49% |
| 1964 | 1,137 | 30.41% | 2,596 | 69.43% | 6 | 0.16% |
| 1960 | 1,651 | 39.93% | 2,466 | 59.64% | 18 | 0.44% |
| 1956 | 1,464 | 40.11% | 2,171 | 59.48% | 15 | 0.41% |
| 1952 | 1,971 | 47.89% | 2,089 | 50.75% | 56 | 1.36% |
| 1948 | 1,171 | 27.80% | 2,793 | 66.31% | 248 | 5.89% |
| 1944 | 1,125 | 29.47% | 2,658 | 69.64% | 34 | 0.89% |
| 1940 | 1,354 | 28.94% | 3,289 | 70.31% | 35 | 0.75% |
| 1936 | 939 | 22.05% | 3,208 | 75.34% | 111 | 2.61% |
| 1932 | 845 | 22.89% | 2,688 | 72.81% | 159 | 4.31% |
| 1928 | 1,898 | 60.01% | 1,189 | 37.59% | 76 | 2.40% |
| 1924 | 1,020 | 37.54% | 86 | 3.17% | 1,611 | 59.29% |
| 1920 | 1,788 | 70.73% | 340 | 13.45% | 400 | 15.82% |
| 1916 | 493 | 39.92% | 544 | 44.05% | 198 | 16.03% |
| 1912 | 125 | 11.42% | 123 | 11.23% | 847 | 77.35% |
| 1908 | 779 | 66.07% | 164 | 13.91% | 236 | 20.02% |
| 1904 | 903 | 85.27% | 79 | 7.46% | 77 | 7.27% |
| Position | Name | District | Next Election | |
|---|---|---|---|---|
| Commissioner | Mark Titera | District 1 | 2022 | |
| Commissioner | Dean Newland | District 2 | 2020 | |
| Commissioner | Neal Illies | District 3 | 2022 | |
| Commissioner | John Nelson | District 4 | 2020 | |
| Commissioner | Mark Larson | District 5 | 2022 | |
| Position | Name | Affiliation | District | |
|---|---|---|---|---|
| Senate | Paul Utke[18] | Republican | District 2 | |
| House of Representatives | Matt Grossell[19] | Republican | District 2A | |
| House of Representatives | Steve Green[20] | Republican | District 2B | |
| Position | Name | Affiliation | District | |
|---|---|---|---|---|
| House of Representatives | Collin Peterson[21] | Democrat | 7th | |
| Senate | Amy Klobuchar[22] | Democrat | N/A | |
| Senate | Tina Smith[23] | Democrat | N/A | |
See also
- National Register of Historic Places listings in Clearwater County MN
References
- "Minnesota Place Names". Minnesota Historical Society. Archived from the original on June 20, 2012. Retrieved March 17, 2014.
- Upham, Warren (1920). Minnesota Geographic Names: Their Origin and Historic Significance. Minnesota Historical Society. p. 121.
- "U.S. Census Bureau QuickFacts: Clearwater County, Minnesota". www.census.gov. United States Census Bureau. Retrieved April 2, 2022.
- "Find a County". National Association of Counties. Archived from the original on May 31, 2011. Retrieved June 7, 2011.
- Clearwater County MN Google Maps (accessed March 6, 2019)
- ""Find an Altitude/Clearwater County MN" Google Maps (accessed March 6, 2019)". Archived from the original on May 21, 2019. Retrieved March 7, 2019.
- "2010 Census Gazetteer Files". United States Census Bureau. August 22, 2012. Archived from the original on October 6, 2014. Retrieved October 6, 2014.
- Nelson, Steven (2011). Savanna Soils of Minnesota. Minnesota: Self. pp. 57-60. ISBN 978-0-615-50320-2.
- "Monthly Averages for Bagley, Minnesota". The Weather Channel. Retrieved November 6, 2011.
- "Annual Estimates of the Resident Population for Counties: April 1, 2020 to July 1, 2021". Retrieved April 2, 2022.
- "U.S. Decennial Census". United States Census Bureau. Archived from the original on April 26, 2015. Retrieved October 6, 2014.
- "Historical Census Browser". University of Virginia Library. Retrieved October 6, 2014.
- "Population of Counties by Decennial Census: 1900 to 1990". United States Census Bureau. Retrieved October 6, 2014.
- "Census 2000 PHC-T-4. Ranking Tables for Counties: 1990 and 2000" (PDF). United States Census Bureau. Retrieved October 6, 2014.
- "P2 HISPANIC OR LATINO, AND NOT HISPANIC OR LATINO BY RACE – 2020: DEC Redistricting Data (PL 94-171) – Clearwater County, Minnesota".
- Leip, David. "Atlas of US Presidential Elections". uselectionatlas.org. Retrieved April 17, 2018.
- "County Board - Clearwater County, MN". www.co.clearwater.mn.us. Retrieved June 25, 2020.
- "MN State Senate". www.senate.mn. Retrieved June 25, 2020.
- "Rep. Matt Grossell (02A) - Minnesota House of Representatives". www.house.leg.state.mn.us. Retrieved June 25, 2020.
- "Rep. Steve Green (02B) - Minnesota House of Representatives". www.house.leg.state.mn.us. Retrieved June 25, 2020.
- "Congressman Collin Peterson". Congressman Collin Peterson. Archived from the original on June 25, 2020. Retrieved June 25, 2020.
- "U.S. Senator Amy Klobuchar". www.klobuchar.senate.gov. Retrieved June 24, 2020.
- "Home". Senator Tina Smith. Retrieved June 24, 2020.
External links
Places adjacent to Clearwater County, Minnesota | ||||||||||||||||
|---|---|---|---|---|---|---|---|---|---|---|---|---|---|---|---|---|
| ||||||||||||||||
Municipalities and communities of Clearwater County, Minnesota, United States | ||
|---|---|---|
County seat: Bagley | ||
| Cities | 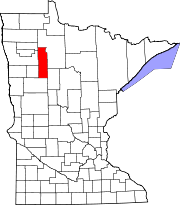 | |
| Townships | ||
| CDPs | ||
| Unorganized territories |
| |
| Unincorporated communities | ||
| Indian reservations |
| |
| Ghost town |
| |
| Footnotes | ‡This populated place also has portions in an adjacent county or counties | |
| ||
Saint Paul (capital) | |||||
| Topics |
| ||||
| Society |
| ||||
| Regions |
| ||||
| Largest cities pop. over 25,000 |
| ||||
| Counties |
| ||||
| Attractions |
| ||||
Authority control | |
|---|---|
| General | |
| National libraries | |
| Other |
|
На других языках
[de] Clearwater County (Minnesota)
Das Clearwater County[1] ist ein County im US-amerikanischen Bundesstaat Minnesota. Im Jahr 2010 hatte das County 8695 Einwohner und eine Bevölkerungsdichte von 3,4 Einwohnern pro Quadratkilometer.[2] Der Verwaltungssitz (County Seat) ist Bagley[3], das nach Sumner Bagley, einem Holzfäller, benannt wurde.- [en] Clearwater County, Minnesota
[ru] Клируотер (округ, Миннесота)
Клируотер (англ. Clearwater County) — округ в штате Миннесота, США. Столица — Багли. По оценочной переписи 2008 года в округе проживают 8249 человек. Площадь — 2667 км², из которых 2,58 км² — суша, а 0,09 км² — вода. Плотность населения составляет 3 чел./км².Другой контент может иметь иную лицензию. Перед использованием материалов сайта WikiSort.org внимательно изучите правила лицензирования конкретных элементов наполнения сайта.
WikiSort.org - проект по пересортировке и дополнению контента Википедии