world.wikisort.org - USA
Freeborn County is a county in the state of Minnesota. As of the 2020 United States Census, the population was 30,895.[2] Its county seat is Albert Lea.[3] Freeborn County comprises the Albert Lea Micropolitan Statistical Area.
Freeborn County | |
|---|---|
U.S. county | |
 Freeborn County Courthouse | |
 Location within the U.S. state of Minnesota | |
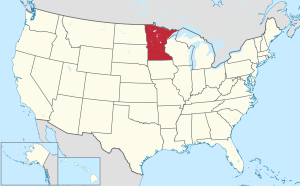 Minnesota's location within the U.S. | |
| Coordinates: 43°40′N 93°21′W | |
| Country | |
| State | |
| Founded | February 20, 1855[1] |
| Named for | William Freeborn |
| Seat | Albert Lea |
| Largest city | Albert Lea |
| Area | |
| • Total | 722 sq mi (1,870 km2) |
| • Land | 707 sq mi (1,830 km2) |
| • Water | 15 sq mi (40 km2) 2.1%% |
| Population (2020) | |
| • Total | 30,895 |
| • Estimate (2021) | 30,749 |
| • Density | 43.7/sq mi (16.9/km2) |
| Time zone | UTC−6 (Central) |
| • Summer (DST) | UTC−5 (CDT) |
| Congressional district | 1st |
| Website | www |
History
Freeborn County was created on February 20, 1855, the territory being separated from Blue Earth and Rice Counties. Twelve other Minnesota counties were created the same day by the Minnesota Territorial Legislature.[4] Freeborn County was named for William Freeborn, an early Minnesota pioneer, merchant, and territorial legislator.[5]
Geography
Freeborn County lies on Minnesota's border with Iowa. The Shell Rock River flows southward from Albert Lea Lake in central Freeborn County, crossing into Iowa. Turtle Creek flows eastward through the upper eastern part of the county, crossing into Mower County. The terrain is hilly and etched with drainages and gullies. The Le Sueur River, a tributary of the Minnesota River, begins in the northern part of the county and flows northward into Waseca County. The Cobb River and the Maple River, two other small rivers, begin in the extreme northwest corner of the county, the Cobb from Freeborn Lake and the Maple from Penny Lake. Both run generally northwest, emptying into the LeSueur River, just upstream from where the LeSueur empties into the Minnesota River, on the western edge of Mankato. Most of the available land is devoted to agriculture.[6] The terrain generally slopes to the south and east, although the highest point is near the northeast corner, at 1,296' (395m) ASL.[7] The county has an area of 722 square miles (1,870 km2), of which 707 square miles (1,830 km2) is land and 15 square miles (39 km2) (2.1%) is water.[8]
![Soils of Freeborn County[9]](http://upload.wikimedia.org/wikipedia/commons/thumb/e/e0/Freeborn_Co_Pie_Chart_No_Text_Version.pdf/page1-220px-Freeborn_Co_Pie_Chart_No_Text_Version.pdf.jpg)

Lakes[6]
- Albert Lea Lake
- Bear Lake
- Church Lake
- Everhart Lake
- Fountain Lake
- Freeborn Lake
- Geneva Lake
- Goose Lake
- Halls Lake
- Hickory Lake
- Lower Twin Lake
- Penny Lake
- Pickerel Lake
- School Section Lake
- State Line Lake
- Sugar Lake
- Trenton Lake (part)
- Upper Twin Lake
- White Lake
Protected areas[6]
- Bear Lake State Wildlife Management Area
- Carex State Wildlife Management Area
- Halls Lake State Wildlife Area
- Moscow State Game Refuge
- Myre-Big Island State Park
- White Woods County Park
Major highways
 Interstate 35
 Interstate 90
 U.S. Highway 65
 U.S. Highway 69
 Minnesota State Highway 13
 Minnesota State Highway 109
 Minnesota State Highway 251
Adjacent counties
- Steele County - northeast
- Mower County - east
- Worth County, Iowa - south
- Winnebago County, Iowa - southwest
- Faribault County - west
- Waseca County - northwest
Demographics
| Historical population | |||
|---|---|---|---|
| Census | Pop. | %± | |
| 1860 | 3,367 | — | |
| 1870 | 10,578 | 214.2% | |
| 1880 | 16,069 | 51.9% | |
| 1890 | 17,962 | 11.8% | |
| 1900 | 21,838 | 21.6% | |
| 1910 | 22,282 | 2.0% | |
| 1920 | 24,692 | 10.8% | |
| 1930 | 28,741 | 16.4% | |
| 1940 | 31,780 | 10.6% | |
| 1950 | 34,517 | 8.6% | |
| 1960 | 37,891 | 9.8% | |
| 1970 | 38,064 | 0.5% | |
| 1980 | 36,329 | −4.6% | |
| 1990 | 33,060 | −9.0% | |
| 2000 | 32,584 | −1.4% | |
| 2010 | 31,255 | −4.1% | |
| 2020 | 30,895 | −1.2% | |
| 2021 (est.) | 30,749 | [10] | −0.5% |
| U.S. Decennial Census[11] 1790-1960[12] 1900-1990[13] 1990-2000[14] 2010-2020[2] | |||

2000 census
As of the 2000 census, there were 32,584 people, 13,356 households, and 9,015 families in the county. The population density was 46.1/sqmi (17.8/km2). There were 13,996 housing units at an average density of 19.8/sqmi (7.64/km2). The racial makeup of the county was 95.22% White, 0.24% Black or African American, 0.20% Native American, 0.55% Asian, 0.02% Pacific Islander, 2.92% from other races, and 0.85% from two or more races. 6.29% of the population were Hispanic or Latino of any race. 34.8% were of Norwegian, 26.2% German and 5.8% Danish ancestry.
There were 13,356 households, of which 29.1% had children under age 18 living with them, 56.5% were married couples living together, 7.5% had a female householder with no husband present, and 32.5% were non-families. 28.2% of all households were made up of individuals, and 14.0% had someone living alone who was 65 or older. The average household size was 2.40 and the average family size was 2.92.
The county population contained 24.0% under 18, 7.5% from 18 to 24, 25.5% from 25 to 44, 24.1% from 45 to 64, and 18.9% who were 65 or older. The median age was 40. For every 100 females there were 96.6 males. For every 100 females 18 and older, there were 95.0 males.
The median income for a household in the county was $36,964, and the median income for a family was $45,142. Males had a median income of $31,491 versus $21,799 for females. The per capita income for the county was $18,325. About 5.6% of families and 8.4% of the population were below the poverty line, including 9.0% of those under 18 and 9.1% of those over 64.
2020 Census
| Race | Num. | Perc. |
|---|---|---|
| White (NH) | 25,071 | 81.2% |
| Black or African American (NH) | 460 | 1.5% |
| Native American (NH) | 76 | 0.3% |
| Asian (NH) | 1,135 | 3.7% |
| Pacific Islander (NH) | 5 | 0.02% |
| Other/Mixed (NH) | 965 | 3.12% |
| Hispanic or Latino | 3,183 | 10.3% |
Communities
Cities
Unincorporated communities
- Armstrong
- Corning (partial)
- Gordonsville
- Mansfield
- Maple Island
- Moscow
- Oakland
- Petran
Townships
- Albert Lea Township
- Alden Township
- Bancroft Township
- Bath Township
- Carlston Township
- Freeborn Township
- Freeman Township
- Geneva Township
- Hartland Township
- Hayward Township
- London Township
- Manchester Township
- Mansfield Township
- Moscow Township
- Newry Township
- Nunda Township
- Oakland Township
- Pickerel Lake Township
- Riceland Township
- Shell Rock Township
Government and politics
| Year | Republican | Democratic | Third party | |||
|---|---|---|---|---|---|---|
| No. | % | No. | % | No. | % | |
| 2020 | 9,578 | 56.95% | 6,889 | 40.96% | 351 | 2.09% |
| 2016 | 8,808 | 54.88% | 6,041 | 37.64% | 1,202 | 7.49% |
| 2012 | 6,969 | 41.72% | 9,326 | 55.82% | 411 | 2.46% |
| 2008 | 6,955 | 40.25% | 9,915 | 57.38% | 410 | 2.37% |
| 2004 | 7,681 | 43.48% | 9,733 | 55.09% | 252 | 1.43% |
| 2000 | 6,843 | 42.40% | 8,514 | 52.75% | 782 | 4.85% |
| 1996 | 5,166 | 32.31% | 8,458 | 52.90% | 2,364 | 14.79% |
| 1992 | 5,089 | 28.57% | 7,759 | 43.56% | 4,965 | 27.87% |
| 1988 | 7,226 | 44.56% | 8,836 | 54.48% | 156 | 0.96% |
| 1984 | 8,413 | 47.09% | 9,338 | 52.26% | 116 | 0.65% |
| 1980 | 8,475 | 47.65% | 8,212 | 46.17% | 1,098 | 6.17% |
| 1976 | 8,220 | 45.62% | 9,470 | 52.56% | 328 | 1.82% |
| 1972 | 9,747 | 56.90% | 7,163 | 41.82% | 220 | 1.28% |
| 1968 | 7,315 | 44.16% | 8,671 | 52.35% | 577 | 3.48% |
| 1964 | 6,136 | 36.72% | 10,554 | 63.16% | 19 | 0.11% |
| 1960 | 8,970 | 52.73% | 8,018 | 47.14% | 22 | 0.13% |
| 1956 | 7,632 | 51.63% | 7,138 | 48.29% | 11 | 0.07% |
| 1952 | 8,450 | 56.25% | 6,525 | 43.44% | 46 | 0.31% |
| 1948 | 5,238 | 39.45% | 7,825 | 58.94% | 213 | 1.60% |
| 1944 | 5,728 | 46.77% | 6,486 | 52.96% | 32 | 0.26% |
| 1940 | 6,683 | 48.85% | 6,942 | 50.75% | 55 | 0.40% |
| 1936 | 4,653 | 37.81% | 7,378 | 59.96% | 274 | 2.23% |
| 1932 | 4,931 | 44.62% | 5,838 | 52.82% | 283 | 2.56% |
| 1928 | 7,815 | 72.70% | 2,859 | 26.60% | 76 | 0.71% |
| 1924 | 6,139 | 63.75% | 480 | 4.98% | 3,011 | 31.27% |
| 1920 | 6,772 | 81.96% | 1,131 | 13.69% | 360 | 4.36% |
| 1916 | 2,418 | 60.07% | 1,347 | 33.47% | 260 | 6.46% |
| 1912 | 672 | 17.04% | 880 | 22.31% | 2,392 | 60.65% |
| 1908 | 2,465 | 61.14% | 976 | 24.21% | 591 | 14.66% |
| 1904 | 2,876 | 78.19% | 461 | 12.53% | 341 | 9.27% |
| 1900 | 2,934 | 74.17% | 838 | 21.18% | 184 | 4.65% |
| 1896 | 3,400 | 72.25% | 1,179 | 25.05% | 127 | 2.70% |
| 1892 | 2,004 | 61.27% | 743 | 22.71% | 524 | 16.02% |
| Position | Name | District | Next Election | |
|---|---|---|---|---|
| Commissioner | Brad Edwin | District 1 | 2024 | |
| Commissioner and Vice Chair | Dan Belshan | District 2 | 2022 | |
| Commissioner | John Forman | District 3 | 2024 | |
| Commissioner and Chair | Christopher Shoff | District 4 | 2022 | |
| Commissioner | Ted Herman | District 5 | 2024 | |
| Position | Name | Affiliation | District | |
|---|---|---|---|---|
| Senate | Gene Dornink[18] | Republican | District 27 | |
| House of Representatives | Peggy Bennett[19] | Republican | District 27A | |
| House of Representatives | Patricia Mueller[20] | Republican | District 27B | |
| Position | Name | Affiliation | District | |
|---|---|---|---|---|
| House of Representatives | Brad Finstad[21] | Republican | 1st | |
| Senate | Amy Klobuchar[22] | Democrat | N/A | |
| Senate | Tina Smith[23] | Democrat | N/A | |
See also
- National Register of Historic Places listings in Freeborn County, Minnesota
References
- "Minnesota Place Names". Minnesota Historical Society. Archived from the original on June 20, 2012. Retrieved March 18, 2014.
- "U.S. Census Bureau QuickFacts: Freeborn County, Minnesota". www.census.gov. United States Census Bureau. Retrieved April 1, 2022.
- "Find a County". National Association of Counties. Archived from the original on May 31, 2011. Retrieved June 7, 2011.
- Upham, Warren (1920). Minnesota Geographic Names: Their Origin and Historic Significance. Minnesota Historical Society. p. 198.
- Gannett, Henry (1905). The Origin of Certain Place Names in the United States. Govt. Print. Off. p. 131.
- Freeborn County MN Google Maps (accessed March 8, 2019)
- "Find an Altitude/Freeborn County MN" Google Maps (accessed March 8, 2019)
- "2010 Census Gazetteer Files". United States Census Bureau. August 22, 2012. Archived from the original on October 6, 2014. Retrieved October 15, 2014.
- Nelson, Steven (2011). Savanna Soils of Minnesota. Minnesota: Self. pp 43–48. ISBN 978-0-615-50320-2
- "Annual Estimates of the Resident Population for Counties: April 1, 2020 to July 1, 2021". Retrieved April 1, 2022.
- "U.S. Decennial Census". United States Census Bureau. Archived from the original on April 26, 2015. Retrieved October 15, 2014.
- "Historical Census Browser". University of Virginia Library. Retrieved October 15, 2014.
- "Population of Counties by Decennial Census: 1900 to 1990". United States Census Bureau. Retrieved October 15, 2014.
- "Census 2000 PHC-T-4. Ranking Tables for Counties: 1990 and 2000" (PDF). United States Census Bureau. Retrieved October 15, 2014.
- "P2 HISPANIC OR LATINO, AND NOT HISPANIC OR LATINO BY RACE – 2020: DEC Redistricting Data (PL 94-171) – Freeborn County, Minnesota".
- Leip, David. "Atlas of US Presidential Elections". uselectionatlas.org. Retrieved September 18, 2018.
- "Board of Commissioners | Freeborn County, MN - Official Website". www.co.freeborn.mn.us. Retrieved June 25, 2020.
- Stultz, Sarah (November 5, 2020). "Dornink wins District 27 Senate seat". Albert Lea Tribune. Retrieved April 18, 2021.
- "Rep. Peggy Bennett (27A) - Minnesota House of Representatives". www.house.leg.state.mn.us. Retrieved June 25, 2020.
- "Rep. Patricia Mueller - RELEASE: Mueller Sworn In, Named to House Committees". www.house.leg.state.mn.us. Retrieved April 18, 2021.
- "Republican Rep. Brad Finstad sworn in to finish Hagedorn's House term". August 12, 2022.
- "U.S. Senator Amy Klobuchar". www.klobuchar.senate.gov. Retrieved June 24, 2020.
- "Home". Senator Tina Smith. Retrieved June 24, 2020.
External links
Places adjacent to Freeborn County, Minnesota | ||||||||||||||||
|---|---|---|---|---|---|---|---|---|---|---|---|---|---|---|---|---|
| ||||||||||||||||
Municipalities and communities of Freeborn County, Minnesota, United States | ||
|---|---|---|
County seat: Albert Lea | ||
| Cities | 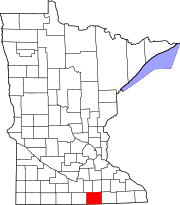 | |
| Townships | ||
| Unincorporated communities | ||
| Footnotes | ‡This populated place also has portions in an adjacent county or counties | |
| ||
Authority control | |
|---|---|
| General | |
| National libraries | |
| Other | |
На других языках
[de] Freeborn County
Das Freeborn County[1] ist ein County im US-amerikanischen Bundesstaat Minnesota. Im Jahr 2010 hatte das County 31.255 Einwohner und eine Bevölkerungsdichte von 17,1 Einwohnern pro Quadratkilometer.[2] Der Verwaltungssitz (County Seat) ist Albert Lea[3], das nach Albert Miller benannt wurde, einem frühen Erforscher dieses Gebiets.- [en] Freeborn County, Minnesota
[ru] Фриборн (округ)
Фриборн (англ. Freeborn County) — округ в штате Миннесота, США. Столица и крупнейший город — Альберт-Ли. По переписи 2010 года в округе проживают 31 255 человек. Площадь — 1870 км², из которых 1831 км² — суша, а 39 км² — вода. Плотность населения составляет 16,7 чел./км².Другой контент может иметь иную лицензию. Перед использованием материалов сайта WikiSort.org внимательно изучите правила лицензирования конкретных элементов наполнения сайта.
WikiSort.org - проект по пересортировке и дополнению контента Википедии