world.wikisort.org - USA
Cook County is the easternmost county in the U.S. state of Minnesota. As of the 2020 census, the population was 5,600,[1] making it Minnesota's seventh-least populous county. Its county seat is Grand Marais.[2] The Grand Portage Indian Reservation is in the county.
Cook County | |
|---|---|
U.S. county | |
 Cook County Courthouse | |
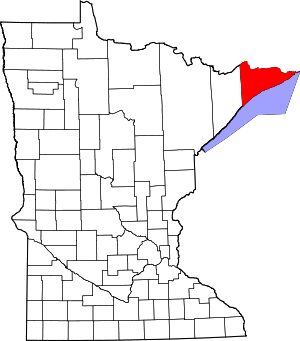 Location within the U.S. state of Minnesota | |
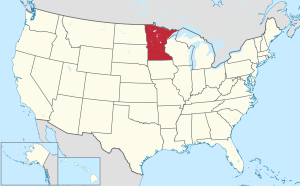 Minnesota's location within the U.S. | |
| Coordinates: 47°55′00″N 90°33′00″W | |
| Country | |
| State | |
| Founded | March 9, 1874 |
| Named for | Michael Cook |
| Seat | Grand Marais |
| Largest city | Grand Marais |
| Area | |
| • Total | 3,340 sq mi (8,700 km2) |
| • Land | 1,452 sq mi (3,760 km2) |
| • Water | 1,887 sq mi (4,890 km2) 57%% |
| Population (2020) | |
| • Total | 5,600 |
| • Estimate (2021) | 5,617 |
| • Density | 1.7/sq mi (0.65/km2) |
| Time zone | UTC−6 (Central) |
| • Summer (DST) | UTC−5 (CDT) |
| Congressional district | 8th |
| Website | www |
History
Ojibwe people were early inhabitants of this area. The first non-indigenous people to explore the area were French fur traders, a few of whom settled in the area. By the 1830s, the French population was a few dozen. In the 1830s, settlers began arriving from New England and from upstate New York. Completion of the Erie Canal (1825) and settling of the Black Hawk War (1831) made migration easier.
Most of Cook County's 1830s settlers came from Orange County, Vermont and Down East Maine (modern day Washington County and Hancock County). Most were fishermen and farmers. By 1845 the future Cook County contained 350 people of European descent; by 1874 there were about 2,000. They were primarily members of the Congregational Church, Methodist, and Baptist churches. By 1900 there were about 3,000 people in Cook County.
The first decade of the 20th century saw a large influx of Europeans from Germany, Scandinavia, and Ireland. These waves introduced Lutheranism and Catholicism to Cook County.
The county was created on March 9, 1874.[3] It was named for Territorial and State Senator Michael Cook.[4]
Geography

Cook County is a rugged, heavily wooded triangle of land on Minnesota's northeastern tip. It abuts Canada's southern border and is largely surrounded by the northern end of the Great Lakes. It is heavily dotted with lakes, ponds and streams.[5] The state's highest point is in the county, at 2,301' (701m) ASL. The county has an area of 3,340 square miles (8,700 km2), of which 1,452 square miles (3,760 km2) is land and 1,887 square miles (4,890 km2) (57%) is water.[6] It is Minnesota's second-largest county by area. Minnesota's highest natural point, Eagle Mountain at 2,301 feet (701 m), and highest lake, Lake Abita at 2,048 feet (624 m), are in Cook County. Lake Superior is at the county's southern border.
Major highways
 Minnesota State Highway 61
 Cook County Road 12 – Gunflint Trail
Adjacent counties
Cook County is in the extreme northeast of the state at the tip of the Arrowhead region; it is adjacent to only one other county by land. Its geographic neighbors are:
- Rainy River District, Ontario Canada - northwest
- Thunder Bay District, Ontario Canada - northeast (EST Border east of the 90th meridian west)
- Lake County - west
- Ashland County, Wisconsin - south
- Keweenaw County, Michigan - east/EST Border
- Ontonagon County, Michigan - southeast/EST Border
Protected areas
- Cascade River State Park
- Grand Portage National Monument
- Judge C. R. Magney State Park
- Kodunce River State Wayside Area
- North Shore State Trail (part)
- Pat Bayle State Forest
- Superior National Forest (part)
- Boundary Waters Canoe Area Wilderness (part)
- Temperance River State Park
Climate
| Climate data for Lutsen, Minnesota | |||||||||||||
|---|---|---|---|---|---|---|---|---|---|---|---|---|---|
| Month | Jan | Feb | Mar | Apr | May | Jun | Jul | Aug | Sep | Oct | Nov | Dec | Year |
| Average high °F (°C) | 22 (−6) |
26 (−3) |
35 (2) |
47 (8) |
56 (13) |
64 (18) |
70 (21) |
70 (21) |
62 (17) |
52 (11) |
39 (4) |
27 (−3) |
48 (9) |
| Average low °F (°C) | 4 (−16) |
7 (−14) |
19 (−7) |
31 (−1) |
39 (4) |
45 (7) |
52 (11) |
54 (12) |
47 (8) |
38 (3) |
26 (−3) |
11 (−12) |
31 (−1) |
| Average rainfall inches (mm) | 0.9 (23) |
0.7 (18) |
1.4 (36) |
1.9 (48) |
2.8 (71) |
3.5 (89) |
3.3 (84) |
3.3 (84) |
3.6 (91) |
2.5 (64) |
1.6 (41) |
1.1 (28) |
26.4 (670) |
| Average snowfall inches (cm) | 15.2 (39) |
8.1 (21) |
8.1 (21) |
2.2 (5.6) |
0.2 (0.51) |
0 (0) |
0 (0) |
0 (0) |
0 (0) |
0.4 (1.0) |
3.8 (9.7) |
13.3 (34) |
50.8 (129) |
| Source: Weatherbase[7] | |||||||||||||
Northern Minnesota offers extreme winter weather. While the averages are low, the extremes provide more details. A third of the year is below freezing (31.9%, 116 days, or 4 months). Of those days, 21 are below zero degrees Fahrenheit (−17.8 °C).
| Jan | Feb | Mar | Apr | May | June | Jul | Aug | Sep | Oct | Nov | Dec | Year |
|---|---|---|---|---|---|---|---|---|---|---|---|---|
| Days Below 32 °F/0 °C[7] | ||||||||||||
| 20 | 18 | 19 | 13 | 3.5 | 0.1 | 0.1 | 0.0 | 0.5 | 5.8 | 16 | 20 | 116 |
| Days Below 0 °F/-17.8 °C[7] | ||||||||||||
| 8.2 | 6 | 1.5 | 0 | 0 | 0 | 0 | 0 | 0 | 5 | 0.5 | 4.8 | 21 |
Demographics
| Historical population | |||
|---|---|---|---|
| Census | Pop. | %± | |
| 1880 | 65 | — | |
| 1890 | 98 | 50.8% | |
| 1900 | 810 | 726.5% | |
| 1910 | 1,336 | 64.9% | |
| 1920 | 1,841 | 37.8% | |
| 1930 | 2,435 | 32.3% | |
| 1940 | 3,030 | 24.4% | |
| 1950 | 2,900 | −4.3% | |
| 1960 | 3,377 | 16.4% | |
| 1970 | 3,423 | 1.4% | |
| 1980 | 4,092 | 19.5% | |
| 1990 | 3,868 | −5.5% | |
| 2000 | 5,168 | 33.6% | |
| 2010 | 5,176 | 0.2% | |
| 2020 | 5,600 | 8.2% | |
| 2021 (est.) | 5,617 | [8] | 0.3% |
| U.S. Decennial Census[9] 1790-1960[10] 1900-1990[11] 1990-2000[12] 2010-2020[1] | |||

2000 census
As of the 2000 census,[13] there were 5,168 people, 2,350 households, and 1,438 families in the county. The population density was 3.56/sqmi (1.37/km2). There were 4,708 housing units at an average density of 3.24/sqmi (1.25/km2). The racial makeup of the county was 89.45% White, 7.59% Native American, 0.33% Asian, 0.29% Black or African American, 0.04% Pacific Islander, 0.25% from other races, and 2.05% from two or more races. 0.75% of the population were Hispanic or Latino of any race. 21.6% were of German, 17.7% Norwegian, 11.5% Swedish, 7.2% Irish and 5.4% English ancestry.
There were 2,350 households, of which 24.4% had children under the age of 18 living with them, 52.0% were married couples living together, 6.1% had a female householder with no husband present, and 38.8% were non-families. 32.5% of all households were made up of individuals, and 10.8% had someone living alone who was 65 years of age or older. The average household size was 2.17 and the average family size was 2.73.
The county population contained 20.4% under the age of 18, 5.4% from 18 to 24, 25.8% from 25 to 44, 31.2% from 45 to 64, and 17.2% who were 65 years of age or older. The median age was 44. For every 100 females there were 99.7 males. For every 100 females age 18 and over, there were 98.5 males.
The median income for a household in the county was $36,640, and the median income for a family was $47,132. Males had a median income of $31,211 versus $23,650 for females. The per capita income for the county was $21,775. About 8.1% of families and 10.1% of the population were below the poverty line, including 12.2% of those under age 18 and 6.8% of those age 65 or over.
2020 Census
| Race | Num. | Perc. |
|---|---|---|
| White (NH) | 4,670 | 83.4% |
| Black or African American (NH) | 25 | 0.45% |
| Native American (NH) | 450 | 8.04% |
| Asian (NH) | 48 | 0.9% |
| Pacific Islander (NH) | 1 | 0.02% |
| Other/Mixed (NH) | 283 | 5.1% |
| Hispanic or Latino | 123 | 2.2% |
Communities
City
- Grand Marais (county seat)
Census-designated place
Unincorporated communities
- Croftville
- Grand Portage
- Hovland
- Maple Hill
- Martin Landing
- Mineral Center
- Pigeon River
- Schroeder
- Taconite Harbor
- Tofte
Townships
Unorganized territories
- East Cook
- Grand Portage
- West Cook
Ghost towns
Government and politics
This section does not cite any sources. (June 2022) |
Cook County has generally voted Democratic. In 88% of presidential elections since 1988, the county selected the Democratic nominee. The county was a bellwether in every election from 1916 to 1984, except 1960 and 1976. The county was one of the rare white-majority rural counties to have its margin increase for Joe Biden in 2020 relative to Barack Obama's 2012 margin, with 65% of voters choosing the Democratic nominee.
Elections and officeholders
| Year | Republican | Democratic | Third party | |||
|---|---|---|---|---|---|---|
| No. | % | No. | % | No. | % | |
| 2020 | 1,203 | 31.59% | 2,496 | 65.55% | 109 | 2.86% |
| 2016 | 1,156 | 34.05% | 1,912 | 56.32% | 327 | 9.63% |
| 2012 | 1,221 | 36.75% | 1,993 | 59.99% | 108 | 3.25% |
| 2008 | 1,240 | 37.04% | 2,019 | 60.30% | 89 | 2.66% |
| 2004 | 1,489 | 45.08% | 1,733 | 52.47% | 81 | 2.45% |
| 2000 | 1,295 | 45.92% | 1,171 | 41.52% | 354 | 12.55% |
| 1996 | 1,010 | 39.94% | 1,169 | 46.22% | 350 | 13.84% |
| 1992 | 878 | 33.54% | 1,005 | 38.39% | 735 | 28.07% |
| 1988 | 1,078 | 49.36% | 1,080 | 49.45% | 26 | 1.19% |
| 1984 | 1,219 | 51.63% | 1,129 | 47.82% | 13 | 0.55% |
| 1980 | 1,147 | 50.62% | 871 | 38.44% | 248 | 10.94% |
| 1976 | 1,034 | 48.54% | 1,018 | 47.79% | 78 | 3.66% |
| 1972 | 1,047 | 57.62% | 742 | 40.84% | 28 | 1.54% |
| 1968 | 853 | 49.33% | 777 | 44.94% | 99 | 5.73% |
| 1964 | 764 | 43.86% | 976 | 56.03% | 2 | 0.11% |
| 1960 | 987 | 60.15% | 650 | 39.61% | 4 | 0.24% |
| 1956 | 1,078 | 61.67% | 668 | 38.22% | 2 | 0.11% |
| 1952 | 946 | 65.06% | 503 | 34.59% | 5 | 0.34% |
| 1948 | 674 | 47.94% | 688 | 48.93% | 44 | 3.13% |
| 1944 | 513 | 48.12% | 545 | 51.13% | 8 | 0.75% |
| 1940 | 673 | 49.27% | 686 | 50.22% | 7 | 0.51% |
| 1936 | 387 | 32.14% | 793 | 65.86% | 24 | 1.99% |
| 1932 | 418 | 43.27% | 492 | 50.93% | 56 | 5.80% |
| 1928 | 609 | 72.59% | 219 | 26.10% | 11 | 1.31% |
| 1924 | 471 | 67.97% | 29 | 4.18% | 193 | 27.85% |
| 1920 | 467 | 72.85% | 98 | 15.29% | 76 | 11.86% |
| 1916 | 125 | 34.44% | 162 | 44.63% | 76 | 20.94% |
| 1912 | 30 | 8.62% | 65 | 18.68% | 253 | 72.70% |
| 1908 | 255 | 77.98% | 42 | 12.84% | 30 | 9.17% |
| 1904 | 207 | 82.80% | 31 | 12.40% | 12 | 4.80% |
| 1900 | 81 | 52.60% | 65 | 42.21% | 8 | 5.19% |
| 1896 | 81 | 42.19% | 107 | 55.73% | 4 | 2.08% |
| 1892 | 68 | 51.52% | 19 | 14.39% | 45 | 34.09% |
| 1888 | 24 | 45.28% | 29 | 54.72% | 0 | 0.00% |
| 1884 | 46 | 85.19% | 8 | 14.81% | 0 | 0.00% |
| Position | Name | District | |
|---|---|---|---|
| Commissioner | Robert Svaleson | District 1 | |
| Commissioner | Stacey Hawkins | District 2 | |
| Commissioner and Chairperson | David Mills | District 3 | |
| Commissioner and Vice Chair | Ann Sullivan | District 4 | |
| Commissioner | Ginny Storlie | District 5 | |
| Position | Name | Affiliation | District | |
|---|---|---|---|---|
| Senate | Tom Bakk[17] | Independent | District 3 | |
| House of Representatives | Rob Ecklund[18] | Democrat | District 3A | |
| Position | Name | Affiliation | District | |
|---|---|---|---|---|
| House of Representatives | Pete Stauber[19] | Republican | 8th | |
| Senate | Amy Klobuchar[20] | Democrat | N/A | |
| Senate | Tina Smith[21] | Democrat | N/A | |
See also
- National Register of Historic Places listings in Cook County, Minnesota
References
- "U.S. Census Bureau QuickFacts: Cook County, Minnesota". www.census.gov. United States Census Bureau. Retrieved April 4, 2022.
- "Find a County". National Association of Counties. Archived from the original on May 31, 2011. Retrieved June 7, 2011.
- "Minnesota Place Names". Minnesota Historical Society. Archived from the original on June 20, 2012. Retrieved March 17, 2014.
- Upham, Warren (1920). Minnesota Geographic Names: Their Origin and Historic Significance. Minnesota Historical Society. p. 135.
- Cook County MN Google Maps (accessed March 6, 2019)
- "2010 Census Gazetteer Files". United States Census Bureau. August 22, 2012. Archived from the original on October 19, 2013. Retrieved October 6, 2014.
- "Weatherbase: Historical Weather for Lutsen MN". Retrieved January 9, 2009.
- "Annual Estimates of the Resident Population for Counties: April 1, 2020 to July 1, 2021". Retrieved April 4, 2022.
- "U.S. Decennial Census". United States Census Bureau. Retrieved October 6, 2014.
- "Historical Census Browser". University of Virginia Library. Retrieved October 6, 2014.
- "Population of Counties by Decennial Census: 1900 to 1990". United States Census Bureau. Retrieved October 6, 2014.
- "Census 2000 PHC-T-4. Ranking Tables for Counties: 1990 and 2000" (PDF). United States Census Bureau. Retrieved October 6, 2014.
- "U.S. Census website". United States Census Bureau. Retrieved January 31, 2008.
- "P2 HISPANIC OR LATINO, AND NOT HISPANIC OR LATINO BY RACE – 2020: DEC Redistricting Data (PL 94-171) – Cook County, Minnesota".
- Leip, David. "Atlas of US Presidential Elections". uselectionatlas.org. Retrieved April 17, 2018.
- "County Commissioners". www.co.cook.mn.us. Archived from the original on December 28, 2021. Retrieved December 28, 2021.
- "MN State Senate". www.senate.mn. Retrieved June 24, 2020.
- "Rep. Rob Ecklund (03A) - Minnesota House of Representatives". www.house.leg.state.mn.us. Retrieved June 24, 2020.
- "Representative Pete Stauber". Representative Pete Stauber. Retrieved June 24, 2020.
- "U.S. Senator Amy Klobuchar". www.klobuchar.senate.gov. Retrieved June 24, 2020.
- "Home". Senator Tina Smith. Retrieved June 24, 2020.
External links
- Cook County Government's website
- Mn/DOT – maps of Cook County (Southwest portion, Eastern portion, Northwest portion)
Places adjacent to Cook County, Minnesota | ||||||||||||||||
|---|---|---|---|---|---|---|---|---|---|---|---|---|---|---|---|---|
| ||||||||||||||||
Municipalities and communities of Cook County, Minnesota, United States | ||
|---|---|---|
County seat: Grand Marais | ||
| City |  | |
| Townships | ||
| Unorganized territories |
| |
| CDP | ||
| Unincorporated communities | ||
| Indian reservation |
| |
| Ghost towns | ||
| ||
Authority control | |
|---|---|
| General | |
| National libraries | |
| Other | |
На других языках
[de] Cook County (Minnesota)
Das Cook County[3] ist ein County im US-amerikanischen Bundesstaat Minnesota. Im Jahr 2010 hatte das County 5176 Einwohner und eine Bevölkerungsdichte von 1,4 Einwohnern pro Quadratkilometer.[4] Der Verwaltungssitz (County Seat) ist Grand Marais.[5]- [en] Cook County, Minnesota
[ru] Кук (округ, Миннесота)
Кук (англ. Cook County) — округ в штате Миннесота, США. Окружной центр и единственный город — Гранд-Марей. По переписи 2010 года в округе проживают 5176 человек.Другой контент может иметь иную лицензию. Перед использованием материалов сайта WikiSort.org внимательно изучите правила лицензирования конкретных элементов наполнения сайта.
WikiSort.org - проект по пересортировке и дополнению контента Википедии