world.wikisort.org - United_Kingdom
The City of Milton Keynes is a unitary authority area with borough and city status,[3] in the ceremonial county of Buckinghamshire. It is the northernmost district of the South East England Region. The borough abuts Bedfordshire, Northamptonshire and the remainder of Buckinghamshire.[lower-alpha 1]
City of Milton Keynes | |
|---|---|
City, borough, unitary authority area | |
| Motto(s): By knowledge, design and understanding | |
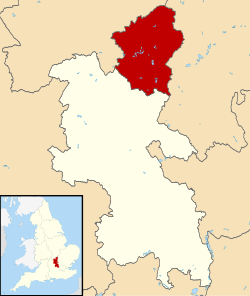 City of Milton Keynes, shown within Buckinghamshire and England | |
| Coordinates: 52°07′N 0°46′W | |
| Sovereign state | United Kingdom |
| Constituent country | England |
| Region | South East England |
| Ceremonial county | Buckinghamshire |
| Admin HQ | Milton Keynes |
| Founded | 1 April 1997 |
| Government | |
| • Type | Unitary authority |
| • Governing body | Milton Keynes City Council |
| • MPs | Iain Stewart (C) (Milton Keynes South) Ben Everitt (C) (Milton Keynes North) |
| Area | |
| • Total | 119 sq mi (309 km2) |
| Population (2011 Census) | |
| • Total | 248,821[1] |
| • Estimate (mid-2019 est.) | 269,457[2] |
| • Rank | 58th (of 309) |
| Time zone | UTC+0 (Greenwich Mean Time) |
| Postcode | |
| Area code | 01908 |
| ONS code | 00MG |
| Website | www |
The principal built-up area in the borough is the Milton Keynes urban area, which accounts for about 20% of its area and 90% of its population. The ONS's provisional return from the 2021 census reports that the population of the borough has reached approximately 287,000.[4]
History
The local authority was created on 1 April 1974 under the Local Government Act 1972, as a District under the (then) Buckinghamshire County Council, by the merger of Bletchley Urban District, Newport Pagnell Urban District, Newport Pagnell Rural District and Wolverton Urban District, together with that part of Wing Rural District within the designated New Town area. The district council applied for and received borough status that year. It was originally one of five non-metropolitan districts of Buckinghamshire. On 1 April 1997, it became a self-governing non-metropolitan county,[5] independent from (the former) Buckinghamshire County Council.[lower-alpha 2]
In August 2022, the council received letters patent giving the Borough the status of a city.[3]
Local government
Arising from the local government elections of May 2021, the borough is governed by a Labour and Liberal Democrat coalition administration. The Conservative Party is the main opposition group.
The political composition of the council is as follows.
| Affiliation | Councillors | |
|---|---|---|
| Conservative Party | 23 | |
| Labour Party | 20 | |
| Liberal Democrats | 14 | |
The 2022 local election did not change the status of the council from 'no overall control'. No political party has had an 'overall majority' on the council since 2006.
Economy
According to data from the Office of National Statistics for 2017, the borough was the highest performing NUTS3 region in the UK outside inner London (which takes the first five places), on the basis of gross value added per head.[6]
Education
Further education in the borough is provided by Milton Keynes College. For higher education, the Open University's headquarters are in Milton Keynes – though, as this is a distance education institution, the only students resident on campus are approximately 200 full-time postgraduates. A campus of the University of Bedfordshire located in Central Milton Keynes, provides conventional undergraduate courses.
Cranfield University is the academic partner in project with Milton Keynes Council to establish a new university, code-named "MK:U", on a reserved site in the city centre.[7] As of January 2022[update], the project is stalled pending assurance of government funding.[8]
Demographics

Population

At the 2011 census, the population of the borough was 248,821.[1] The ONS's provisional return from the 2021 census reports that the population of the borough has reached approximately 287,000.[4]
In the same census, 52.8% of the borough's population registered their religion as Christian and 37.9% as not religious or none given. 4.8% of the population follow Islam and a little over 2.8% are Hindu, with no other religion above one percent.[9]
The borough's population age profile is slightly younger than England's average, with half of the borough's population aged under 35 years old.[9] The 30- to 39-year-olds in the borough formed as the largest 10-year age group of the population with 30- to 34-year-olds being the largest 5-year age group, 22.3% are aged under 16 and just 11.1% are aged over 65 compared.[9]
Levels of educational attainment in the borough are slightly higher than the England average. 18% have no qualifications compared with 22.5% in England, while 28.2% have a degree or higher qualification compared with 27.4% in England.[9]
Ethnicity
In the 2011 census, 80% of the population described their ethnic origin as white, 5.6% as South Asian, 6.8% as black, 3.3% as mixed race, 3.6% as Chinese and other Asian, and 0.6% as 'other ethnic group.[9]
| Ethnic Group | 1991[10] | 2001[11] | 2011[12] | |||
|---|---|---|---|---|---|---|
| Number | % | Number | % | Number | % | |
| White: Total | 166,101 | 94.2% | 187,852 | 90.7% | 199,094 | 80% |
| White: British | – | – | 179,694 | 86.8% | 183,934 | 73.9% |
| White: Irish | – | – | 2,918 | 2,498 | ||
| White: Gypsy or Irish Traveller | – | – | – | – | 72 | |
| White: Other | – | – | 5,240 | 12,590 | 5.1% | |
| Asian or Asian British: Total | 5,982 | 3.4% | 9,406 | 4.5% | 22,782 | 9.2% |
| Asian or Asian British: Indian | 2,861 | 1.6% | 3,967 | 1.9% | 8,106 | 3.3% |
| Asian or Asian British: Pakistani | 822 | 1,682 | 3,851 | |||
| Asian or Asian British: Bangladeshi | 694 | 1,072 | 1,989 | |||
| Asian or Asian British: Chinese | 667 | 1,835 | 2,722 | 1.1% | ||
| Asian or Asian British: Other Asian | 938 | 850 | 6,114 | 2.5% | ||
| Black or Black British: Total | 2,869 | 1.6% | 4,986 | 2.4% | 17,131 | 6.9% |
| Black or Black British: African | 523 | 2,596 | 13,058 | 5.2% | ||
| Black or Black British: Caribbean | 1,665 | 1,956 | 2,524 | |||
| Black or Black British: Other Black | 681 | 434 | 1,549 | |||
| Mixed or British Mixed: Total | – | – | 3,716 | 1.8% | 8,235 | 3.3% |
| Mixed: White and Black Caribbean | – | – | 1,347 | 2,243 | ||
| Mixed: White and Black African | – | – | 477 | 1,597 | ||
| Mixed: White and Asian | – | – | 1,037 | 2,228 | ||
| Mixed: Other Mixed | – | – | 855 | 2,167 | ||
| Other: Total | 1,378 | 0.8% | 1,097 | 0.5% | 1,579 | 0.6% |
| Other: Arab | – | – | – | – | 565 | |
| Other: Any other ethnic group | 1,378 | 0.8% | 1,097 | 0.5% | 1,014 | 0.4% |
| Ethnic minority: Total | 10,229 | 5.8% | 19,205 | 9.3% | 49,727 | 20% |
| Total | 176,330 | 100% | 207,057 | 100% | 248,821 | 100% |
Religion
In the 2011 census, 62% of the population professed a religious belief. Christianity was the largest denomination, with 53% of the total.[9]
| Religion | 2001[13] | 2011[14] | ||
|---|---|---|---|---|
| Number | % | Number | % | |
| Holds religious beliefs | 145,983 | 70.5 | 154,444 | 62.1 |
| 135,715 | 65.5 | 131,352 | 52.8 | |
| 747 | 0.4 | 1,246 | 0.5 | |
| 2,596 | 1.3 | 6,918 | 2.8 | |
| 466 | 0.2 | 427 | 0.2 | |
| 4,843 | 2.3 | 11,913 | 4.8 | |
| 795 | 0.4 | 1,372 | 0.6 | |
| Other religion | 821 | 0.4 | 1,216 | 0.5 |
| (No religion and Religion not stated) | 61,074 | 29.5 | 94,377 | 37.9 |
| No religion | 44,633 | 21.6 | 77,939 | 31.3 |
| Religion not stated | 16,441 | 7.9 | 16,438 | 6.6 |
| Total population | 207,057 | 100.0 | 248,821 | 100.0 |
Housing and home ownership
In 2011, Milton Keynes had the greatest proportion of shared ownership homes in England, 6.1%, compared with second-placed London boroughs of Hounslow and Tower Hamlets with 2.4%. This form of home ownership has been a planning policy of the Council soon after the settled acceptance of all major UK lenders on specified forms of this type of property ownership was agreed in the 2000s decade.
The borough has relatively high home ownership at 72.8% of dwellings with the remaining 16.2% of homes are privately rented and 11.0% are socially rented.[15]
At the 2012, 16.2% of the population lived in flats (apartments), compared with the 22.1% average for England.[9]
Public health
According to Public Health England, "The health of people in Milton Keynes is generally similar to the England average. About 15.1% (8,680) children live in low income families. Life expectancy for both men and women is similar to the England average."[16]
Settlements
Milton Keynes (urban area)
The urban area accounts for about 20% of the borough by area and 90% by population. This is a partial list of the districts of the Milton Keynes urban area.
The City of Milton Keynes is fully parished. These are the parishes, and the districts they contain, that are now elements of the Milton Keynes built-up area as defined by the Office for National Statistics.[17][lower-alpha 3] Bletchley, Fenny Stratford, Woburn Sands, Central Milton Keynes, Newport Pagnell, Wolverton and Stony Stratford are all towns.
- Abbey Hill: Kiln Farm, Two Mile Ash, Wymbush
- Bletchley and Fenny Stratford: Brickfields, Central Bletchley, Denbigh, Mount Farm, Fenny Lock, Granby, Fenny Stratford, Newton Leys, Water Eaton
- Bradwell: Bradville, Bradwell, Bradwell Abbey, Bradwell Common, Bradwell village, Heelands, Rooksley
- Broughton and Milton Keynes (the Village) – a shared parish council: Atterbury, Brook Furlong, Broughton, Fox Milne, Middleton, Milton Keynes, Milton Keynes Village, Northfield, Oakgrove, Pineham
- Campbell Park (civil parish): Fishermead, Newlands, Oldbrook, Springfield, Willen and Willen Lake, Winterhill, The Woolstones
- Central Milton Keynes: Central MK, Campbell Park
- Fairfields
- Great Linford: Bolbeck Park, Blakelands, Conniburrow, Downs Barn, Downhead Park, Giffard Park, Great Linford, Neath Hill, Pennyland, Tongwell, Willen Park
- Kents Hill, Monkston and Brinklow: Brinklow, Kents Hill, Kingston, Monkston
- Loughton and Great Holm: Loughton, Loughton Lodge, Great Holm, Elfield Park, the Bowl
- New Bradwell
- Newport Pagnell
- Shenley Brook End: Emerson Valley, Furzton, Kingsmead, Shenley Brook End, Shenley Lodge, Snelshall, Tattenhoe, Tattenhoe Park, Westcroft
- Shenley Church End: Crownhill, Grange Farm, Hazeley, Medbourne, Oakhill, Oxley Park, Shenley Church End, Woodhill
- Simpson and Ashland: Ashland, Simpson, West Ashland
- Stantonbury: Bancroft/Bancroft Park, Blue Bridge, Bradville, Linford Wood, Stantonbury, Stantonbury Fields
- Stony Stratford: Fullers Slade, Galley Hill, Stony Stratford
- Walton: Caldecotte, Old Farm Park, Tilbrook, Tower Gate, Walnut Tree, Walton, Walton Hall, Walton Park, Wavendon Gate
- Wavendon: Wavendon, Eagle Farm, Glebe Farm
- West Bletchley: Far Bletchley, Old Bletchley, West Bletchley.
- Whitehouse
- Woburn Sands
- Wolverton and Greenleys: Greenleys, Stacey Bushes, Stonebridge, Wolverton, Old Wolverton
- Woughton: Beanhill, Bleak Hall, Coffee Hall, Eaglestone, Leadenhall, Netherfield, Peartree Bridge, Redmoor, Tinkers Bridge (part)
- Old Woughton: Passmore (part of Tinkers Bridge), Woughton on the Green, Woughton Park.
Rest of the borough
The rural area accounts for about 80% of the borough by area and about 10% by population. Olney is a town. These are the extra-urban civil parishes:
- Astwood and Hardmead
- Bow Brickhill
- Caldecote, Calverton, Castlethorpe, Chicheley, Clifton Reynes, Cold Brayfield
- Emberton
- Filgrave
- Gayhurst
- Hanslope, Haversham-cum-Little Linford
- Lathbury, Lavendon, Little Brickhill, Long Street
- Moulsoe
- Newton Blossomville, North Crawley
- Olney
- Ravenstone
- Sherington, Stoke Goldington
- Tyringham
- Warrington, Weston Underwood
Freedom of the City
The following people and military units have received the Freedom of the City (from 2022) or Freedom of the Borough (1982–2021).
Individuals
- Jock Campbell, Baron Campbell of Eskan: 18 March 1982.[18]
- James Marshall: 2009.[18]
- Dame Cleo Laine: 2011.[18]
- Peter Winkelman: 12 November 2015.[19][20]
- (Leah Williamson: planned.[21])
Military Units
- The Royal Green Jackets: 1998.[18]
- The Rifles: 2007.[18] (confirmation)
- 678 (Rifles) Squadron 6 Regiment Army Air Corps: 11 March 2018.[22]
Organisations and businesses
- Red Bull Racing, 2014[18]
References
- UK Census (2011). "Local Area Report – Milton Keynes Local Authority (E06000042)". Nomis. Office for National Statistics. Retrieved 29 December 2018.
- "Population Estimates for UK, England and Wales, Scotland and Northern Ireland, Mid-2019". Office for National Statistics. 6 May 2020. Retrieved 6 May 2020.
- "Crown Office | The Gazette". www.thegazette.co.uk. Retrieved 19 August 2022.
- "Population and household estimates, England and Wales: Census 2021". Office for National Statistics. July 2022.
- "The Buckinghamshire (Borough of Milton Keynes) (Structural Change) Order 1995". Government of the United Kingdom. Retrieved 15 July 2020.
(2) A new county shall be constituted comprising the area of Milton Keynes and shall be named the county of Milton Keynes.
- Statistical bulletin: Regional gross value added (balanced), UK: 1998 to 2017 (table 7) (Report). Office of National Statistics. 12 December 2018.
- "Project Two: MK:U A new University for Milton Keynes". MK2050 Futures Commission. October 2017. Retrieved 6 February 2019.
- "Milton Keynes: New university project for 2023 delayed". BBC News. 7 January 2022. Retrieved 15 February 2022.
- UK Census (2011). "Local Area Report – Milton Keynes Local Authority (E06000042)". Nomis. Office for National Statistics. Retrieved 31 January 2020.
- Data is taken from United Kingdom Casweb Data services of the United Kingdom 1991 Census on Ethnic Data for England, Scotland and Wales (Table 6)
- "Office of National Statistics; 2001 Census Key Statistics". webarchive.nationalarchives.gov.uk. Retrieved 7 September 2021.
- "2011 Census: Ethnic Group, local authorities in England and Wales". webarchive.nationalarchives.gov.uk. Retrieved 15 December 2021.
- "KS007 - Religion - Nomis - 2001". www.nomisweb.co.uk. Retrieved 18 October 2022.
- "KS209EW (Religion) - Nomis - 2011". www.nomisweb.co.uk. Retrieved 18 October 2022.
- 2011 Census Key Statistics: Tenure. Office for National Statistics
- "Local Authority Health Profile 2019: Milton Keynes". Public Health England. 2019. Retrieved 22 August 2020.
- UK Census (2011). "Local Area Report – Milton Keynes Built-up area (E34005056)". Nomis. Office for National Statistics. Retrieved 29 March 2019. (includes map of the built-up area).
- David Tooley (15 May 2020). "Tories want key workers in Milton Keynes to be awarded freedom of the borough". Milton Keynes Citizen. Retrieved 4 August 2020.
- "Football boss 'overwhelmed' by award". BBC News. 22 August 2015.
- "Proud city centre military march to commemorate Freedom of the Borough - Milton Keynes Council". www.milton-keynes.gov.uk.
- "Congratulations to MK's Leah Williamson and The Lionesses". Milton Keynes Council. 1 August 2022.
- "Rifles squadron rewarded for service with 'Freedom of Milton Keynes' honour". ITV News. 11 March 2018.
- The remainder of Buckinghamshire is also Unitary Authority and is controlled by Buckinghamshire Council.
- The existing Buckinghamshire County Council and the non-metropolitan districts of Aylesbury Vale, Chiltern, South Bucks, and Wycombe in Buckinghamshire were replaced by a single unitary authority known as Buckinghamshire Council, on 1 April 2020.
- This list excludes the civil parishes of Aspley Guise and Aspley Heath which, despite being in the contiguous built-up area, are in Central Bedfordshire and thus outside the City of Milton Keynes.
External links
- Milton Keynes Borough Council
- Map on the Milton Keynes Council's website showing civil parishes in the borough.
| Unitary authorities |
|
|---|---|
| Major settlements |
|
| Rivers | |
| Topics |
|
Districts of South East England | ||
|---|---|---|
| Berkshire |  | |
| Buckinghamshire |
| |
| East Sussex | ||
| Hampshire |
| |
| Isle of Wight | ||
| Kent | ||
| Oxfordshire | ||
| Surrey | ||
| West Sussex | ||
| Districts |
|  |
|---|---|---|
| Councils |
| |
| Local elections |
| |
Authority control | |
|---|---|
| General |
|
| Other |
|
На других языках
[de] Borough of Milton Keynes
Milton Keynes ist ein Borough in England. Es entstand 1. April 1974 durch einen Zusammenschluss der Urban Districts Bletchley, Newport Pagnell und Wolverton, dem Newport Pagnell Rural District und Teilen des Wing Rural District.- [en] City of Milton Keynes
[ru] Милтон-Кинс (унитарная единица)
Милтон-Кинс (англ. Milton Keynes) — унитарная единица со статусом района (англ. borough) в Англии, в церемониальном графстве Бакингемшир, самая северная территория региона Юго-Восточная Англия. Административный центр — занимающий треть территории унитарной единицы город Милтон-Кинс, в котором проживает 90 % её населения.Другой контент может иметь иную лицензию. Перед использованием материалов сайта WikiSort.org внимательно изучите правила лицензирования конкретных элементов наполнения сайта.
WikiSort.org - проект по пересортировке и дополнению контента Википедии