world.wikisort.org - USA
Rosebud County is a county in the state of Montana. It was established February 11, 1901, and has Montana vehicle license plate prefix 29.[1] As of the 2020 census, the population was 8,329.[2] Its county seat is Forsyth.[3]
Rosebud County | |
|---|---|
U.S. county | |
 County courthouse in Forsyth | |
 Location within the U.S. state of Montana | |
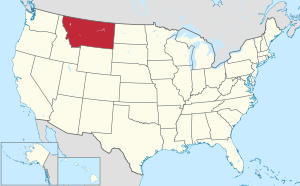 Montana's location within the U.S. | |
| Coordinates: 46°14′N 106°43′W | |
| Country | |
| State | |
| Founded | February 11, 1901 |
| Named for | Rosebud River |
| Seat | Forsyth |
| Largest city | Colstrip |
| Area | |
| • Total | 5,027 sq mi (13,020 km2) |
| • Land | 5,010 sq mi (13,000 km2) |
| • Water | 17 sq mi (40 km2) 0.3% |
| Population (2020) | |
| • Total | 8,329 |
| • Estimate (2021) | 8,124 |
| • Density | 1.7/sq mi (0.64/km2) |
| Time zone | UTC−7 (Mountain) |
| • Summer (DST) | UTC−6 (MDT) |
| Congressional district | At-large |
| Website | rosebudcountymt |
| |
Geography
According to the United States Census Bureau, the county has a total area of 5,027 square miles (13,020 km2), of which 5,010 square miles (13,000 km2) is land and 17 square miles (44 km2) (0.3%) is water.[4] It is the fourth-largest county in Montana by land area and fifth-largest by total area. Part of Custer National Forest is located in the county.
Climate
According to the Köppen Climate Classification system, most of Rosebud County has a cold semi-arid climate, abbreviated "BSk" on climate maps.
| Climate data for Brandenberg, Montana, 1991–2020 normals, extremes 1956–present | |||||||||||||
|---|---|---|---|---|---|---|---|---|---|---|---|---|---|
| Month | Jan | Feb | Mar | Apr | May | Jun | Jul | Aug | Sep | Oct | Nov | Dec | Year |
| Record high °F (°C) | 70 (21) |
72 (22) |
86 (30) |
91 (33) |
101 (38) |
111 (44) |
112 (44) |
111 (44) |
105 (41) |
98 (37) |
81 (27) |
70 (21) |
112 (44) |
| Mean maximum °F (°C) | 56.4 (13.6) |
58.6 (14.8) |
72.7 (22.6) |
82.1 (27.8) |
87.9 (31.1) |
96.4 (35.8) |
103.0 (39.4) |
102.1 (38.9) |
97.5 (36.4) |
84.3 (29.1) |
68.9 (20.5) |
56.4 (13.6) |
104.7 (40.4) |
| Average high °F (°C) | 35.2 (1.8) |
38.8 (3.8) |
50.2 (10.1) |
60.0 (15.6) |
69.5 (20.8) |
79.3 (26.3) |
89.8 (32.1) |
89.1 (31.7) |
77.2 (25.1) |
61.0 (16.1) |
46.5 (8.1) |
36.0 (2.2) |
61.1 (16.1) |
| Daily mean °F (°C) | 22.9 (−5.1) |
26.3 (−3.2) |
36.4 (2.4) |
45.6 (7.6) |
55.1 (12.8) |
64.4 (18.0) |
72.4 (22.4) |
70.8 (21.6) |
60.3 (15.7) |
46.7 (8.2) |
33.9 (1.1) |
24.2 (−4.3) |
46.6 (8.1) |
| Average low °F (°C) | 10.7 (−11.8) |
13.9 (−10.1) |
22.6 (−5.2) |
31.3 (−0.4) |
40.7 (4.8) |
49.4 (9.7) |
55.1 (12.8) |
52.6 (11.4) |
43.5 (6.4) |
32.4 (0.2) |
21.2 (−6.0) |
12.5 (−10.8) |
32.2 (0.1) |
| Mean minimum °F (°C) | −18.0 (−27.8) |
−12.0 (−24.4) |
−1.6 (−18.7) |
14.9 (−9.5) |
25.1 (−3.8) |
37.2 (2.9) |
44.6 (7.0) |
39.8 (4.3) |
29.0 (−1.7) |
14.3 (−9.8) |
−2.4 (−19.1) |
−11.7 (−24.3) |
−26.7 (−32.6) |
| Record low °F (°C) | −36 (−38) |
−40 (−40) |
−41 (−41) |
−2 (−19) |
16 (−9) |
28 (−2) |
34 (1) |
30 (−1) |
19 (−7) |
−12 (−24) |
−32 (−36) |
−44 (−42) |
−44 (−42) |
| Average precipitation inches (mm) | 0.55 (14) |
0.61 (15) |
0.91 (23) |
1.71 (43) |
3.12 (79) |
2.55 (65) |
1.44 (37) |
0.91 (23) |
1.21 (31) |
1.37 (35) |
0.54 (14) |
0.55 (14) |
15.47 (393) |
| Average snowfall inches (cm) | 7.5 (19) |
8.0 (20) |
6.9 (18) |
4.0 (10) |
0.5 (1.3) |
0.0 (0.0) |
0.0 (0.0) |
0.0 (0.0) |
0.0 (0.0) |
1.7 (4.3) |
4.4 (11) |
7.4 (19) |
40.4 (102.6) |
| Average precipitation days (≥ 0.01 in) | 7.3 | 6.9 | 7.4 | 9.0 | 11.0 | 10.0 | 7.1 | 5.4 | 6.1 | 7.1 | 6.1 | 6.3 | 89.7 |
| Average snowy days (≥ 0.1 in) | 6.2 | 5.8 | 3.8 | 1.7 | 0.3 | 0.0 | 0.0 | 0.0 | 0.0 | 1.4 | 3.6 | 5.6 | 28.4 |
| Source 1: NOAA[5] | |||||||||||||
| Source 2: National Weather Service[6] | |||||||||||||
Demographics
| Historical population | |||
|---|---|---|---|
| Census | Pop. | %± | |
| 1910 | 7,985 | — | |
| 1920 | 8,002 | 0.2% | |
| 1930 | 7,347 | −8.2% | |
| 1940 | 6,477 | −11.8% | |
| 1950 | 6,570 | 1.4% | |
| 1960 | 6,187 | −5.8% | |
| 1970 | 6,032 | −2.5% | |
| 1980 | 9,899 | 64.1% | |
| 1990 | 10,505 | 6.1% | |
| 2000 | 9,383 | −10.7% | |
| 2010 | 9,233 | −1.6% | |
| 2020 | 8,329 | −9.8% | |
| 2021 (est.) | 8,124 | [7] | −2.5% |
| U.S. Decennial Census[2][8][9][10][11] 2010-2020[2] | |||
2000 census
As of the 2000 United States census,[12] there were 9,383 people, 3,307 households, and 2,417 families in the county. The population density was 2 people per square mile (1/km2). There were 3,912 housing units at an average density of 1 per square mile (0/km2).
The racial makeup of the county was 64.40% White, 0.23% Black or African American, 32.41% Native American, 0.29% Asian, 0.65% from other races, and 2.01% from two or more races. 2.33% of the population were Hispanic or Latino of any race. 19.8% were of German, 7.2% Irish, 7.1% English and 6.9% Norwegian ancestry. 87.6% spoke English, 8.3% Cheyenne, 1.9% Spanish and 1.0% German as their first language.
There were 3,307 households, out of which 38.70% had children under the age of 18 living with them, 56.00% were married couples living together, 11.80% had a female householder with no husband present, and 26.90% were non-families. 24.30% of all households were made up of individuals, and 8.40% had someone living alone who was 65 years of age or older. The average household size was 2.81 and the average family size was 3.34.
The county population contained 33.50% under the age of 18, 7.20% from 18 to 24, 25.70% from 25 to 44, 24.80% from 45 to 64, and 8.90% who were 65 years of age or older. The median age was 34 years. For every 100 females there were 100.90 males. For every 100 females age 18 and over, there were 99.20 males.
The median income for a household in the county was $35,898, and the median income for a family was $41,631. Males had a median income of $38,688 versus $20,640 for females. The per capita income for the county was $15,032. About 17.80% of families and 22.40% of the population were below the poverty line, including 31.80% of those under age 18 and 15.10% of those age 65 or over.
2010 census
As of the 2010 United States census, there were 9,233 people, 3,395 households, and 2,318 families residing in the county.[13] The population density was 1.8 inhabitants per square mile (0.69/km2). There were 4,057 housing units at an average density of 0.8 per square mile (0.31/km2).[14] The racial makeup of the county was 61.3% white, 34.7% American Indian, 0.5% Asian, 0.3% black or African American, 0.5% from other races, and 2.8% from two or more races. Those of Hispanic or Latino origin made up 3.4% of the population.[13] In terms of ancestry, 25.0% were American, 19.0% were German, 6.9% were English, and 6.6% were Irish.[15]
Of the 3,395 households, 36.4% had children under the age of 18 living with them, 51.3% were married couples living together, 10.6% had a female householder with no husband present, 31.7% were non-families, and 27.6% of all households were made up of individuals. The average household size was 2.70 and the average family size was 3.32. The median age was 36.5 years.[13]
The median income for a household in the county was $44,776 and the median income for a family was $56,282. Males had a median income of $52,500 versus $28,306 for females. The per capita income for the county was $19,844. About 13.6% of families and 18.5% of the population were below the poverty line, including 24.7% of those under age 18 and 21.3% of those age 65 or over.[16]
Politics
Rosebud County voters have selected the Republican Party candidate in 60% of national elections since 1980 (as of 2020).
| Year | Republican | Democratic | Third party | |||
|---|---|---|---|---|---|---|
| No. | % | No. | % | No. | % | |
| 2020 | 2,486 | 65.89% | 1,199 | 31.78% | 88 | 2.33% |
| 2016 | 2,253 | 65.25% | 987 | 28.58% | 213 | 6.17% |
| 2012 | 2,004 | 56.88% | 1,422 | 40.36% | 97 | 2.75% |
| 2008 | 1,768 | 46.40% | 1,919 | 50.37% | 123 | 3.23% |
| 2004 | 1,982 | 55.29% | 1,520 | 42.40% | 83 | 2.32% |
| 2000 | 1,826 | 53.35% | 1,394 | 40.72% | 203 | 5.93% |
| 1996 | 1,413 | 38.37% | 1,681 | 45.64% | 589 | 15.99% |
| 1992 | 1,130 | 28.84% | 1,669 | 42.60% | 1,119 | 28.56% |
| 1988 | 1,822 | 48.05% | 1,869 | 49.29% | 101 | 2.66% |
| 1984 | 2,413 | 54.82% | 1,920 | 43.62% | 69 | 1.57% |
| 1980 | 1,875 | 54.46% | 1,167 | 33.89% | 401 | 11.65% |
| 1976 | 1,538 | 51.16% | 1,413 | 47.01% | 55 | 1.83% |
| 1972 | 1,486 | 63.23% | 777 | 33.06% | 87 | 3.70% |
| 1968 | 1,190 | 56.42% | 711 | 33.71% | 208 | 9.86% |
| 1964 | 1,105 | 47.61% | 1,212 | 52.22% | 4 | 0.17% |
| 1960 | 1,386 | 57.77% | 1,002 | 41.77% | 11 | 0.46% |
| 1956 | 1,516 | 63.01% | 890 | 36.99% | 0 | 0.00% |
| 1952 | 1,734 | 67.92% | 805 | 31.53% | 14 | 0.55% |
| 1948 | 1,106 | 50.71% | 1,031 | 47.27% | 44 | 2.02% |
| 1944 | 1,154 | 50.15% | 1,114 | 48.41% | 33 | 1.43% |
| 1940 | 1,252 | 46.77% | 1,399 | 52.26% | 26 | 0.97% |
| 1936 | 866 | 32.43% | 1,624 | 60.82% | 180 | 6.74% |
| 1932 | 1,027 | 36.63% | 1,646 | 58.70% | 131 | 4.67% |
| 1928 | 1,519 | 59.38% | 1,025 | 40.07% | 14 | 0.55% |
| 1924 | 1,115 | 49.12% | 259 | 11.41% | 896 | 39.47% |
| 1920 | 2,239 | 68.22% | 873 | 26.60% | 170 | 5.18% |
| 1916 | 1,337 | 43.95% | 1,608 | 52.86% | 97 | 3.19% |
| 1912 | 392 | 33.91% | 313 | 27.08% | 451 | 39.01% |
| 1908 | 515 | 66.03% | 235 | 30.13% | 30 | 3.85% |
| 1904 | 460 | 75.66% | 134 | 22.04% | 14 | 2.30% |
Communities
Cities
Census-designated places
Unincorporated communities
- Ahles
- Angela
- Bascom
- Carterville
- Hathaway
- Ingomar
- Jimtown
- Rock Springs
- Sumatra
- Thurlow
Former communities
- Vananda
Notable people
- Heather Sharfeddin – novelist, grew up in Rosebud County
- Frederic Remington (1861-1909) - famous western artist who lived at times, as late as 1901, on the Charles Boals ranch near Birney and the Cheyenne Indian Reservation where he hunted, painted and sketched.[19]
See also
- List of lakes in Rosebud County, Montana
- List of mountains in Rosebud County, Montana
- National Register of Historic Places listings in Rosebud County, Montana
Footnotes
- "Montana History Wiki: Montana Counties". Archived from the original on November 19, 2015. Retrieved November 19, 2015.
- "State & County QuickFacts". U.S. Census Bureau. Retrieved February 15, 2022.
- "Find a County". National Association of Counties. Retrieved June 7, 2011.
- "2010 Census Gazetteer Files". U.S. Census Bureau. August 22, 2012. Archived from the original on December 5, 2014. Retrieved November 29, 2014.
- "U.S. Climate Normals Quick Access". National Oceanic and Atmospheric Administration. Retrieved August 5, 2022.
- "NOAA Online Weather Data". National Weather Service. Retrieved August 5, 2022.
- "Annual Estimates of the Resident Population for Counties: April 1, 2020 to July 1, 2021". Retrieved June 26, 2022.
- "U.S. Decennial Census". U.S. Census Bureau. Retrieved November 29, 2014.
- "Historical Census Browser". University of Virginia Library. Retrieved November 29, 2014.
- "Population of Counties by Decennial Census: 1900 to 1990". U.S. Census Bureau. Retrieved November 29, 2014.
- "Census 2000 PHC-T-4. Ranking Tables for Counties: 1990 and 2000" (PDF). U.S. Census Bureau. Retrieved November 29, 2014.
- "U.S. Census website". U.S. Census Bureau. Retrieved January 31, 2008.
- "Profile of General Population and Housing Characteristics: 2010 Demographic Profile Data". U.S. Census Bureau. Archived from the original on February 13, 2020. Retrieved January 10, 2016.
- "Population, Housing Units, Area, and Density: 2010 - County". U.S. Census Bureau. Archived from the original on February 13, 2020. Retrieved January 10, 2016.
- "Selected Social Characteristics in the US, 2006–2010 American Community Survey 5-Year Estimates". US Census Bureau. Archived from the original on February 13, 2020. Retrieved January 10, 2016.
- "Selected Economic Characteristics: 2006–2010 American Community Survey 5-Year Estimates". US Census Bureau. Archived from the original on February 13, 2020. Retrieved January 10, 2016.
- Leip, David. "Atlas of US Presidential Elections". uselectionatlas.org. Retrieved April 3, 2018.
- The leading "other" candidate, Progressive Theodore Roosevelt, received 368 votes, while Socialist candidate Eugene Debs received 80 votes, and Write-in candidate Eugene Chafin received 3 votes.
- "Rosebud County news. [volume] (Forsyth, Mont.) 1901-1906, October 03, 1901, Image 5". October 3, 1901.
External links
State of Montana | |
|---|---|
Helena (capital) | |
| Topics | |
| Society |
|
| Regions |
|
| Largest cities | |
| Counties |
|
Places adjacent to Rosebud County, Montana | ||||||||||||||||
|---|---|---|---|---|---|---|---|---|---|---|---|---|---|---|---|---|
| ||||||||||||||||
Municipalities and communities of Rosebud County, Montana, United States | ||
|---|---|---|
County seat: Forsyth | ||
| Cities | 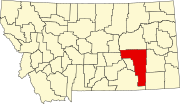 | |
| CDPs | ||
| Other communities |
| |
| Indian reservation | ||
| Ghost town |
| |
| Footnotes | ‡This populated place also has portions in an adjacent county or counties | |
| ||
Authority control | |
|---|---|
| General | |
| National libraries | |
На других языках
[de] Rosebud County
Rosebud County[3] ist ein County im Bundesstaat Montana der Vereinigten Staaten. Der Sitz der Countyverwaltung (County Seat) befindet sich in Forsyth.- [en] Rosebud County, Montana
[ru] Роузбад (округ)
Округ Роузбад (англ. Rosebud County) располагается в штате Монтана, США. Официально образован в 1901 году. По состоянию на 2010 год, численность населения составляла 9 233 человека.Другой контент может иметь иную лицензию. Перед использованием материалов сайта WikiSort.org внимательно изучите правила лицензирования конкретных элементов наполнения сайта.
WikiSort.org - проект по пересортировке и дополнению контента Википедии