world.wikisort.org - USA
Silver Bow County is a county in the U.S. state Montana. As of the 2020 census, the population was 35,133.[1] Its county seat is Butte.[2] In 1977, the city and county governments consolidated to form the single entity of Butte-Silver Bow. Additionally, the town of Walkerville is a separate municipality from Butte and is within the county.
Silver Bow County | |
|---|---|
Consolidated city-county | |
| Butte-Silver Bow County | |
 Mike Mansfield Federal Building and United States Courthouse in Butte. | |
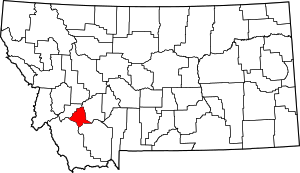 Location within the U.S. state of Montana | |
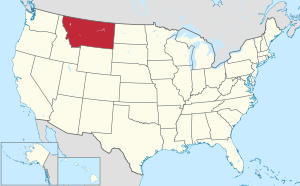 Montana's location within the U.S. | |
| Coordinates: 45°54′N 112°40′W | |
| Country | |
| State | |
| Founded | February 16, 1881 |
| Named for | Silver Bow Creek |
| Seat | Butte |
| Largest city | Butte |
| Area | |
| • Total | 719 sq mi (1,860 km2) |
| • Land | 718 sq mi (1,860 km2) |
| • Water | 0.6 sq mi (2 km2) 0.08% |
| Population (2020) | |
| • Total | 35,133 |
| • Estimate (2021) | 35,411 |
| • Density | 49/sq mi (19/km2) |
| Time zone | UTC−7 (Mountain) |
| • Summer (DST) | UTC−6 (MDT) |
| Congressional district | At-large |
| Website | co |
| |
Silver Bow County comprises the Butte-Silver Bow, MT Micropolitan Statistical Area.
Geography
According to the United States Census Bureau, the county has an area of 719 square miles (1,860 km2), of which 718 square miles (1,860 km2) is land and 0.6 square miles (1.6 km2) (0.08%) is water.[3] It is Montana's smallest county by area.
Major highways
 Interstate 15
 Interstate 90
 Interstate 115
 U.S. Highway 10 (Former)
 U.S. Highway 91
 Montana Highway 2
 Montana Highway 41
 Montana Highway 43
 Montana Highway 55
Adjacent counties
- Deer Lodge County - northwest
- Jefferson County - east
- Madison County - south
- Beaverhead County - southwest
National protected areas
- Beaverhead National Forest (part)
- Deerlodge National Forest (part)
Demographics
| Historical population | |||
|---|---|---|---|
| Census | Pop. | %± | |
| 1890 | 23,744 | — | |
| 1900 | 47,635 | 100.6% | |
| 1910 | 56,848 | 19.3% | |
| 1920 | 60,313 | 6.1% | |
| 1930 | 56,969 | −5.5% | |
| 1940 | 53,209 | −6.6% | |
| 1950 | 48,422 | −9.0% | |
| 1960 | 46,454 | −4.1% | |
| 1970 | 41,981 | −9.6% | |
| 1980 | 38,092 | −9.3% | |
| 1990 | 33,941 | −10.9% | |
| 2000 | 34,606 | 2.0% | |
| 2010 | 34,200 | −1.2% | |
| 2020 | 35,133 | 2.7% | |
| 2021 (est.) | 35,411 | [4] | 0.8% |
| U.S. Decennial Census[5] 1790-1960[6] 1900-1990[7] 1990-2000[8] 2010-2020[1] | |||
2000 census
As of the 2000 United States census, there were 34,606 people, 14,432 households, and 8,933 families living in the county. The population density was 48 people per square mile (19/km2). There were 16,176 housing units at an average density of 22 per square mile (9/km2). The racial makeup of the county was 95.35% White, 0.16% Black or African American, 2.03% Native American, 0.43% Asian, 0.06% Pacific Islander, 0.59% from other races, and 1.37% from two or more races. 2.75% of the population were Hispanic or Latino of any race. 25.4% were of Irish, 14.2% German, 11.4% English and 5.9% Italian ancestry.
There were 14,432 households, out of which 28.00% had children under the age of 18 living with them, 47.80% were married couples living together, 10.50% had a female householder with no husband present, and 38.10% were non-families. 32.80% of all households were made up of individuals, and 13.70% had someone living alone who was 65 years of age or older. The average household size was 2.32 and the average family size was 2.97.
The county population contained 23.70% under the age of 18, 9.60% from 18 to 24, 26.70% from 25 to 44, 24.00% from 45 to 64, and 16.00% who were 65 years of age or older. The median age was 39 years. For every 100 females there were 97.80 males. For every 100 females age 18 and over, there were 96.30 males.
The median income for a household in the county was $30,402, and the median income for a family was $40,018. Males had a median income of $31,295 versus $21,610 for females. The per capita income for the county was $17,009. About 10.70% of families and 14.90% of the population were below the poverty line, including 19.20% of those under age 18 and 8.90% of those age 65 or over.
2010 census
As of the 2010 United States census, there were 34,200 people, 14,932 households, and 8,651 families living in the county.[9] The population density was 47.6 inhabitants per square mile (18.4/km2). There were 16,717 housing units at an average density of 23.3 per square mile (9.0/km2).[10] The racial makeup of the county was 94.4% white, 1.9% American Indian, 0.5% Asian, 0.3% black or African American, 0.1% Pacific islander, 0.7% from other races, and 2.1% from two or more races. Those of Hispanic or Latino origin made up 3.7% of the population.[9] In terms of ancestry, 32.6% were Irish, 23.3% were German, 16.1% were English, 8.3% were Italian, 6.9% were Norwegian, and 3.2% were American.[11]
Of the 14,932 households, 26.0% had children under the age of 18 living with them, 42.2% were married couples living together, 10.6% had a female householder with no husband present, 42.1% were non-families, and 35.1% of all households were made up of individuals. The average household size was 2.22 and the average family size was 2.87. The median age was 41.3 years.[9]
The median income for a household in the county was $37,986 and the median income for a family was $52,288. Males had a median income of $41,491 versus $28,132 for females. The per capita income for the county was $21,357. About 11.6% of families and 17.8% of the population were below the poverty line, including 23.1% of those under age 18 and 8.9% of those age 65 or over.[12]
Government and politics
As with neighboring Deer Lodge County are the two most consistently Democratic counties in Montana when it comes to Presidential elections, with Silver Bow County last voting Republican in 1956 for Dwight D. Eisenhower.
Over the last century, Silver Bow County has voted only once for a Republican gubernatorial candidate (Marc Racicot during the 1996 Montana election).[13] Silver Bow County has not supported any Republican at all for the U.S. Senate since at least 1928.[13]
Silver Bow County is in Senate District 37 and in HR District 73.[14]
| Year | Republican | Democratic | Third party | |||
|---|---|---|---|---|---|---|
| No. | % | No. | % | No. | % | |
| 2020 | 7,745 | 41.51% | 10,392 | 55.70% | 521 | 2.79% |
| 2016 | 6,376 | 38.76% | 8,619 | 52.39% | 1,457 | 8.86% |
| 2012 | 5,430 | 32.41% | 10,857 | 64.79% | 469 | 2.80% |
| 2008 | 4,818 | 28.27% | 11,676 | 68.51% | 548 | 3.22% |
| 2004 | 6,381 | 39.67% | 9,307 | 57.86% | 396 | 2.46% |
| 2000 | 6,299 | 37.71% | 8,967 | 53.68% | 1,437 | 8.60% |
| 1996 | 3,909 | 22.11% | 11,199 | 63.35% | 2,569 | 14.53% |
| 1992 | 3,491 | 19.24% | 9,960 | 54.89% | 4,695 | 25.87% |
| 1988 | 5,043 | 30.22% | 11,422 | 68.45% | 222 | 1.33% |
| 1984 | 6,637 | 36.85% | 11,095 | 61.60% | 278 | 1.54% |
| 1980 | 7,301 | 37.68% | 9,721 | 50.17% | 2,355 | 12.15% |
| 1976 | 7,506 | 39.28% | 11,377 | 59.53% | 227 | 1.19% |
| 1972 | 7,967 | 39.05% | 11,704 | 57.36% | 733 | 3.59% |
| 1968 | 5,488 | 27.98% | 12,626 | 64.36% | 1,503 | 7.66% |
| 1964 | 4,873 | 22.94% | 15,751 | 74.16% | 615 | 2.90% |
| 1960 | 7,290 | 34.40% | 13,754 | 64.91% | 146 | 0.69% |
| 1956 | 11,619 | 50.31% | 11,475 | 49.69% | 0 | 0.00% |
| 1952 | 10,196 | 43.46% | 13,114 | 55.90% | 148 | 0.63% |
| 1948 | 7,305 | 34.24% | 12,715 | 59.60% | 1,315 | 6.16% |
| 1944 | 7,610 | 36.17% | 13,228 | 62.87% | 202 | 0.96% |
| 1940 | 7,932 | 30.82% | 17,467 | 67.88% | 335 | 1.30% |
| 1936 | 4,528 | 20.02% | 17,697 | 78.23% | 398 | 1.76% |
| 1932 | 6,792 | 31.11% | 13,626 | 62.41% | 1,416 | 6.49% |
| 1928 | 9,456 | 44.81% | 11,228 | 53.21% | 419 | 1.99% |
| 1924 | 6,520 | 34.66% | 5,393 | 28.66% | 6,901 | 36.68% |
| 1920 | 10,074 | 55.36% | 6,394 | 35.14% | 1,730 | 9.51% |
| 1916 | 6,757 | 31.36% | 13,084 | 60.72% | 1,706 | 7.92% |
| 1912 | 2,232 | 18.76% | 4,542 | 38.18% | 5,122 | 43.06% |
| 1908 | 4,618 | 33.82% | 6,255 | 45.80% | 2,783 | 20.38% |
| 1904 | 5,149 | 36.07% | 5,686 | 39.83% | 3,439 | 24.09% |
| 1900 | 3,873 | 23.75% | 12,101 | 74.19% | 336 | 2.06% |
| 1896 | 1,275 | 11.29% | 9,992 | 88.46% | 29 | 0.26% |
| 1892 | 3,251 | 38.58% | 2,648 | 31.43% | 2,527 | 29.99% |
Communities
City
- Butte (county seat)
Town
- Walkerville
Unincorporated communities
See also
- List of lakes in Silver Bow County, Montana
- List of mountains in Silver Bow County, Montana
- National Register of Historic Places listings in Silver Bow County, Montana
References
- "State & County QuickFacts". U.S. Census Bureau. Retrieved February 13, 2022.
- "Find a County". National Association of Counties. Retrieved June 7, 2011.
- "2010 Census Gazetteer Files". U.S. Census Bureau. August 22, 2012. Archived from the original on December 5, 2014. Retrieved November 30, 2014.
- "Annual Estimates of the Resident Population for Counties: April 1, 2020 to July 1, 2021". Retrieved June 26, 2022.
- "U.S. Decennial Census". U.S. Census Bureau. Retrieved November 30, 2014.
- "Historical Census Browser". University of Virginia Library. Retrieved November 30, 2014.
- "Population of Counties by Decennial Census: 1900 to 1990". US Census Bureau. Retrieved November 30, 2014.
- "Census 2000 PHC-T-4. Ranking Tables for Counties: 1990 and 2000" (PDF). U.S. Census Bureau. Retrieved November 30, 2014.
- "Profile of General Population and Housing Characteristics: 2010 Demographic Profile Data". US Census Bureau. Archived from the original on February 13, 2020. Retrieved January 10, 2016.
- "Population, Housing Units, Area, and Density: 2010 - County". US Census Bureau. Archived from the original on February 13, 2020. Retrieved January 10, 2016.
- "Selected Social Characteristics in the US – 2006-2010 American Community Survey 5-Year Estimates". US Census Bureau. Archived from the original on February 13, 2020. Retrieved January 10, 2016.
- "Selected Economic Characteristics – 2006-2010 American Community Survey 5-Year Estimates". U.S. Census Bureau. Archived from the original on February 13, 2020. Retrieved January 10, 2016.
- David Leip. "Presidential Atlas". uselectionatlas.org. Retrieved April 2, 2018.
- "Montana Legislative Information and District Maps". nris.mt.gov. Retrieved April 2, 2018.
- High View MT Google Maps (accessed January 7, 2019)
- Williamsburg MT Google Maps (accessed January 7, 2019)
External links
Places adjacent to Silver Bow County, Montana | ||||||||||||||||
|---|---|---|---|---|---|---|---|---|---|---|---|---|---|---|---|---|
| ||||||||||||||||
Municipalities and communities of Silver Bow County, Montana, United States | ||
|---|---|---|
County seat: Butte | ||
| City |  | |
| Town |
| |
| Unincorporated communities |
| |
| Ghost town |
| |
| Neighborhoods |
| |
| Footnotes | ‡This populated place also has portions in an adjacent county or counties | |
| ||
Helena (capital) | ||
| Topics |
|  Seal of Montana |
| Society |
| |
| Regions |
| |
| Largest cities | ||
| Counties |
| |
Authority control | |
|---|---|
| General | |
| National libraries | |
| Other | |
На других языках
- [en] Silver Bow County, Montana
[ru] Силвер-Боу (округ)
Силвер-Боу (англ. Silver Bow County) — округ штата Монтана в Соединённых Штатах Америки. Столица округа — город Бьютт (с 1977 года).Другой контент может иметь иную лицензию. Перед использованием материалов сайта WikiSort.org внимательно изучите правила лицензирования конкретных элементов наполнения сайта.
WikiSort.org - проект по пересортировке и дополнению контента Википедии