world.wikisort.org - USA
Wibaux County (/ˈwiːboʊ/ WEE-boh) is a county in the U.S. state of Montana. As of the 2020 census, the population was 937,[2] making it the fourth-least populous county in Montana. Its county seat is Wibaux.[3]
Wibaux County | |
|---|---|
U.S. county | |
 Wibaux County Courthouse in Wibaux | |
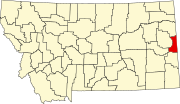
 Location within the U.S. state of Montana | |
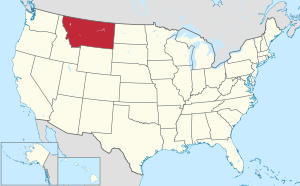 Montana's location within the U.S. | |
| Coordinates: 46°58′N 104°15′W | |
| Country | |
| State | |
| Founded | August 17, 1914[1] |
| Seat | Wibaux |
| Largest town | Wibaux |
| Area | |
| • Total | 890 sq mi (2,300 km2) |
| • Land | 889 sq mi (2,300 km2) |
| • Water | 0.7 sq mi (2 km2) 0.07% |
| Population (2020) | |
| • Total | 937 |
| • Estimate (2021) | 934 |
| • Density | 1.1/sq mi (0.41/km2) |
| Time zone | UTC−7 (Mountain) |
| • Summer (DST) | UTC−6 (MDT) |
| Congressional district | At-large |
| |
History
Wibaux County was created by the Montana Legislature in 1914 from parts of Dawson, Fallon, and Richland Counties. The name comes from Pierre Wibaux (1858–1913),[4] a late 19th-century cattle baron and friend of Theodore Roosevelt whose ranch was just over the border (in Dakota Territory, later North Dakota). According to legend, Pierre Wibaux's cowboys surrounded the town of Mingusville, and wouldn't let anyone enter or leave town unless they signed a petition changing the name of the town to Wibaux. Upon his death, his ashes were spread over a hill west of Wibaux. Today, a statue of Pierre Wibaux stands on that hill.
Geography
According to the United States Census Bureau, the county has a total area of 890 square miles (2,300 km2), of which 889 square miles (2,300 km2) is land and 0.7 square miles (1.8 km2) (0.07%) is water.[5] It is the third-smallest county in Montana by land area.
Adjacent counties
- Richland County – north
- Dawson County – northwest
- Prairie County – west
- Fallon County – south
- Golden Valley County, North Dakota – east
- McKenzie County, North Dakota – northeast
Major highways
 Interstate 94
 U.S. Highway 10 (Former)
 Montana Highway 7
 S-261
S-261
National protected area
- Lamesteer National Wildlife Refuge
Demographics
| Historical population | |||
|---|---|---|---|
| Census | Pop. | %± | |
| 1920 | 3,113 | — | |
| 1930 | 2,767 | −11.1% | |
| 1940 | 2,161 | −21.9% | |
| 1950 | 1,907 | −11.8% | |
| 1960 | 1,698 | −11.0% | |
| 1970 | 1,465 | −13.7% | |
| 1980 | 1,476 | 0.8% | |
| 1990 | 1,191 | −19.3% | |
| 2000 | 1,068 | −10.3% | |
| 2010 | 1,017 | −4.8% | |
| 2020 | 937 | −7.9% | |
| 2021 (est.) | 934 | [6] | −0.3% |
| U.S. Decennial Census[7] 1790-1960[8] 1900-1990[9] 1990-2000[10] 2010-2020[2] | |||
2000 census
As of the 2000 census,[11] there were 1,068 people, 421 households, and 287 families in the county. The population density was less than 1 person per square mile (1/km2). There were 587 housing units at an average density of 0.7/square mile (0.3/km2). The racial makeup of the county was 98.03% White, 0.19% Black or African American, 0.47% Native American, 0.19% Asian, 0.28% from other races, and 0.84% from two or more races. 0.37% of the population were Hispanic or Latino of any race. 32.4% were of German, 18.7% Norwegian, 13.3% Polish, 6.7% English and 6.4% Irish ancestry.
There were 421 households, out of which 29.20% had children under the age of 18 living with them, 58.20% were married couples living together, 5.90% had a female householder with no husband present, and 31.80% were non-families. 29.00% of all households were made up of individuals, and 15.90% had someone living alone who was 65 years of age or older. The average household size was 2.45 and the average family size was 3.02.
The county population contained 25.80% under the age of 18, 5.80% from 18 to 24, 22.50% from 25 to 44, 24.30% from 45 to 64, and 21.50% who were 65 years of age or older. The median age was 42 years. For every 100 females there were 92.40 males. For every 100 females age 18 and over, there were 92.20 males.
The median income for a household in the county was $28,224, and the median income for a family was $34,265. Males had a median income of $22,750 versus $18,667 for females. The per capita income for the county was $16,121. About 8.60% of families and 15.30% of the population were below the poverty line, including 18.70% of those under age 18 and 12.60% of those age 65 or over.
2010 census
As of the 2010 census, there were 1,017 people, 457 households, and 281 families in the county.[12] The population density was 1.1 inhabitants per square mile (0.42/km2). There were 538 housing units at an average density of 0.6/square mile (0.2/km2).[13] The racial makeup of the county was 97.6% white, 0.5% Asian, 0.4% American Indian, 0.3% from other races, and 1.2% from two or more races. Those of Hispanic or Latino origin made up 1.3% of the population.[12] In terms of ancestry, 46.3% were German, 13.7% were Polish, 13.4% were Irish, 12.1% were American, 9.5% were English, 8.0% were Norwegian, and 5.3% were Dutch.[14]
Of the 457 households, 24.1% had children under the age of 18 living with them, 50.1% were married couples living together, 6.1% had a female householder with no husband present, 38.5% were non-families, and 35.4% of all households were made up of individuals. The average household size was 2.17 and the average family size was 2.80. The median age was 49.0 years.[12]
The median income for a household in the county was $40,417 and the median income for a family was $51,354. Males had a median income of $43,438 versus $24,821 for females. The per capita income for the county was $22,579. About 7.2% of families and 11.8% of the population were below the poverty line, including 22.7% of those under age 18 and 12.8% of those age 65 or over.[15]
Politics
Wibaux County voters are reliably Republican. Since 1964 they have selected the Democratic Party candidate in only one national election (as of 2016).
| Year | Republican | Democratic | Third party | |||
|---|---|---|---|---|---|---|
| No. | % | No. | % | No. | % | |
| 2020 | 516 | 86.29% | 77 | 12.88% | 5 | 0.84% |
| 2016 | 463 | 85.58% | 55 | 10.17% | 23 | 4.25% |
| 2012 | 421 | 77.39% | 98 | 18.01% | 25 | 4.60% |
| 2008 | 379 | 67.32% | 146 | 25.93% | 38 | 6.75% |
| 2004 | 407 | 72.68% | 144 | 25.71% | 9 | 1.61% |
| 2000 | 369 | 71.24% | 121 | 23.36% | 28 | 5.41% |
| 1996 | 284 | 46.33% | 197 | 32.14% | 132 | 21.53% |
| 1992 | 234 | 38.55% | 195 | 32.13% | 178 | 29.32% |
| 1988 | 358 | 56.92% | 258 | 41.02% | 13 | 2.07% |
| 1984 | 423 | 64.98% | 216 | 33.18% | 12 | 1.84% |
| 1980 | 450 | 61.56% | 219 | 29.96% | 62 | 8.48% |
| 1976 | 308 | 44.57% | 352 | 50.94% | 31 | 4.49% |
| 1972 | 390 | 55.48% | 283 | 40.26% | 30 | 4.27% |
| 1968 | 347 | 52.98% | 252 | 38.47% | 56 | 8.55% |
| 1964 | 308 | 41.79% | 427 | 57.94% | 2 | 0.27% |
| 1960 | 387 | 48.01% | 419 | 51.99% | 0 | 0.00% |
| 1956 | 431 | 52.50% | 390 | 47.50% | 0 | 0.00% |
| 1952 | 556 | 62.82% | 324 | 36.61% | 5 | 0.56% |
| 1948 | 421 | 46.52% | 471 | 52.04% | 13 | 1.44% |
| 1944 | 432 | 50.29% | 425 | 49.48% | 2 | 0.23% |
| 1940 | 461 | 44.20% | 576 | 55.23% | 6 | 0.58% |
| 1936 | 362 | 31.18% | 790 | 68.04% | 9 | 0.78% |
| 1932 | 445 | 35.54% | 798 | 63.74% | 9 | 0.72% |
| 1928 | 583 | 56.27% | 448 | 43.24% | 5 | 0.48% |
| 1924 | 505 | 56.93% | 189 | 21.31% | 193 | 21.76% |
| 1920 | 692 | 71.64% | 223 | 23.08% | 51 | 5.28% |
| 1916 | 466 | 42.13% | 585 | 52.89% | 55 | 4.97% |
Communities
Town
- Wibaux (county seat)
Unincorporated communities
See also
- List of lakes in Wibaux County, Montana
- List of mountains in Wibaux County, Montana
- National Register of Historic Places listings in Wibaux County, Montana
References
- "Montana County Formation Table". genealogytrails.com. Retrieved April 3, 2018.
- "State & County QuickFacts". United States Census Bureau. Retrieved March 23, 2022.
- "Find a County". National Association of Counties. Retrieved June 7, 2011.
- "Montana Place Names Companion". Montana Place Names From Alzada to Zortman. Montana Historical Society Research Center. Retrieved May 9, 2011.
- "2010 Census Gazetteer Files". United States Census Bureau. August 22, 2012. Archived from the original on December 5, 2014. Retrieved November 30, 2014.
- "Annual Estimates of the Resident Population for Counties: April 1, 2020 to July 1, 2021". Retrieved June 26, 2022.
- "United States Decennial Census". United States Census Bureau. Retrieved November 30, 2014.
- "Historical Census Browser". University of Virginia Library. Retrieved November 30, 2014.
- "Population of Counties by Decennial Census: 1900 to 1990". United States Census Bureau. Retrieved November 30, 2014.
- "Census 2000 PHC-T-4. Ranking Tables for Counties: 1990 and 2000" (PDF). United States Census Bureau. Retrieved November 30, 2014.
- "United States Census website". United States Census Bureau. Retrieved January 31, 2008.
- "Profile of General Population and Housing Characteristics: 2010 Demographic Profile Data". United States Census Bureau. Archived from the original on February 13, 2020. Retrieved January 10, 2016.
- "Population, Housing Units, Area, and Density: 2010 - County". United States Census Bureau. Archived from the original on February 13, 2020. Retrieved January 10, 2016.
- "Selected Social Characteristics in the US – 2006-2010 American Community Survey 5-Year Estimates". United States Census Bureau. Archived from the original on February 13, 2020. Retrieved January 10, 2016.
- "Selected Economic Characteristics – 2006-2010 American Community Survey 5-Year Estimates". United States Census Bureau. Archived from the original on February 13, 2020. Retrieved January 10, 2016.
- Leip, David. "Atlas of US Presidential Elections". uselectionatlas.org. Retrieved April 3, 2018.
- St Phillip MT Google Maps (accessed January 7, 2019)
Places adjacent to Wibaux County, Montana | ||||||||||||||||
|---|---|---|---|---|---|---|---|---|---|---|---|---|---|---|---|---|
| ||||||||||||||||
Municipalities and communities of Wibaux County, Montana, United States | ||
|---|---|---|
County seat: Wibaux | ||
| Town |
|  |
| Unincorporated communities |
| |
| ||
Helena (capital) | ||
| Topics |
|  Seal of Montana |
| Society |
| |
| Regions |
| |
| Largest cities | ||
| Counties |
| |
Authority control | |
|---|---|
| General |
|
| National libraries | |
На других языках
- [en] Wibaux County, Montana
[ru] Уибо (округ)
Уибо (англ. Wibaux County) — один из 56 округов штата Монтана (США).Другой контент может иметь иную лицензию. Перед использованием материалов сайта WikiSort.org внимательно изучите правила лицензирования конкретных элементов наполнения сайта.
WikiSort.org - проект по пересортировке и дополнению контента Википедии