world.wikisort.org - USA
Powell County is a county in the U.S. state of Montana. As of the 2020 census, the population was 6,946.[2] Its county seat is Deer Lodge.[3]
Powell County | |
|---|---|
U.S. county | |
 Powell County Courthouse, Deer Lodge | |
 Location within the U.S. state of Montana | |
 Montana's location within the U.S. | |
| Coordinates: 46°51′N 112°56′W | |
| Country | |
| State | |
| Founded | February 2, 1901[1] |
| Named for | Mount Powell, which was named in turn for John Wesley Powell |
| Seat | Deer Lodge |
| Largest city | Deer Lodge |
| Area | |
| • Total | 2,333 sq mi (6,040 km2) |
| • Land | 2,326 sq mi (6,020 km2) |
| • Water | 6.3 sq mi (16 km2) 0.3% |
| Population (2020) | |
| • Total | 6,946 |
| • Estimate (2021) | 6,999 |
| • Density | 3.0/sq mi (1.1/km2) |
| Time zone | UTC−7 (Mountain) |
| • Summer (DST) | UTC−6 (MDT) |
| Congressional district | At-large |
| Website | www |
| |
Geography
According to the United States Census Bureau, the county has a total area of 2,332.7 square miles (6,042 km2), of which 2,326.4 square miles (6,025 km2) is land and 6.3 square miles (16 km2) (0.3%) is water.[4]
Major highways
 Interstate 90
 U.S. Route 10 (Former)
 U.S. Route 12
 Montana Highway 141
 Montana Highway 200
Adjacent counties
- Flathead County - north
- Lewis and Clark County - east
- Jefferson County - southeast
- Deer Lodge County - south
- Granite County - southwest
- Missoula County - west
National protected areas
- Beaverhead-Deerlodge National Forest (part)
- Flathead National Forest (part)
- Grant-Kohrs Ranch National Historic Site
- Helena National Forest (part)
- Lolo National Forest (part)
- Bob Marshall Wilderness Area (part)
- Scapegoat Wilderness Area (part)
Demographics
| Historical population | |||
|---|---|---|---|
| Census | Pop. | %± | |
| 1910 | 5,904 | — | |
| 1920 | 6,909 | 17.0% | |
| 1930 | 6,202 | −10.2% | |
| 1940 | 6,152 | −0.8% | |
| 1950 | 6,301 | 2.4% | |
| 1960 | 7,002 | 11.1% | |
| 1970 | 6,660 | −4.9% | |
| 1980 | 6,958 | 4.5% | |
| 1990 | 6,620 | −4.9% | |
| 2000 | 7,180 | 8.5% | |
| 2010 | 7,027 | −2.1% | |
| 2020 | 6,946 | −1.2% | |
| 2021 (est.) | 6,999 | [5] | 0.8% |
| U.S. Decennial Census[6] 1790-1960[7] 1900-1990[8] 1990-2000[9] 2010-2020[2] | |||
2000 census
As of the 2000 United States census,[10] there were 7,180 people, 2,422 households, and 1,634 families in the county. The population density was 3 people per square mile (1/km2). There were 2,930 housing units at an average density of 1 per square mile (0/km2). The racial makeup of the county was 92.52% White, 0.50% Black or African American, 3.51% Native American, 0.43% Asian, 0.74% from other races, and 2.30% from two or more races. 1.95% of the population were Hispanic or Latino of any race. 25.0% were of German, 13.6% Irish, 9.7% English, 7.4% American and 5.8% Norwegian ancestry.
There were 2,422 households, out of which 29.50% had children under the age of 18 living with them, 55.50% were married couples living together, 7.70% had a female householder with no husband present, and 32.50% were non-families. 28.60% of all households were made up of individuals, and 13.30% had someone living alone who was 65 years of age or older. The average household size was 2.39 and the average family size was 2.93.
The county population contained 21.20% under the age of 18, 7.80% from 18 to 24, 30.80% from 25 to 44, 26.20% from 45 to 64, and 14.00% who were 65 years of age or older. The median age was 40 years. For every 100 females there were 143.20 males. For every 100 females age 18 and over, there were 151.40 males.
The median income for a household in the county was $30,625, and the median income for a family was $35,836. Males had a median income of $26,366 versus $20,457 for females. The per capita income for the county was $13,816. About 10.20% of families and 12.60% of the population were below the poverty line, including 16.20% of those under age 18 and 6.00% of those age 65 or over.
2010 census
As of the 2010 United States census, there were 7,027 people, 2,466 households, and 1,582 families in the county.[11] The population density was 3.0 inhabitants per square mile (1.2/km2). There were 3,105 housing units at an average density of 1.3 per square mile (0.50/km2).[12] The racial makeup of the county was 92.4% white, 4.4% American Indian, 1.0% black or African American, 0.5% Asian, 0.4% from other races, and 1.3% from two or more races. Those of Hispanic or Latino origin made up 1.7% of the population.[11] In terms of ancestry, 27.9% were German, 19.1% were Irish, 14.6% were English, 8.5% were Norwegian, and 4.7% were American.[13]
Of the 2,466 households, 26.5% had children under the age of 18 living with them, 50.8% were married couples living together, 8.8% had a female householder with no husband present, 35.8% were non-families, and 32.2% of all households were made up of individuals. The average household size was 2.23 and the average family size was 2.79. The median age was 45.1 years.[11]
The median income for a household in the county was $39,851 and the median income for a family was $45,339. Males had a median income of $30,163 versus $24,837 for females. The per capita income for the county was $17,849. About 12.3% of families and 17.3% of the population were below the poverty line, including 32.4% of those under age 18 and 13.0% of those age 65 or over.[14]
Government and infrastructure
The current Montana State Prison facility is located in an unincorporated area in the county, near Deer Lodge.[15]
Powell County voters have supported Republican Party candidates in every national election since 1964.
| Year | Republican | Democratic | Third party | |||
|---|---|---|---|---|---|---|
| No. | % | No. | % | No. | % | |
| 2020 | 2,355 | 74.08% | 752 | 23.66% | 72 | 2.26% |
| 2016 | 2,029 | 72.62% | 551 | 19.72% | 214 | 7.66% |
| 2012 | 1,806 | 65.03% | 888 | 31.98% | 83 | 2.99% |
| 2008 | 1,683 | 59.81% | 1,021 | 36.28% | 110 | 3.91% |
| 2004 | 1,993 | 70.42% | 761 | 26.89% | 76 | 2.69% |
| 2000 | 1,971 | 69.60% | 638 | 22.53% | 223 | 7.87% |
| 1996 | 1,274 | 45.47% | 952 | 33.98% | 576 | 20.56% |
| 1992 | 1,058 | 36.01% | 989 | 33.66% | 891 | 30.33% |
| 1988 | 1,574 | 56.31% | 1,174 | 42.00% | 47 | 1.68% |
| 1984 | 1,877 | 62.32% | 1,066 | 35.39% | 69 | 2.29% |
| 1980 | 1,770 | 59.14% | 883 | 29.50% | 340 | 11.36% |
| 1976 | 1,610 | 54.56% | 1,302 | 44.12% | 39 | 1.32% |
| 1972 | 1,720 | 59.68% | 1,050 | 36.43% | 112 | 3.89% |
| 1968 | 1,301 | 47.50% | 1,206 | 44.03% | 232 | 8.47% |
| 1964 | 1,140 | 37.50% | 1,896 | 62.37% | 4 | 0.13% |
| 1960 | 1,497 | 49.49% | 1,522 | 50.31% | 6 | 0.20% |
| 1956 | 1,683 | 58.09% | 1,214 | 41.91% | 0 | 0.00% |
| 1952 | 1,783 | 57.85% | 1,281 | 41.56% | 18 | 0.58% |
| 1948 | 1,163 | 43.49% | 1,427 | 53.37% | 84 | 3.14% |
| 1944 | 1,100 | 41.59% | 1,527 | 57.73% | 18 | 0.68% |
| 1940 | 1,116 | 38.46% | 1,765 | 60.82% | 21 | 0.72% |
| 1936 | 799 | 27.42% | 2,060 | 70.69% | 55 | 1.89% |
| 1932 | 1,031 | 34.42% | 1,869 | 62.40% | 95 | 3.17% |
| 1928 | 1,568 | 59.80% | 1,031 | 39.32% | 23 | 0.88% |
| 1924 | 982 | 40.39% | 559 | 22.99% | 890 | 36.61% |
| 1920 | 1,345 | 57.19% | 787 | 33.46% | 220 | 9.35% |
| 1916 | 939 | 39.75% | 1,340 | 56.73% | 83 | 3.51% |
| 1912 | 335 | 23.18% | 545 | 37.72% | 565 | 39.10% |
| 1908 | 599 | 49.63% | 560 | 46.40% | 48 | 3.98% |
| 1904 | 721 | 60.54% | 422 | 35.43% | 48 | 4.03% |
Communities
City
- Deer Lodge (county seat)
Census-designated places
Other unincorporated communities
See also
- List of lakes in Powell County, Montana
- List of mountains in Powell County, Montana
- National Register of Historic Places listings in Powell County, Montana
References
- Powell County History
- "U.S. Census website". United States Census Bureau. Retrieved February 18, 2022.
- "Find a County". National Association of Counties. Retrieved June 7, 2011.
- "2010 Census Gazetteer Files". U.S. Census Bureau. August 22, 2012. Archived from the original on December 5, 2014. Retrieved November 29, 2014.
- "Annual Estimates of the Resident Population for Counties: April 1, 2020 to July 1, 2021". Retrieved June 26, 2022.
- "US Decennial Census". U.S. Census Bureau. Retrieved November 29, 2014.
- "Historical Census Browser". University of Virginia Library. Retrieved November 29, 2014.
- "Population of Counties by Decennial Census: 1900 to 1990". U.S. Census Bureau. Retrieved November 29, 2014.
- "Census 2000 PHC-T-4. Ranking Tables for Counties: 1990 and 2000" (PDF). U.S. Census Bureau. Retrieved November 29, 2014.
- "U.S. Census website". US Census Bureau. Retrieved January 31, 2008.
- "Profile of General Population and Housing Characteristics: 2010 Demographic Profile Data". U.S. Census Bureau. Archived from the original on February 13, 2020. Retrieved January 10, 2016.
- "Population, Housing Units, Area, and Density: 2010 - County". US Census Bureau. Archived from the original on February 13, 2020. Retrieved January 10, 2016.
- "Selected Social Characteristics in the US – 2006-2010 American Community Survey 5-Year Estimates". US Census Bureau. Archived from the original on February 13, 2020. Retrieved January 10, 2016.
- "Selected Economic Characteristics – 2006-2010 American Community Survey 5-Year Estimates". U.S. Census Bureau. Archived from the original on February 13, 2020. Retrieved January 10, 2016.
- Montana State Prison Archived November 19, 2010, at the Wayback Machine. Montana Department of Corrections. Retrieved on December 2, 2010. "Address: 400 Conley Lake Road; Deer Lodge, MT; 59722"
- Leip, David. "Atlas of US Presidential Elections". uselectionatlas.org. Retrieved April 3, 2018.
- The leading "other" candidate, Progressive Theodore Roosevelt, received 418 votes, while Socialist candidate Eugene Debs received 147 votes.
- Danielsville MT Google Maps (accessed January 4, 2019)
- Jens MT Google Maps (accessed January 4, 2019)
- Pioneer MT Google Maps (accessed January 4, 2019)
- Wall City MT Google Maps (accessed January 4, 2019)
External links
- Grant-Kohrs Ranch National Historic Site
- Montana State Prison
- Clark Fork Watershed Education Program
- Old Montana Prison Museums
- Powell County Chamber of Commerce
- Powell County Website
Places adjacent to Powell County, Montana | ||||||||||||||||
|---|---|---|---|---|---|---|---|---|---|---|---|---|---|---|---|---|
| ||||||||||||||||
Municipalities and communities of Powell County, Montana, United States | ||
|---|---|---|
County seat: Deer Lodge | ||
| City | 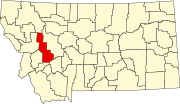 | |
| CDPs | ||
| Other community |
| |
| ||
State of Montana | |
|---|---|
Helena (capital) | |
| Topics |
|
| Society |
|
| Regions |
|
| Largest cities | |
| Counties |
|
Authority control | |
|---|---|
| General | |
| National libraries | |
На других языках
[de] Powell County (Montana)
Powell County[1] ist ein County im Bundesstaat Montana der Vereinigten Staaten. Der Sitz der Countyverwaltung (County Seat) befindet sich in Deer Lodge.- [en] Powell County, Montana
[ru] Пауэлл (округ, Монтана)
Округ Пауэлл (англ. Powell County) располагается в штате Монтана, США. Официально образован в 1901 году. По состоянию на 2010 год, численность населения составляла 7 027 человек.Другой контент может иметь иную лицензию. Перед использованием материалов сайта WikiSort.org внимательно изучите правила лицензирования конкретных элементов наполнения сайта.
WikiSort.org - проект по пересортировке и дополнению контента Википедии