world.wikisort.org - USA
Phillips County is a county in the U.S. state of Montana. As of the 2020 census, the population was 4,217.[1] Its county seat is Malta.[2] Before February 5, 1915, Phillips County was part of Blaine County, and before 1912 both were part of Chouteau County.[3] It was named for rancher and state senator Benjamin D. Phillips.
Phillips County | |
|---|---|
U.S. county | |
 Phillips County Courthouse in Malta | |
 Location within the U.S. state of Montana | |
 Montana's location within the U.S. | |
| Coordinates: 48°16′N 107°55′W | |
| Country | |
| State | |
| Founded | February 5, 1915 |
| Seat | Malta |
| Largest city | Malta |
| Area | |
| • Total | 5,212 sq mi (13,500 km2) |
| • Land | 5,140 sq mi (13,300 km2) |
| • Water | 72 sq mi (190 km2) 1.4% |
| Population (2020) | |
| • Total | 4,217 |
| • Estimate (2021) | 4,192 |
| • Density | 0.81/sq mi (0.31/km2) |
| Time zone | UTC−7 (Mountain) |
| • Summer (DST) | UTC−6 (MDT) |
| Congressional district | At-large |
| |
Its northern boundary is the Canada–United States border with Saskatchewan. The Missouri River defines its southern boundary.
Geography
According to the United States Census Bureau, the county has a total area of 5,212 square miles (13,500 km2), of which 5,140 square miles (13,300 km2) is land and 72 square miles (190 km2) (1.4%) is water.[4] It is the second-largest county in Montana by land area and third-largest by total area.
Adjacent counties and rural municipalities
- Blaine County - west
- Fergus County - southwest
- Petroleum County - south
- Garfield County - southeast
- Valley County - east
- Rural Municipality (RM) of Lone Tree No. 18, Saskatchewan (SK) - north
- RM of Val Marie No. 17, SK - north
- RM of Mankota No. 45, SK - northeast
National protected areas
- Bowdoin National Wildlife Refuge
- Charles M. Russell National Wildlife Refuge (part)
- Hewitt Lake National Wildlife Refuge
- UL Bend National Wildlife Refuge
- Upper Missouri River Breaks National Monument (part)
Demographics
| Historical population | |||
|---|---|---|---|
| Census | Pop. | %± | |
| 1920 | 9,311 | — | |
| 1930 | 8,208 | −11.8% | |
| 1940 | 7,892 | −3.8% | |
| 1950 | 6,334 | −19.7% | |
| 1960 | 6,027 | −4.8% | |
| 1970 | 5,386 | −10.6% | |
| 1980 | 5,367 | −0.4% | |
| 1990 | 5,163 | −3.8% | |
| 2000 | 4,601 | −10.9% | |
| 2010 | 4,253 | −7.6% | |
| 2020 | 4,217 | −0.8% | |
| 2021 (est.) | 4,192 | [5] | −0.6% |
| U.S. Decennial Census[6] 1790-1960[7] 1900-1990[8] 1990-2000[9] 2010-2020[1] | |||
2000 census
As of the 2000 United States census,[10] there were 4,601 people, 1,848 households, and 1,241 families in the county. The population density was <1/km2 (<1/sq mi). There were 2,502 housing units at an average density of <1/km2 (<1/sq mi). The racial makeup of the county was 89.44% White, 0.15% Black or African American, 7.61% Native American, 0.33% Asian, 0.02% Pacific Islander, 0.37% from other races, and 2.09% from two or more races. 1.15% of the population were Hispanic or Latino of any race. 25.3% were of German, 19.0% Norwegian, 7.6% Irish and 6.5% English ancestry. 97.0% spoke English and 2.5% German as their first language.
There were 1,848 households, out of which 31.90% had children under the age of 18 living with them, 57.20% were married couples living together, 6.80% had a female householder with no husband present, and 32.80% were non-families. 29.10% of all households were made up of individuals, and 14.60% had someone living alone who was 65 years of age or older. The average household size was 2.45 and the average family size was 3.03.
The county population contained 27.30% under the age of 18, 5.50% from 18 to 24, 24.50% from 25 to 44, 25.10% from 45 to 64, and 17.60% who were 65 years of age or older. The median age was 41 years. For every 100 females there were 100.40 males. For every 100 women age 18 and over, there were 95.60 men.
The median income for a household in the county was $28,702, and the median income for a family was $37,529. Males had a median income of $25,132 versus $20,274 for females. The per capita income for the county was $15,058. About 13.80% of families and 18.30% of the population were below the poverty line, including 23.10% of those under age 18 and 12.10% of those age 65 or over.
2010 census
As of the 2010 United States census, there were 4,253 people, 1,819 households, and 1,159 families residing in the county.[11] The population density was 0.8 inhabitants per square mile (0.31/km2). There were 2,335 housing units at an average density of 0.5 per square mile (0.19/km2).[12] The racial makeup of the county was 87.0% white, 8.3% American Indian, 0.2% Asian, 0.4% from other races, and 4.0% from two or more races. Those of Hispanic or Latino origin made up 1.9% of the population.[11] In terms of ancestry, 26.2% were Norwegian, 24.3% were German, 13.4% were Irish, 10.1% were American, and 9.0% were English.[13]
Of the 1,819 households, 27.6% had children under the age of 18 living with them, 52.9% were married couples living together, 7.4% had a female householder with no husband present, 36.3% were non-families, and 32.2% of all households were made up of individuals. The average household size was 2.27 and the average family size was 2.86. The median age was 46.8 years.[11]
The median income for a household in the county was $36,453 and the median income for a family was $55,362. Males had a median income of $41,826 versus $26,417 for females. The per capita income for the county was $24,227. About 11.4% of families and 13.5% of the population were below the poverty line, including 17.1% of those under age 18 and 4.8% of those age 65 or over.[14]
Politics
From its creation until 1964, voters of Phillips County were fairly balanced; they selected Democratic Party candidates in 58% of national elections. After 1964 the Republican presidential candidate has garnered the county's vote in every election.
| Year | Republican | Democratic | Third party | |||
|---|---|---|---|---|---|---|
| No. | % | No. | % | No. | % | |
| 2020 | 1,936 | 81.28% | 416 | 17.46% | 30 | 1.26% |
| 2016 | 1,723 | 79.36% | 318 | 14.65% | 130 | 5.99% |
| 2012 | 1,688 | 75.76% | 471 | 21.14% | 69 | 3.10% |
| 2008 | 1,423 | 67.03% | 638 | 30.05% | 62 | 2.92% |
| 2004 | 1,677 | 77.28% | 456 | 21.01% | 37 | 1.71% |
| 2000 | 1,727 | 77.51% | 423 | 18.99% | 78 | 3.50% |
| 1996 | 1,392 | 55.44% | 705 | 28.08% | 414 | 16.49% |
| 1992 | 1,026 | 39.09% | 634 | 24.15% | 965 | 36.76% |
| 1988 | 1,462 | 60.26% | 905 | 37.30% | 59 | 2.43% |
| 1984 | 1,934 | 70.35% | 787 | 28.63% | 28 | 1.02% |
| 1980 | 1,723 | 64.95% | 745 | 28.08% | 185 | 6.97% |
| 1976 | 1,347 | 54.18% | 1,117 | 44.93% | 22 | 0.88% |
| 1972 | 1,659 | 64.88% | 828 | 32.38% | 70 | 2.74% |
| 1968 | 1,353 | 51.41% | 1,100 | 41.79% | 179 | 6.80% |
| 1964 | 1,242 | 43.47% | 1,612 | 56.42% | 3 | 0.11% |
| 1960 | 1,457 | 49.81% | 1,455 | 49.74% | 13 | 0.44% |
| 1956 | 1,605 | 52.94% | 1,427 | 47.06% | 0 | 0.00% |
| 1952 | 1,771 | 58.70% | 1,224 | 40.57% | 22 | 0.73% |
| 1948 | 964 | 37.52% | 1,506 | 58.62% | 99 | 3.85% |
| 1944 | 1,089 | 42.82% | 1,435 | 56.43% | 19 | 0.75% |
| 1940 | 1,110 | 32.98% | 2,225 | 66.10% | 31 | 0.92% |
| 1936 | 850 | 24.33% | 2,555 | 73.13% | 89 | 2.55% |
| 1932 | 1,127 | 33.90% | 2,054 | 61.79% | 143 | 4.30% |
| 1928 | 1,671 | 59.09% | 1,135 | 40.13% | 22 | 0.78% |
| 1924 | 1,236 | 46.69% | 473 | 17.87% | 938 | 35.44% |
| 1920 | 1,693 | 67.13% | 648 | 25.69% | 181 | 7.18% |
| 1916 | 999 | 42.42% | 1,252 | 53.16% | 104 | 4.42% |
Communities
City
- Malta (county seat)
Towns
Census-designated places
Other unincorporated communities
See also

- List of lakes in Phillips County, Montana
- List of mountains in Phillips County, Montana
- National Register of Historic Places listings in Phillips County MT
References
- "State & County QuickFacts". U.S. Census Bureau. Retrieved March 4, 2022.
- "Find a County". National Association of Counties. Retrieved June 7, 2011.
- Koschmann, A.H.; M.H. Bergendahl (1968). "Principal Gold-Producing Districts of the United States, Phillips County Montana Gold Production". United States Geological Survey. Retrieved February 17, 2008.
- "2010 Census Gazetteer Files". U.S. Census Bureau. August 22, 2012. Archived from the original on December 5, 2014. Retrieved November 29, 2014.
- "Annual Estimates of the Resident Population for Counties: April 1, 2020 to July 1, 2021". Retrieved June 26, 2022.
- "U.S. Decennial Census". United States Census Bureau. Retrieved November 29, 2014.
- "Historical Census Browser". University of Virginia Library. Retrieved November 29, 2014.
- "Population of Counties by Decennial Census: 1900 to 1990". U.S. Census Bureau. Retrieved November 29, 2014.
- "Census 2000 PHC-T-4. Ranking Tables for Counties: 1990 and 2000" (PDF). U.S. Census Bureau. Retrieved November 29, 2014.
- "U.S. Census website". U.S. Census Bureau. Retrieved January 31, 2008.
- "Profile of General Population and Housing Characteristics: 2010 Demographic Profile Data". U.S. Census Bureau. Archived from the original on February 13, 2020. Retrieved January 10, 2016.
- "Population, Housing Units, Area, and Density: 2010 - County". US Census Bureau. Archived from the original on February 13, 2020. Retrieved January 10, 2016.
- "Selected Social Characteristics in the US – 2006-2010 American Community Survey 5-Year Estimates". US Census Bureau. Archived from the original on February 13, 2020. Retrieved January 10, 2016.
- "Selected Economic Characteristics – 2006-2010 American Community Survey 5-Year Estimates". U.S. Census Bureau. Archived from the original on February 13, 2020. Retrieved January 10, 2016.
- Leip, David. "Atlas of US Presidential Elections". uselectionatlas.org. Retrieved April 3, 2018.
- Bowdoin MT Google Maps (accessed January 4, 2019)
- Caldwell MT Google Maps (accessed January 4, 2019)
- Cole MT Google Maps (accessed January 4, 2019)
- Content MT Google Maps (accessed January 4, 2019)
- Cree Crossing MT Google Maps (accessed January 4, 2019)
- Jordan Crossing MT Google Maps (accessed January 4, 2019)
- Tattnall MT Google Maps (accessed January 4, 2019)
- Wagner MT Google Maps (accessed January 4, 2019)
External links
Further reading
- Kane, Joseph Nathan; Charles Curry Aiken (2004). The American Counties: Origins of County Names, Dates of Creation, and Population Data, 1950-2000. Scarecrow Press. p. 236. ISBN 0-8108-5036-2.
Places adjacent to Phillips County, Montana | ||||||||||||||||
|---|---|---|---|---|---|---|---|---|---|---|---|---|---|---|---|---|
| ||||||||||||||||
Municipalities and communities of Phillips County, Montana, United States | ||
|---|---|---|
County seat: Malta | ||
| City | 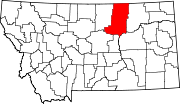 | |
| Towns | ||
| CDPs | ||
| Other communities | ||
| Indian reservations |
| |
| Footnotes | ‡This populated place also has portions in an adjacent county or counties | |
| ||
State of Montana | |
|---|---|
Helena (capital) | |
| Topics |
|
| Society |
|
| Regions |
|
| Largest cities | |
| Counties |
|
Authority control | |
|---|---|
| General |
|
| National libraries | |
| Other | |
На других языках
[de] Phillips County (Montana)
Das Phillips County[1] ist ein County im Bundesstaat Montana der Vereinigten Staaten. Der Sitz der Countyverwaltung (County Seat) befindet sich in Malta.- [en] Phillips County, Montana
[ru] Филлипс (округ, Монтана)
Округ Филлипс (англ. Phillips County) располагается в штате Монтана, США. Официально образован в 1913 году. По состоянию на 2010 год, численность населения составляла 4 253 человека.Другой контент может иметь иную лицензию. Перед использованием материалов сайта WikiSort.org внимательно изучите правила лицензирования конкретных элементов наполнения сайта.
WikiSort.org - проект по пересортировке и дополнению контента Википедии