world.wikisort.org - USA
Valley County is a county in the U.S. state of Montana. Valley County was created in 1893 with area partitioned from Dawson County.[1] As of the 2020 census, the population was 7,578.[2] Its county seat is Glasgow.[3] It is located on the Canada–United States border with Saskatchewan.
Valley County | |
|---|---|
U.S. county | |
 Valley County Courthouse in Glasgow | |
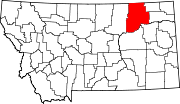
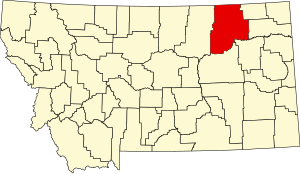 Location within the U.S. state of Montana | |
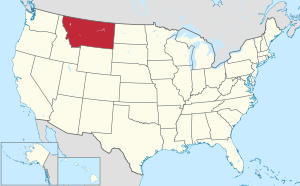 Montana's location within the U.S. | |
| Coordinates: 48°22′N 106°40′W | |
| Country | |
| State | |
| Founded | 1893 |
| Seat | Glasgow |
| Largest city | Glasgow |
| Area | |
| • Total | 5,062 sq mi (13,110 km2) |
| • Land | 4,926 sq mi (12,760 km2) |
| • Water | 136 sq mi (350 km2) 2.7% |
| Population (2020) | |
| • Total | 7,578 |
| • Estimate (2021) | 7,537 |
| • Density | 1.5/sq mi (0.58/km2) |
| Time zone | UTC−7 (Mountain) |
| • Summer (DST) | UTC−6 (MDT) |
| Congressional district | At-large |
| Website | valleycountymt |
| |
Geography
According to the United States Census Bureau, the county has a total area of 5,062 square miles (13,110 km2), of which 4,926 square miles (12,760 km2) is land and 136 square miles (350 km2) (2.7%) is water.[4] It is Montana's fourth-largest county by total area.
Major highways
 U.S. Highway 2
 Montana Highway 24
 Montana Highway 42
 Montana Highway 117
 Montana Secondary Highway 248
Adjacent counties and rural municipalities
- Phillips County - west
- Garfield County - south
- McCone County - south
- Roosevelt County - east
- Daniels County - east
- Rural Municipality (RM) of Mankota No. 45, Saskatchewan (SK) - north
- RM of Waverley No. 44, SK - north
- RM of Old Post No. 43, SK - north
National protected area
- Charles M. Russell National Wildlife Refuge (part)
Economy
Agriculture is the major economic activity of Valley County. The US Air Force operated Glasgow Air Force Base at St. Marie until 1976, which was a strong influence on the local economy until its closure.
Demographics
| Historical population | |||
|---|---|---|---|
| Census | Pop. | %± | |
| 1900 | 4,355 | — | |
| 1910 | 13,630 | 213.0% | |
| 1920 | 11,542 | −15.3% | |
| 1930 | 11,181 | −3.1% | |
| 1940 | 15,181 | 35.8% | |
| 1950 | 11,353 | −25.2% | |
| 1960 | 17,080 | 50.4% | |
| 1970 | 11,471 | −32.8% | |
| 1980 | 10,250 | −10.6% | |
| 1990 | 8,239 | −19.6% | |
| 2000 | 7,675 | −6.8% | |
| 2010 | 7,369 | −4.0% | |
| 2020 | 7,578 | 2.8% | |
| 2021 (est.) | 7,537 | [5] | −0.5% |
| U.S. Decennial Census[6] 1790-1960[7] 1900-1990[8] 1990-2000[9] 2010-2020[2] | |||
2000 census
As of the 2000 United States census,[10] there were 7,675 people, 3,150 households, and 2,129 families living in the county. The population density was 2 people per square mile (1/km2). There were 4,847 housing units at an average density of 1.0/square mile (0.4/km2). The racial makeup of the county was 88.14% White, 0.13% Black or African American, 9.42% Native American, 0.25% Asian, 0.01% Pacific Islander, 0.26% from other races, and 1.79% from two or more races. 0.78% of the population were Hispanic or Latino of any race. 28.2% were of German, 24.0% Norwegian, 6.4% American, 6.0% English and 5.5% Irish ancestry.
There were 3,150 households, out of which 29.70% had children under the age of 18 living with them, 55.50% were married couples living together, 8.20% had a female householder with no husband present, and 32.40% were non-families. 29.30% of all households were made up of individuals, and 12.00% had someone living alone who was 65 years of age or older. The average household size was 2.38 and the average family size was 2.93.
The county population contained 25.10% under the age of 18, 6.00% from 18 to 24, 24.30% from 25 to 44, 25.60% from 45 to 64, and 19.00% who were 65 years of age or older. The median age was 42 years. For every 100 females there were 98.20 males. For every 100 females age 18 and over, there were 95.10 males.
The median income for a household in the county was $30,979, and the median income for a family was $39,044. Males had a median income of $27,233 versus $17,686 for females. The per capita income for the county was $16,246. About 9.50% of families and 13.50% of the population were below the poverty line, including 15.40% of those under age 18 and 14.40% of those age 65 or over.
2010 census
As of the 2010 United States census, there were 7,369 people, 3,198 households, and 1,997 families living in the county.[11] The population density was 1.5 inhabitants per square mile (0.58/km2). There were 4,879 housing units at an average density of 1.0/square mile (0.4/km2).[12] The racial makeup of the county was 87.0% white, 9.8% American Indian, 0.5% Asian, 0.2% black or African American, 0.3% from other races, and 2.1% from two or more races. Those of Hispanic or Latino origin made up 1.2% of the population.[11] In terms of ancestry, 33.4% were German, 27.9% were Norwegian, 12.4% were Irish, 10.3% were English, and 6.8% were American.[13]
Of the 3,198 households, 26.9% had children under the age of 18 living with them, 50.3% were married couples living together, 8.0% had a female householder with no husband present, 37.6% were non-families, and 33.4% of all households were made up of individuals. The average household size was 2.26 and the average family size was 2.88. The median age was 46.4 years.[11]
The median income for a household in the county was $42,050 and the median income for a family was $54,096. Males had a median income of $40,802 versus $30,272 for females. The per capita income for the county was $24,305. About 5.7% of families and 10.1% of the population were below the poverty line, including 17.0% of those under age 18 and 11.8% of those age 65 or over.[14]
Politics
Valley County voters vote reliably Republican in national elections. Since 1964, they have selected the Democratic Party candidate only once (1992, due to strong showing by third-party candidate Ross Perot, which split the Republican voters).
| Year | Republican | Democratic | Third party | |||
|---|---|---|---|---|---|---|
| No. | % | No. | % | No. | % | |
| 2020 | 3,135 | 73.57% | 1,030 | 24.17% | 96 | 2.25% |
| 2016 | 2,698 | 69.29% | 886 | 22.75% | 310 | 7.96% |
| 2012 | 2,337 | 60.56% | 1,385 | 35.89% | 137 | 3.55% |
| 2008 | 2,121 | 54.23% | 1,645 | 42.06% | 145 | 3.71% |
| 2004 | 2,476 | 61.62% | 1,431 | 35.61% | 111 | 2.76% |
| 2000 | 2,500 | 63.08% | 1,273 | 32.12% | 190 | 4.79% |
| 1996 | 1,838 | 43.69% | 1,674 | 39.79% | 695 | 16.52% |
| 1992 | 1,497 | 32.77% | 1,715 | 37.54% | 1,356 | 29.68% |
| 1988 | 2,467 | 52.42% | 2,163 | 45.96% | 76 | 1.61% |
| 1984 | 3,123 | 61.89% | 1,849 | 36.64% | 74 | 1.47% |
| 1980 | 3,242 | 62.47% | 1,567 | 30.19% | 381 | 7.34% |
| 1976 | 2,520 | 50.82% | 2,352 | 47.43% | 87 | 1.75% |
| 1972 | 3,210 | 60.02% | 1,973 | 36.89% | 165 | 3.09% |
| 1968 | 2,290 | 49.44% | 1,926 | 41.58% | 416 | 8.98% |
| 1964 | 2,077 | 40.53% | 3,032 | 59.16% | 16 | 0.31% |
| 1960 | 2,387 | 44.65% | 2,953 | 55.24% | 6 | 0.11% |
| 1956 | 2,357 | 48.42% | 2,511 | 51.58% | 0 | 0.00% |
| 1952 | 2,462 | 53.28% | 2,130 | 46.09% | 29 | 0.63% |
| 1948 | 1,375 | 33.45% | 2,535 | 61.68% | 200 | 4.87% |
| 1944 | 1,341 | 37.44% | 2,196 | 61.31% | 45 | 1.26% |
| 1940 | 1,597 | 30.94% | 3,493 | 67.67% | 72 | 1.39% |
| 1936 | 996 | 14.11% | 5,862 | 83.07% | 199 | 2.82% |
| 1932 | 1,242 | 30.35% | 2,499 | 61.07% | 351 | 8.58% |
| 1928 | 2,330 | 63.85% | 1,294 | 35.46% | 25 | 0.69% |
| 1924 | 1,555 | 51.10% | 497 | 16.33% | 991 | 32.57% |
| 1920 | 2,096 | 62.89% | 895 | 26.85% | 342 | 10.26% |
| 1916 | 1,111 | 32.28% | 2,102 | 61.07% | 229 | 6.65% |
| 1912 | 668 | 25.84% | 696 | 26.92% | 1,221 | 47.23% |
| 1908 | 843 | 59.12% | 503 | 35.27% | 80 | 5.61% |
| 1904 | 742 | 67.70% | 335 | 30.57% | 19 | 1.73% |
Communities
City
- Glasgow (county seat)
Towns
Census-designated places
Unincorporated communities
Ghost towns
Census Maps
 |
 |
See also
- Fort Peck Dam
- List of lakes in Valley County, Montana (A-L)
- List of lakes in Valley County, Montana (M-Z)
- List of mountains in Valley County, Montana
- National Register of Historic Places listings in Valley County, Montana
References
- Stout, Tom (1921). Montana, its story and biography; a history of aboriginal and territorial Montana and three decades of statehood, under the editorial supervision of Tom Stout. Chicago IL: American Historical Society. Retrieved December 7, 2013.
- "State & County QuickFacts". U.S. Census Bureau. Retrieved February 15, 2022.
- "Find a County". National Association of Counties. Retrieved June 7, 2011.
- "2010 Census Gazetteer Files". U.S. Census Bureau. August 22, 2012. Archived from the original on December 5, 2014. Retrieved November 30, 2014.
- "Annual Estimates of the Resident Population for Counties: April 1, 2020 to July 1, 2021". Retrieved June 26, 2022.
- "U.S. Decennial Census". U.S. Census Bureau. Retrieved November 30, 2014.
- "Historical Census Browser". University of Virginia Library. Retrieved November 30, 2014.
- "Population of Counties by Decennial Census: 1900 to 1990". U.S. Census Bureau. Retrieved November 30, 2014.
- "Census 2000 PHC-T-4. Ranking Tables for Counties: 1990 and 2000" (PDF). U.S. Census Bureau. Retrieved November 30, 2014.
- "U.S. Census website". U.S. Census Bureau. Retrieved January 31, 2008.
- "Profile of General Population and Housing Characteristics: 2010 Demographic Profile Data". US Census Bureau. Archived from the original on February 13, 2020. Retrieved January 10, 2016.
- "Population, Housing Units, Area, and Density: 2010 - County". US Census Bureau. Archived from the original on February 13, 2020. Retrieved January 10, 2019.
- "Selected Social Characteristics in the US – 2006-2010 American Community Survey 5-Year Estimates". US Census Bureau. Archived from the original on February 13, 2020. Retrieved January 10, 2016.
- "Selected Economic Characteristics – 2006-2010 American Community Survey 5-Year Estimates". U.S. Census Bureau. Archived from the original on February 13, 2020. Retrieved January 10, 2016.
- Leip, David. "Atlas of US Presidential Elections". uselectionatlas.org. Retrieved April 3, 2018.
- Baylor MT Google Maps (accessed January 7, 2019)
- Miles Crossing MT Google Maps (accessed January 7, 2019)
- Park Grove MT Google Maps (accessed January 7, 2019)
- Richland Post Office MT Google Maps (accessed January 7, 2019)
- Roanwood MT Google Maps (accessed January 7, 2019)
- Tampico MT Google Maps (accessed January 7, 2019)
- Whately MT Google Maps (accessed January 7, 2019)
- Wheeler MT Google Maps (accessed January 7, 2019)
- Beaverton MT Google Maps (accessed January 7, 2019)
- Thoeny MT Google Maps (accessed January 7, 2019)
External links
Places adjacent to Valley County, Montana | ||||||||||||||||
|---|---|---|---|---|---|---|---|---|---|---|---|---|---|---|---|---|
| ||||||||||||||||
Municipalities and communities of Valley County, Montana, United States | ||
|---|---|---|
County seat: Glasgow | ||
| City |
|  |
| Towns | ||
| CDPs | ||
| Other communities | ||
| Indian reservations |
| |
| Ghost towns | ||
| Footnotes | ‡This populated place also has portions in an adjacent county or counties | |
| ||
Helena (capital) | ||
| Topics |
|  Seal of Montana |
| Society |
| |
| Regions |
| |
| Largest cities | ||
| Counties |
| |
Authority control | |
|---|---|
| General | |
| National libraries | |
На других языках
- [en] Valley County, Montana
[ru] Валли (округ, Монтана)
Округ Валли (англ. Valley County) располагается в штате Монтана, США. Официально образован в 1893 году. По состоянию на 2010 год, численность населения составляла 7 369 человек.Другой контент может иметь иную лицензию. Перед использованием материалов сайта WikiSort.org внимательно изучите правила лицензирования конкретных элементов наполнения сайта.
WikiSort.org - проект по пересортировке и дополнению контента Википедии