world.wikisort.org - USA
Richland County is a county located in the U.S. state of Illinois. According to the 2010 census, it had a population of 16,233.[1] Its county seat is Olney.[2]
Richland County | |
|---|---|
U.S. county | |
 Richland County Courthouse in Olney | |
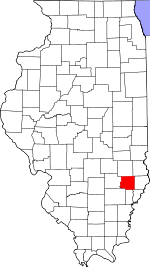 Location within the U.S. state of Illinois | |
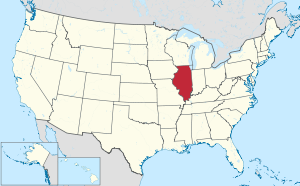 Illinois's location within the U.S. | |
| Coordinates: 38°43′N 88°05′W | |
| Country | |
| State | |
| Founded | February 24, 1841 |
| Named for | Richland County, Ohio |
| Seat | Olney |
| Largest city | Olney |
| Area | |
| • Total | 362 sq mi (940 km2) |
| • Land | 356 sq mi (920 km2) |
| • Water | 1.9 sq mi (5 km2) 0.5% |
| Population (2010) | |
| • Total | 16,233 |
| • Estimate (2018) | 15,763 |
| • Density | 45/sq mi (17/km2) |
| Time zone | UTC−6 (Central) |
| • Summer (DST) | UTC−5 (CDT) |
| Congressional district | 15th |
History
Richland County was established in 1841 out of portions of East part of Clay and West part of Lawrence counties.[3] It was named for Richland County, Ohio, where many of the early settlers migrated from.
 Richland County at the time of its creation in 1841

Geography
According to the U.S. Census Bureau, the county has a total area of 362 square miles (940 km2), of which 360 square miles (930 km2) is land and 1.9 square miles (4.9 km2) (0.5%) is water.[4]
Climate and weather
| Olney, Illinois | ||||||||||||||||||||||||||||||||||||||||||||||||||||||||||||
|---|---|---|---|---|---|---|---|---|---|---|---|---|---|---|---|---|---|---|---|---|---|---|---|---|---|---|---|---|---|---|---|---|---|---|---|---|---|---|---|---|---|---|---|---|---|---|---|---|---|---|---|---|---|---|---|---|---|---|---|---|
| Climate chart (explanation) | ||||||||||||||||||||||||||||||||||||||||||||||||||||||||||||
| ||||||||||||||||||||||||||||||||||||||||||||||||||||||||||||
| ||||||||||||||||||||||||||||||||||||||||||||||||||||||||||||
In recent years, average temperatures in the county seat of Olney have ranged from a low of 19 °F (−7 °C) in January to a high of 88 °F (31 °C) in July, although a record low of −25 °F (−32 °C) was recorded in February 1951 and a record high of 112 °F (44 °C) was recorded in July 1936. Average monthly precipitation ranged from 2.73 inches (69 mm) in February to 4.76 inches (121 mm) in May.[5]
Major highways
 U.S. Route 50
 Illinois Route 130
 Illinois Route 250
Adjacent counties
- Jasper County (north)
- Crawford County (northeast)
- Lawrence County (east)
- Wabash County (southeast)
- Edwards County (south)
- Wayne County (southwest)
- Clay County (west)
Demographics
| Historical population | |||
|---|---|---|---|
| Census | Pop. | %± | |
| 1850 | 4,012 | — | |
| 1860 | 9,711 | 142.0% | |
| 1870 | 12,803 | 31.8% | |
| 1880 | 15,545 | 21.4% | |
| 1890 | 15,019 | −3.4% | |
| 1900 | 16,391 | 9.1% | |
| 1910 | 15,970 | −2.6% | |
| 1920 | 14,044 | −12.1% | |
| 1930 | 14,053 | 0.1% | |
| 1940 | 17,137 | 21.9% | |
| 1950 | 16,889 | −1.4% | |
| 1960 | 16,299 | −3.5% | |
| 1970 | 16,829 | 3.3% | |
| 1980 | 17,587 | 4.5% | |
| 1990 | 16,545 | −5.9% | |
| 2000 | 16,149 | −2.4% | |
| 2010 | 16,233 | 0.5% | |
| 2018 (est.) | 15,763 | [6] | −2.9% |
| U.S. Decennial Census[7] 1790–1960[8] 1900–1990[9] 1990–2000[10] 2010–2013[1] | |||
As of the 2010 United States Census, there were 16,233 people, 6,726 households, and 4,438 families residing in the county.[11] The population density was 45.1 inhabitants per square mile (17.4/km2). There were 7,513 housing units at an average density of 20.9 per square mile (8.1/km2).[4] The racial makeup of the county was 97.3% white, 0.7% Asian, 0.5% black or African American, 0.2% American Indian, 0.4% from other races, and 0.9% from two or more races. Those of Hispanic or Latino origin made up 1.3% of the population.[11] In terms of ancestry, 29.6% were German, 11.7% were American, 11.4% were English, and 9.2% were Irish.[12]
Of the 6,726 households, 28.9% had children under the age of 18 living with them, 51.7% were married couples living together, 9.6% had a female householder with no husband present, 34.0% were non-families, and 29.3% of all households were made up of individuals. The average household size was 2.36 and the average family size was 2.88. The median age was 42.1 years.[11]
The median income for a household in the county was $41,917 and the median income for a family was $53,853. Males had a median income of $41,058 versus $31,296 for females. The per capita income for the county was $22,874. About 9.5% of families and 13.8% of the population were below the poverty line, including 15.1% of those under age 18 and 11.9% of those age 65 or over.[13] Richland is the top ranked most affordable county in Illinois to buy a car and is on average $932 less expensive than other Illinois counties.[14]
Communities
City
- Olney (seat)
Villages
Unincorporated communities
Townships
Richland County is divided into nine townships:
Notable people
- Alexander W. Swanitz (1851–1915), civil engineer who participated in the construction of railroads in various parts of the country
- Dial D. Ryder (1938–2011), gun smith
Politics
Government
| Office | Office holder |
|---|---|
| County Board Chairman | Dennis Graves |
| County Board Member - District 1 | Bill Clow |
| County Board Member - District 2 | Emily Blackford |
| County Board Member - District 3 | Shawn Rose |
| County Board Member - District 4 | Steve Schonert |
| County Board Member - District 5 | Morgan Henton |
| County Board Member - District 6 | Dennis Graves |
| County Board Member - District 7 | Brian VanBlaricum |
| County Clerk | Alice Mulinax |
| County Circuit Clerk | Zach Holder |
| County Treasurer | Sheila Ritter |
| County Assessor | Tim Hahn |
| Corner | Steve Patterson |
| States Attorney | John Clark |
| County Sheriff | Andy Hires |
| Year | Republican | Democratic | Third party | |||
|---|---|---|---|---|---|---|
| No. | % | No. | % | No. | % | |
| 2020 | 6,089 | 75.39% | 1,830 | 22.66% | 158 | 1.96% |
| 2016 | 5,739 | 75.03% | 1,584 | 20.71% | 326 | 4.26% |
| 2012 | 4,756 | 65.31% | 2,362 | 32.44% | 164 | 2.25% |
| 2008 | 4,329 | 56.42% | 3,181 | 41.46% | 163 | 2.12% |
| 2004 | 5,153 | 66.50% | 2,529 | 32.64% | 67 | 0.86% |
| 2000 | 4,718 | 63.52% | 2,491 | 33.54% | 219 | 2.95% |
| 1996 | 3,137 | 46.03% | 2,679 | 39.31% | 999 | 14.66% |
| 1992 | 3,053 | 37.87% | 3,286 | 40.76% | 1,722 | 21.36% |
| 1988 | 4,264 | 59.61% | 2,863 | 40.03% | 26 | 0.36% |
| 1984 | 5,665 | 71.95% | 2,182 | 27.71% | 27 | 0.34% |
| 1980 | 5,241 | 64.50% | 2,463 | 30.31% | 422 | 5.19% |
| 1976 | 4,434 | 55.03% | 3,485 | 43.25% | 138 | 1.71% |
| 1972 | 5,558 | 68.41% | 2,553 | 31.42% | 14 | 0.17% |
| 1968 | 4,781 | 58.76% | 2,495 | 30.66% | 861 | 10.58% |
| 1964 | 3,901 | 47.92% | 4,239 | 52.08% | 0 | 0.00% |
| 1960 | 5,329 | 63.80% | 3,015 | 36.09% | 9 | 0.11% |
| 1956 | 5,304 | 68.05% | 2,485 | 31.88% | 5 | 0.06% |
| 1952 | 5,569 | 68.42% | 2,565 | 31.51% | 5 | 0.06% |
| 1948 | 3,884 | 60.56% | 2,438 | 38.02% | 91 | 1.42% |
| 1944 | 4,577 | 60.91% | 2,858 | 38.04% | 79 | 1.05% |
| 1940 | 5,022 | 53.17% | 4,335 | 45.89% | 89 | 0.94% |
| 1936 | 4,040 | 47.57% | 4,268 | 50.26% | 184 | 2.17% |
| 1932 | 2,765 | 38.50% | 4,318 | 60.12% | 99 | 1.38% |
| 1928 | 4,042 | 61.03% | 2,550 | 38.50% | 31 | 0.47% |
| 1924 | 3,082 | 50.07% | 2,749 | 44.66% | 324 | 5.26% |
| 1920 | 3,026 | 57.05% | 2,174 | 40.99% | 104 | 1.96% |
| 1916 | 2,992 | 45.09% | 3,431 | 51.70% | 213 | 3.21% |
| 1912 | 811 | 21.80% | 1,800 | 48.39% | 1,109 | 29.81% |
| 1908 | 1,684 | 44.13% | 1,938 | 50.79% | 194 | 5.08% |
| 1904 | 1,778 | 48.20% | 1,604 | 43.48% | 307 | 8.32% |
| 1900 | 1,793 | 45.58% | 2,042 | 51.91% | 99 | 2.52% |
| 1896 | 1,693 | 44.55% | 2,062 | 54.26% | 45 | 1.18% |
| 1892 | 1,500 | 43.35% | 1,542 | 44.57% | 418 | 12.08% |
See also
- National Register of Historic Places listings in Richland County
References
- "State & County QuickFacts". United States Census Bureau. Archived from the original on August 26, 2011. Retrieved July 8, 2014.
- "Find a County". National Association of Counties. Archived from the original on May 31, 2011. Retrieved June 7, 2011.
- Morrison, Kate. "The Church". Historical Sketch of the First Methodist Episcopal Church of Olney, Illinois, 1841–1909. p. 5 – via Internet Archive.
- "Population, Housing Units, Area, and Density: 2010 – County". United States Census Bureau. Archived from the original on February 12, 2020. Retrieved July 12, 2015.
- "Monthly Averages for Olney, Illinois". The Weather Channel. Retrieved January 27, 2011.
- "Population and Housing Unit Estimates". Retrieved November 2, 2019.
- "U.S. Decennial Census". United States Census Bureau. Retrieved July 8, 2014.
- "Historical Census Browser". University of Virginia Library. Retrieved July 8, 2014.
- "Population of Counties by Decennial Census: 1900 to 1990". United States Census Bureau. Retrieved July 8, 2014.
- "Census 2000 PHC-T-4. Ranking Tables for Counties: 1990 and 2000" (PDF). United States Census Bureau. Retrieved July 8, 2014.
- "DP-1 Profile of General Population and Housing Characteristics: 2010 Demographic Profile Data". United States Census Bureau. Archived from the original on February 13, 2020. Retrieved July 12, 2015.
- "DP02 SELECTED SOCIAL CHARACTERISTICS IN THE UNITED STATES – 2006–2010 American Community Survey 5-Year Estimates". United States Census Bureau. Archived from the original on February 13, 2020. Retrieved July 12, 2015.
- "DP03 SELECTED ECONOMIC CHARACTERISTICS – 2006–2010 American Community Survey 5-Year Estimates". United States Census Bureau. Archived from the original on February 13, 2020. Retrieved July 12, 2015.
- "Used Car Market in Chicago, IL". Autolist. Retrieved February 6, 2017.
- "The City of Olney, Illinois". www.ci.olney.il.us. City of Olney. Retrieved February 27, 2021.
- Leip, David. "Dave Leip's Atlas of U.S. Presidential Elections". uselectionatlas.org.
Places adjacent to Richland County, Illinois | ||||||||||||||||
|---|---|---|---|---|---|---|---|---|---|---|---|---|---|---|---|---|
| ||||||||||||||||
Municipalities and communities of Richland County, Illinois, United States | ||
|---|---|---|
County seat: Olney | ||
| City |  | |
| Villages | ||
| Townships | ||
| CDP | ||
| Other communities | ||
| Footnotes | ‡This populated place also has portions in an adjacent county or counties | |
| ||
| Counties | 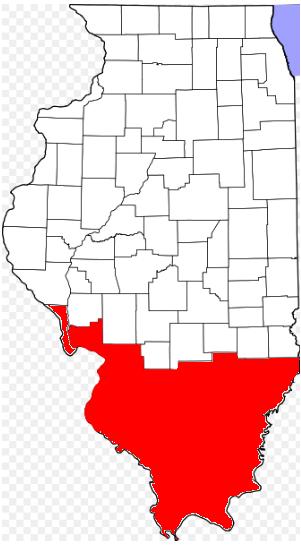 | |
|---|---|---|
| Mid-sized cities (25,000+) |
| |
| Small Cities (10,000-25,000) | ||
| Small Cities (5,000-10,000) | ||
| Interstates |
| |
| Airports/Military bases |
| |
| Universities |
| |
| Colleges |
| |
| Sports teams based in the Southern Illinois |
| |
Authority control | |
|---|---|
| General | |
| National libraries | |
| Other | |
На других языках
[de] Richland County (Illinois)
Das Richland County[1] ist ein County im US-amerikanischen Bundesstaat Illinois. Im Jahr 2010 hatte das County 16.233 Einwohner und eine Bevölkerungsdichte von 17,4 Einwohnern pro Quadratkilometer.[2] Der Verwaltungssitz (County Seat) ist Olney.[3]- [en] Richland County, Illinois
[ru] Ричленд (округ, Иллинойс)
Ричленд[1] (англ. Richland County) — округ в штате Иллинойс, США. Официально образован 24-го февраля 1841 года. По состоянию на 2010 год, численность населения составляла 16 233 человека.Другой контент может иметь иную лицензию. Перед использованием материалов сайта WikiSort.org внимательно изучите правила лицензирования конкретных элементов наполнения сайта.
WikiSort.org - проект по пересортировке и дополнению контента Википедии