world.wikisort.org - USA
McDonough County is a county in the U.S. state of Illinois. According to the 2010 census, it had a population of 32,612.[1] Its county seat is Macomb.[2]
McDonough County | |
|---|---|
U.S. county | |
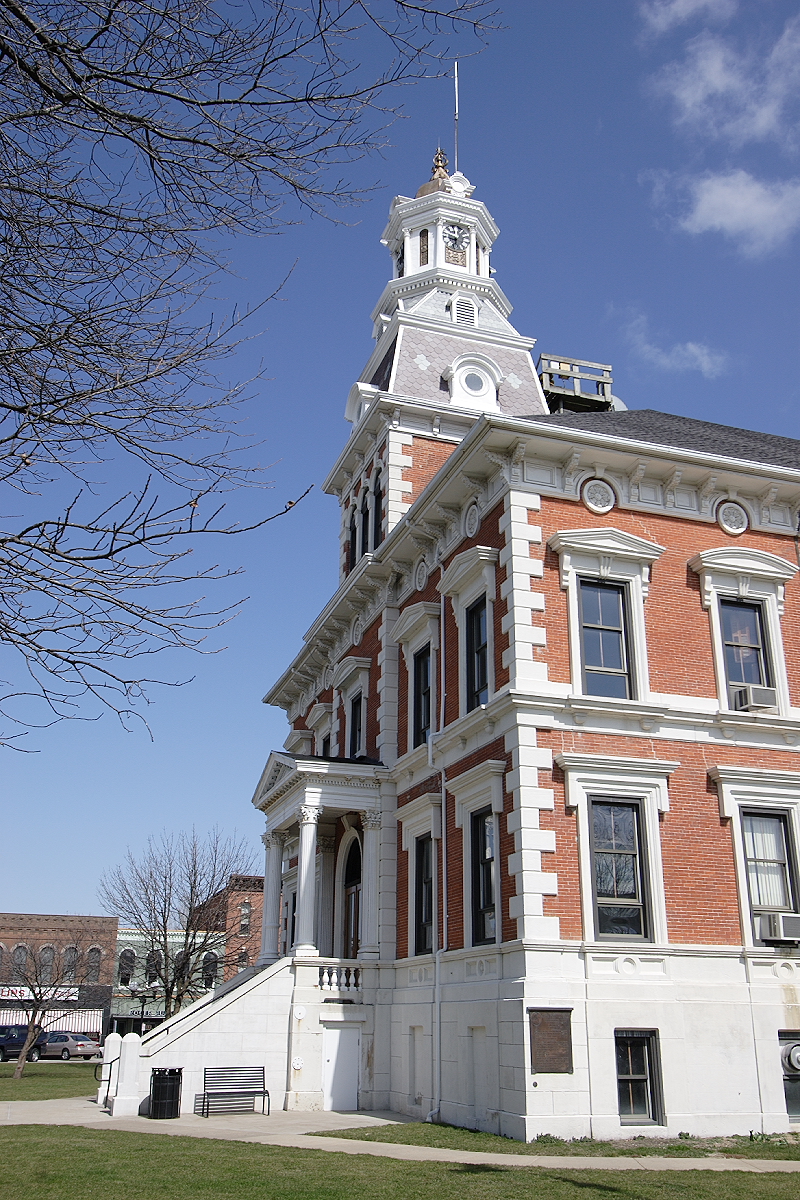 McDonough County Courthouse, 2006 | |
 Location within the U.S. state of Illinois | |
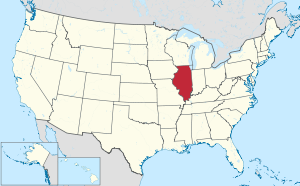 Illinois's location within the U.S. | |
| Coordinates: 40°28′N 90°41′W | |
| Country | |
| State | |
| Founded | 1826 |
| Named for | Thomas Macdonough |
| Seat | Macomb |
| Largest city | Macomb |
| Area | |
| • Total | 590 sq mi (1,500 km2) |
| • Land | 589 sq mi (1,530 km2) |
| • Water | 0.8 sq mi (2 km2) 0.1% |
| Population (2010) | |
| • Total | 32,612 |
| • Estimate (2020) | 27,238 |
| • Density | 55/sq mi (21/km2) |
| Time zone | UTC−6 (Central) |
| • Summer (DST) | UTC−5 (CDT) |
| Congressional district | 18th |
| Website | mcg |
The Macomb, IL Micropolitan Statistical Area includes all of McDonough County.
History
McDonough County is named in honor of Thomas Macdonough who defeated a British squadron in the decisive naval Battle of Lake Champlain in the War of 1812.[3] McDonough County was part of the "Military Tract" set aside by Congress for veterans of the War of 1812.
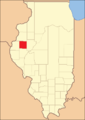 McDonough County at the time of its creation in 1826

Geography
According to the U.S. Census Bureau, the county has a total area of 590 square miles (1,500 km2), of which 589 square miles (1,530 km2) is land and 0.8 square miles (2.1 km2) (0.1%) is water.[4]
The county has the unusual distinction of forming a perfect square by Mercator map projection. The county seat, Macomb, is in the center of the county, and the courthouse is almost precisely in the center of the county.
Public transit
- Go West Transit
- Macomb station
Major highways
 U.S. Route 67
 U.S. Route 136
 Illinois Route 9
 Illinois Route 41
 Illinois Route 61
 Illinois Route 95
 Illinois Route 110
Adjacent counties
- Henderson County - northwest
- Warren County - north
- Fulton County - east
- Schuyler County - south
- Hancock County - west
Demographics
| Historical population | |||
|---|---|---|---|
| Census | Pop. | %± | |
| 1840 | 5,308 | — | |
| 1850 | 7,616 | 43.5% | |
| 1860 | 20,069 | 163.5% | |
| 1870 | 26,509 | 32.1% | |
| 1880 | 27,970 | 5.5% | |
| 1890 | 27,467 | −1.8% | |
| 1900 | 28,412 | 3.4% | |
| 1910 | 26,887 | −5.4% | |
| 1920 | 27,074 | 0.7% | |
| 1930 | 27,329 | 0.9% | |
| 1940 | 26,944 | −1.4% | |
| 1950 | 28,199 | 4.7% | |
| 1960 | 28,928 | 2.6% | |
| 1970 | 36,653 | 26.7% | |
| 1980 | 37,467 | 2.2% | |
| 1990 | 35,244 | −5.9% | |
| 2000 | 32,913 | −6.6% | |
| 2010 | 32,612 | −0.9% | |
| 2020 | 27,238 | −16.5% | |
| U.S. Decennial Census[5] 1790-1960[6] 1900-1990[7] 1990-2000[8] 2010-2013[1] | |||
As of the 2010 United States Census, there were 32,612 people, 13,057 households, and 6,724 families residing in the county.[9] The population density was 55.3 inhabitants per square mile (21.4/km2). There were 14,419 housing units at an average density of 24.5 per square mile (9.5/km2).[4] The racial makeup of the county was 90.4% white, 5.0% black or African American, 1.8% Asian, 0.2% American Indian, 0.7% from other races, and 1.8% from two or more races. Those of Hispanic or Latino origin made up 2.7% of the population.[9] In terms of ancestry, 25.0% were German, 14.7% were American, 13.7% were Irish, 12.7% were English, and 5.1% were Italian.[10]
Of the 13,057 households, 22.0% had children under the age of 18 living with them, 40.0% were married couples living together, 8.0% had a female householder with no husband present, 48.5% were non-families, and 33.9% of all households were made up of individuals. The average household size was 2.19 and the average family size was 2.80. The median age was 28.9 years.[9]
The median income for a household in the county was $33,702 and the median income for a family was $52,390. Males had a median income of $42,297 versus $28,530 for females. The per capita income for the county was $18,344. About 12.8% of families and 23.7% of the population were below the poverty line, including 21.7% of those under age 18 and 9.4% of those age 65 or over.[11]
Politics
| Year | Republican | Democratic | Third party | |||
|---|---|---|---|---|---|---|
| No. | % | No. | % | No. | % | |
| 2020 | 7,027 | 57.00% | 4,992 | 40.50% | 308 | 2.50% |
| 2016 | 6,795 | 51.70% | 5,288 | 40.23% | 1,061 | 8.07% |
| 2012 | 6,147 | 49.36% | 5,967 | 47.91% | 340 | 2.73% |
| 2008 | 6,055 | 46.32% | 6,783 | 51.89% | 234 | 1.79% |
| 2004 | 7,656 | 51.28% | 7,119 | 47.69% | 154 | 1.03% |
| 2000 | 6,465 | 49.68% | 6,080 | 46.73% | 467 | 3.59% |
| 1996 | 5,049 | 41.95% | 5,632 | 46.80% | 1,354 | 11.25% |
| 1992 | 5,297 | 38.05% | 5,814 | 41.76% | 2,811 | 20.19% |
| 1988 | 7,173 | 57.42% | 5,247 | 42.00% | 73 | 0.58% |
| 1984 | 9,383 | 67.02% | 4,561 | 32.58% | 57 | 0.41% |
| 1980 | 8,995 | 61.66% | 4,093 | 28.06% | 1,501 | 10.29% |
| 1976 | 9,683 | 62.33% | 5,464 | 35.17% | 387 | 2.49% |
| 1972 | 10,573 | 67.18% | 5,143 | 32.68% | 22 | 0.14% |
| 1968 | 8,496 | 65.74% | 3,785 | 29.29% | 643 | 4.98% |
| 1964 | 6,907 | 52.92% | 6,144 | 47.08% | 0 | 0.00% |
| 1960 | 9,363 | 67.39% | 4,520 | 32.53% | 10 | 0.07% |
| 1956 | 9,725 | 71.48% | 3,872 | 28.46% | 8 | 0.06% |
| 1952 | 10,126 | 72.06% | 3,922 | 27.91% | 5 | 0.04% |
| 1948 | 8,058 | 65.13% | 4,206 | 33.99% | 109 | 0.88% |
| 1944 | 9,028 | 66.30% | 4,497 | 33.03% | 91 | 0.67% |
| 1940 | 10,326 | 63.67% | 5,783 | 35.66% | 108 | 0.67% |
| 1936 | 8,723 | 54.48% | 7,138 | 44.58% | 151 | 0.94% |
| 1932 | 6,329 | 44.87% | 7,608 | 53.94% | 168 | 1.19% |
| 1928 | 8,953 | 68.15% | 4,104 | 31.24% | 81 | 0.62% |
| 1924 | 7,505 | 60.99% | 4,016 | 32.63% | 785 | 6.38% |
| 1920 | 7,221 | 63.18% | 3,930 | 34.38% | 279 | 2.44% |
| 1916 | 7,192 | 53.08% | 5,740 | 42.36% | 617 | 4.55% |
| 1912 | 1,876 | 26.90% | 2,959 | 42.44% | 2,138 | 30.66% |
| 1908 | 3,733 | 51.05% | 3,112 | 42.56% | 467 | 6.39% |
| 1904 | 4,041 | 55.36% | 2,730 | 37.40% | 528 | 7.23% |
| 1900 | 4,076 | 52.71% | 3,444 | 44.54% | 213 | 2.75% |
| 1896 | 4,036 | 51.16% | 3,684 | 46.70% | 169 | 2.14% |
| 1892 | 3,319 | 46.73% | 3,237 | 45.57% | 547 | 7.70% |
McDonough County is located in Illinois’ 18th Congressional District and is currently represented by Republican Darin LaHood. For the Illinois House of Representatives, the county is located in the 93rd district and is currently represented by Republican Norine Hammond. The county is located in the 47th district of the Illinois Senate, and is currently represented by Republican Jil Tracy.
In presidential elections, McDonough County was once reliably Republican, voting for the Republican candidate in all but two elections (1912 & 1932) from 1892 to 1988. Since 1988, the county has become more competitive, with Democrats carrying the county three out of seven times and holding the Republican candidate's margin of victory to under four points three times. In 2020, however, McDonough County went for Trump by a margin of 16.5%.
Climate and weather
| Macomb, Illinois | ||||||||||||||||||||||||||||||||||||||||||||||||||||||||||||
|---|---|---|---|---|---|---|---|---|---|---|---|---|---|---|---|---|---|---|---|---|---|---|---|---|---|---|---|---|---|---|---|---|---|---|---|---|---|---|---|---|---|---|---|---|---|---|---|---|---|---|---|---|---|---|---|---|---|---|---|---|
| Climate chart (explanation) | ||||||||||||||||||||||||||||||||||||||||||||||||||||||||||||
| ||||||||||||||||||||||||||||||||||||||||||||||||||||||||||||
| ||||||||||||||||||||||||||||||||||||||||||||||||||||||||||||
In recent years, average temperatures in the county seat of Macomb have ranged from a low of 13 °F (−11 °C) in January to a high of 87 °F (31 °C) in July, although a record low of −30 °F (−34 °C) was recorded in February 1905 and a record high of 113 °F (45 °C) was recorded in August 1934. Average monthly precipitation ranged from 1.47 inches (37 mm) in January to 4.58 inches (116 mm) in May.[13]
Communities
Cities
- Bushnell
- Colchester
- Macomb (seat)
Villages
Census-designated places
Other unincorporated place
- Colmar
- Doddsville
- Fandon
- Scottsburg
- Walnut Grove
Townships
- Bethel Township
- Blandinsville Township
- Bushnell Township
- Chalmers Township
- Colchester Township
- Eldorado Township
- Emmet Township
- Hire Township
- Industry Township
- Lamoine Township
- Macomb Township
- Macomb City Township
- Mound Township
- New Salem Township
- Prairie City Township
- Sciota Township
- Scotland Township
- Tennessee Township
- Walnut Grove Township
See also
- National Register of Historic Places listings in McDonough County, Illinois
References
- "State & County QuickFacts". United States Census Bureau. Archived from the original on June 6, 2011. Retrieved July 7, 2014.
- "Find a County". National Association of Counties. Archived from the original on May 31, 2011. Retrieved June 7, 2011.
- Gannett, Henry (1905). The Origin of Certain Place Names in the United States. U.S. Government Printing Office. p. 193.
- "Population, Housing Units, Area, and Density: 2010 - County". United States Census Bureau. Archived from the original on February 12, 2020. Retrieved July 12, 2015.
- "U.S. Decennial Census". United States Census Bureau. Retrieved July 7, 2014.
- "Historical Census Browser". University of Virginia Library. Retrieved July 7, 2014.
- "Population of Counties by Decennial Census: 1900 to 1990". United States Census Bureau. Retrieved July 7, 2014.
- "Census 2000 PHC-T-4. Ranking Tables for Counties: 1990 and 2000" (PDF). United States Census Bureau. Retrieved July 7, 2014.
- "DP-1 Profile of General Population and Housing Characteristics: 2010 Demographic Profile Data". United States Census Bureau. Archived from the original on February 13, 2020. Retrieved July 12, 2015.
- "DP02 SELECTED SOCIAL CHARACTERISTICS IN THE UNITED STATES – 2006-2010 American Community Survey 5-Year Estimates". United States Census Bureau. Archived from the original on February 13, 2020. Retrieved July 12, 2015.
- "DP03 SELECTED ECONOMIC CHARACTERISTICS – 2006-2010 American Community Survey 5-Year Estimates". United States Census Bureau. Archived from the original on February 13, 2020. Retrieved July 12, 2015.
- Leip, David. "Dave Leip's Atlas of U.S. Presidential Elections". uselectionatlas.org. Retrieved April 22, 2018.
- "Monthly Averages for Macomb, Illinois". The Weather Channel. Retrieved January 27, 2011.
External links
 McDonough County travel guide from Wikivoyage
- http://www.outfitters.com/illinois/mcdonough/
- https://web.archive.org/web/20071012114524/http://www.cyberdriveillinois.com/departments/archives/irad/mcdonough.html
- McDonough County website
Places adjacent to McDonough County, Illinois | ||||||||||||||||
|---|---|---|---|---|---|---|---|---|---|---|---|---|---|---|---|---|
| ||||||||||||||||
Municipalities and communities of McDonough County, Illinois, United States | ||
|---|---|---|
County seat: Macomb | ||
| Cities |
|  |
| Villages | ||
| Townships | ||
| CDPs | ||
| Other communities | ||
| Ghost town |
| |
| Footnotes | ‡This populated place also has portions in an adjacent county or counties | |
| ||
Authority control | |
|---|---|
| General | |
| National libraries | |
| Other | |
На других языках
[de] McDonough County
Das McDonough County[3] ist ein County im US-amerikanischen Bundesstaat Illinois. Im Jahr 2010 hatte das County 32.612 Einwohner und eine Bevölkerungsdichte von 21,4 Einwohnern pro Quadratkilometer.[4] Der Verwaltungssitz (County Seat) ist Macomb.[5]- [en] McDonough County, Illinois
[ru] Мак-Доно (округ)
Мак-До́но[1] (англ. McDonough County) — округ в штате Иллинойс, США. Официально образован в 1826 году. По состоянию на 2010 год, численность населения составляла 32 612 человека.Другой контент может иметь иную лицензию. Перед использованием материалов сайта WikiSort.org внимательно изучите правила лицензирования конкретных элементов наполнения сайта.
WikiSort.org - проект по пересортировке и дополнению контента Википедии