world.wikisort.org - USA
Gallatin County is a county located in the U.S. state of Illinois. According to the 2020 census, it has a population of 4,828, making it the third-least populous county in Illinois. Its county seat is Shawneetown.[1] It is located in the southern portion of Illinois known locally as "Little Egypt".
Gallatin County | |
|---|---|
U.S. county | |
 Gallatin County Courthouse in Shawneetown | |
 Location within the U.S. state of Illinois | |
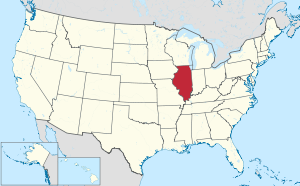 Illinois's location within the U.S. | |
| Coordinates: 37°46′N 88°14′W | |
| Country | |
| State | |
| Founded | 1812 |
| Named for | Albert Gallatin |
| Seat | Shawneetown |
| Largest city | Shawneetown |
| Area | |
| • Total | 328 sq mi (850 km2) |
| • Land | 323 sq mi (840 km2) |
| • Water | 5.1 sq mi (13 km2) 1.6% |
| Population (2010) | |
| • Total | 5,589 |
| • Estimate (2018) | 5,058 |
| • Density | 17/sq mi (6.6/km2) |
| Time zone | UTC−6 (Central) |
| • Summer (DST) | UTC−5 (CDT) |
| Congressional district | 15th |
Located at the mouth of the Wabash River, Gallatin County, along with neighboring Posey County, Indiana, and Union County, Kentucky form the tri-point of the Illinois-Indiana-Kentucky Tri-State Area.
History
Salt production served as the state's first major industry in the early 19th century. Saltworks developed first by Native Americans, and the French had settled at the Great Salt Spring on the south side of the Saline River, about five miles downstream from Equality. Beginning in 1803, salt works were also developed at Half Moon Lick, southwest of Equality on the north side of the Saline River. Half Moon Lick is now on private land, but the Great Salt Springs are on public lands in the Shawnee National Forest, about one mile west of the Saline River bridge across Illinois Route 1 on Salt Well Road.[2]
Gallatin county was organized in 1812 from land formerly in Randolph County. It was named for Albert Gallatin,[3] who was then Secretary of the Treasury. The bank at Shawneetown was the first in Illinois. It was originally in the John Marshall House, which has been rebuilt and serves as the museum of the Gallatin County Historical Society. This should not be confused with the State Bank of Illinois building, which is a state historic site a block away in Old Shawneetown
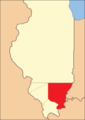 Gallatin County created in the Illinois Territory period between 1812 and 1815
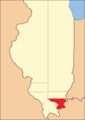 Gallatin between 1815 and 1816
![Gallatin between 1816 and 1818, including unorganized territory (formerly part of Johnson County) temporarily attached to it.[4]](//upload.wikimedia.org/wikipedia/commons/thumb/3/38/Gallatin_County_Illinois_1816.png/85px-Gallatin_County_Illinois_1816.png) Gallatin between 1816 and 1818, including unorganized territory (formerly part of Johnson County) temporarily attached to it.[4]
Gallatin between 1816 and 1818, including unorganized territory (formerly part of Johnson County) temporarily attached to it.[4] Gallatin between 1818 and 1847
 Gallatin in 1847, when a cession to Hardin and the creation of Saline County reduced it to its current territory


![Gallatin between 1816 and 1818, including unorganized territory (formerly part of Johnson County) temporarily attached to it.[4]](http://upload.wikimedia.org/wikipedia/commons/thumb/3/38/Gallatin_County_Illinois_1816.png/85px-Gallatin_County_Illinois_1816.png)


Geography
According to the U.S. Census Bureau, the county has a total area of 328 square miles (850 km2), of which 323 square miles (840 km2) is land and 5.1 square miles (13 km2) (1.6%) is water.[5]
The Wabash and Ohio rivers join in the northeastern part of the county. The Saline River is a major drainage in the county, and it feeds into the Ohio River.
Climate and weather
| Shawneetown, Illinois | ||||||||||||||||||||||||||||||||||||||||||||||||||||||||||||
|---|---|---|---|---|---|---|---|---|---|---|---|---|---|---|---|---|---|---|---|---|---|---|---|---|---|---|---|---|---|---|---|---|---|---|---|---|---|---|---|---|---|---|---|---|---|---|---|---|---|---|---|---|---|---|---|---|---|---|---|---|
| Climate chart (explanation) | ||||||||||||||||||||||||||||||||||||||||||||||||||||||||||||
| ||||||||||||||||||||||||||||||||||||||||||||||||||||||||||||
| ||||||||||||||||||||||||||||||||||||||||||||||||||||||||||||
In recent years, average temperatures in the county seat of Shawneetown have ranged from a low of 21 °F (−6 °C) in January to a high of 87 °F (31 °C) in July, although a record low of −22 °F (−30 °C) was recorded in January 1994 and a record high of 104 °F (40 °C) was recorded in August 2007. Average monthly precipitation ranged from 3.22 inches (82 mm) in October to 5.02 inches (128 mm) in May.[6]
Major highways
 U.S. Highway 45
 Illinois Route 1
 Illinois Route 13
 Illinois Route 141
 Illinois Route 142
Adjacent counties
- White County - north
- Posey County, Indiana - northeast
- Union County, Kentucky - east
- Hardin County - south
- Saline County - west
- Hamilton County - northwest
National protected area
- Shawnee National Forest (part)
Government
Gallatin County government is led by a five-member county board. In addition, the county is divided into ten townships.
Politics
This section needs additional citations for verification. (August 2019) |
As the most culturally Southern of all Illinois counties, Gallatin County was pro-Confederate during the Civil War and even provided a few volunteers to the Confederate Army. It then became solidly Democratic for the next century and a third, voting Republican only in the GOP landslides of 1920, 1952, 1972 and 1980. Even in those four elections, no Republican candidate received more than Richard Nixon’s 53.7 percent in his 3,000-plus-county 1972 triumph.
Since 2000, Gallatin County has followed the same political trajectory as Tennessee, Missouri, Kentucky, West Virginia and Appalachian regions of adjacent states, whereby the Democratic Party’s liberal views on social issues have produced dramatic swings to the Republican Party amongst its almost entirely Southern white population.[7] Over the five elections from 2000 to 2016, Gallatin County has seen a swing of 84 percentage points to the Republican Party – an average of 17 percentage points per election – so that Hillary Clinton’s 24.3 percent vote share in 2016 is barely half the worst Democratic percentage from before 2010. However, despite its sharp rightward turn, it followed the wave in 2008 within the state that elected Barack Obama president, who remains the last Democrat to win the county in a presidential election.
In 1994, Gallatin County was the only one in the state to vote for the Democratic candidate for governor. It voted for the Democrat in every gubernatorial election from 1924 to 2006, finally flipping in 2010 and then voting Republican again in 2014 and 2018.
| Year | Republican | Democratic | Third parties |
|---|---|---|---|
| 2020 | 75.5% 2,019 | 23.3% 622 | 1.2% 33 |
| 2016 | 71.7% 1,942 | 24.3% 657 | 4.0% 108 |
| 2012 | 58.0% 1,492 | 40.0% 1,029 | 2.0% 52 |
| 2008 | 42.2% 1,212 | 55.3% 1,587 | 2.5% 73 |
| 2004 | 50.2% 1,619 | 48.8% 1,573 | 1.0% 33 |
| 2000 | 44.7% 1,591 | 52.8% 1,878 | 2.5% 89 |
| 1996 | 24.4% 856 | 60.2% 2,113 | 15.5% 544 |
| 1992 | 25.1% 990 | 60.1% 2,371 | 14.8% 583 |
| 1988 | 38.9% 1,580 | 60.4% 2,455 | 0.7% 28 |
| 1984 | 47.2% 1,939 | 52.6% 2,164 | 0.2% 9 |
| 1980 | 49.1% 1,700 | 48.4% 1,678 | 2.5% 88 |
| 1976 | 36.4% 1,499 | 63.3% 2,611 | 0.3% 13 |
| 1972 | 53.7% 2,148 | 46.1% 1,844 | 0.2% 9 |
| 1968 | 43.0% 1,802 | 47.3% 1,980 | 9.7% 408 |
| 1964 | 32.9% 1,394 | 67.1% 2,845 | |
| 1960 | 47.7% 2,179 | 52.2% 2,386 | 0.1% 5 |
| 1956 | 49.4% 2,179 | 50.5% 2,230 | 0.1% 6 |
| 1952 | 51.6% 2,300 | 48.3% 2,153 | 0.2% 8 |
| 1948 | 42.6% 1,789 | 56.8% 2,385 | 0.6% 26 |
| 1944 | 48.3% 2,073 | 50.6% 2,175 | 1.1% 47 |
| 1940 | 43.7% 2,588 | 55.5% 3,293 | 0.8% 48 |
| 1936 | 34.7% 2,004 | 64.1% 3,701 | 1.2% 69 |
| 1932 | 26.6% 1,279 | 72.1% 3,469 | 1.4% 65 |
| 1928 | 45.8% 2,002 | 53.6% 2,343 | 0.6% 28 |
| 1924 | 39.2% 1,792 | 52.1% 2,385 | 8.7% 399 |
| 1920 | 49.9% 2,184 | 45.7% 2,000 | 4.3% 189 |
| 1916 | 39.0% 1,985 | 57.4% 2,920 | 3.6% 181 |
| 1912 | 33.8% 1,051 | 54.6% 1,697 | 11.7% 363 |
| 1908 | 41.8% 1,411 | 54.6% 1,845 | 3.6% 122 |
| 1904 | 44.7% 1,401 | 49.1% 1,540 | 6.2% 193 |
| 1900 | 40.9% 1,432 | 57.3% 2,004 | 1.8% 62 |
| 1896 | 41.0% 1,468 | 57.8% 2,067 | 1.2% 44 |
| 1892 | 38.4% 1,211 | 53.0% 1,675 | 8.6% 272 |
Demographics
| Historical population | |||
|---|---|---|---|
| Census | Pop. | %± | |
| 1820 | 3,155 | — | |
| 1830 | 7,405 | 134.7% | |
| 1840 | 10,760 | 45.3% | |
| 1850 | 5,448 | −49.4% | |
| 1860 | 8,055 | 47.9% | |
| 1870 | 11,134 | 38.2% | |
| 1880 | 12,861 | 15.5% | |
| 1890 | 14,935 | 16.1% | |
| 1900 | 15,836 | 6.0% | |
| 1910 | 14,628 | −7.6% | |
| 1920 | 12,856 | −12.1% | |
| 1930 | 10,091 | −21.5% | |
| 1940 | 11,414 | 13.1% | |
| 1950 | 9,818 | −14.0% | |
| 1960 | 7,638 | −22.2% | |
| 1970 | 7,418 | −2.9% | |
| 1980 | 7,590 | 2.3% | |
| 1990 | 6,909 | −9.0% | |
| 2000 | 6,445 | −6.7% | |
| 2010 | 5,589 | −13.3% | |
| 2020 | 4,946 | −11.5% | |
| U.S. Decennial Census[9] 1790-1960[10] 1900-1990[11] 1990-2000[12] 2010-2017[13] | |||

2010
Whereas according to the 2010 census:
- 97.9% White
- 0.2% Black
- 0.3% Native American
- 0.1% Asian
- 0.0% Native Hawaiian or Pacific Islander
- 1.2% Two or more races
- 1.2% Hispanic or Latino (of any race)
2000
As of the 2010 census, there were 5,589 people, 2,403 households, and 1,556 families residing in the county.[14] The population density was 17.3 inhabitants per square mile (6.7/km2). There were 2,746 housing units at an average density of 8.5 per square mile (3.3/km2).[5] The racial makeup of the county was 97.9% white, 0.3% American Indian, 0.2% black or African American, 0.1% Asian, 0.4% from other races, and 1.2% from two or more races. Those of Hispanic or Latino origin made up 1.2% of the population.[14] In terms of ancestry, 23.6% were German, 22.9% were Irish, 10.7% were English, and 7.0% were American.[15]
Of the 2,403 households, 26.8% had children under the age of 18 living with them, 50.6% were married couples living together, 10.0% had a female householder with no husband present, 35.2% were non-families, and 31.1% of all households were made up of individuals. The average household size was 2.32 and the average family size was 2.87. The median age was 44.4 years.[14]
The median income for a household in the county was $38,003 and the median income for a family was $48,892. Males had a median income of $38,801 versus $22,425 for females. The per capita income for the county was $21,537. About 12.4% of families and 18.0% of the population were below the poverty line, including 22.9% of those under age 18 and 14.9% of those age 65 or over.[16]
Communities
City
- Shawneetown
Villages
Unincorporated communities
- Cottonwood
- Elba
- Kedron
- Lawler
Townships
- Asbury
- Bowlesville
- Eagle Creek
- Equality
- Gold Hill
- New Haven
- North Fork
- Omaha
- Ridgway
- Shawnee
See also
- National Register of Historic Places listings in Gallatin County, Illinois
References
- "Find a County". National Association of Counties. Archived from the original on May 31, 2011. Retrieved June 7, 2011.
- Jon Musgrave. 2004, Rev. ed. 2005. Slaves, Salt, Sex & Mr. Crenshaw: The Real Story of the Old Slave House and America's Reverse Underground Railroad. Marion, Ill.: IllinoisHistory.com. 57-65.
- Gannett, Henry (1905). The Origin of Certain Place Names in the United States. Govt. Print. Off. pp. 133.
- White, Jesse. Origin and Evolution of Illinois Counties. State of Illinois, March 2010.
- "Population, Housing Units, Area, and Density: 2010 - County". United States Census Bureau. Archived from the original on February 12, 2020. Retrieved July 11, 2015.
- "Monthly Averages for Shawneetown, Illinois". The Weather Channel. Retrieved January 27, 2011.
- Cohn, Nate; ‘Demographic Shift: Southern Whites’ Loyalty to G.O.P. Nearing That of Blacks to Democrats’, New York Times, April 24, 2014
- Leip, David. "Dave Leip's Atlas of U.S. Presidential Elections". uselectionatlas.org. Retrieved November 4, 2018.
- "U.S. Decennial Census". United States Census Bureau. Retrieved July 5, 2014.
- "Historical Census Browser". University of Virginia Library. Retrieved July 5, 2014.
- "Population of Counties by Decennial Census: 1900 to 1990". United States Census Bureau. Retrieved July 5, 2014.
- "Census 2000 PHC-T-4. Ranking Tables for Counties: 1990 and 2000" (PDF). United States Census Bureau. Retrieved July 5, 2014.
- "State & County QuickFacts". United States Census Bureau. Archived from the original on June 6, 2011. Retrieved July 5, 2014.
- "DP-1 Profile of General Population and Housing Characteristics: 2010 Demographic Profile Data". United States Census Bureau. Archived from the original on February 13, 2020. Retrieved July 11, 2015.
- "DP02 SELECTED SOCIAL CHARACTERISTICS IN THE UNITED STATES – 2006-2010 American Community Survey 5-Year Estimates". United States Census Bureau. Archived from the original on February 13, 2020. Retrieved July 11, 2015.
- "DP03 SELECTED ECONOMIC CHARACTERISTICS – 2006-2010 American Community Survey 5-Year Estimates". United States Census Bureau. Archived from the original on February 13, 2020. Retrieved July 11, 2015.
Further reading
- 1887. History of Gallatin, Saline, Hamilton, Franklin and Williamson Counties, Illinois. Chicago: Goodspeed Publishing Co.
- Musgrave, Jon, ed. 2002. Handbook of Old Gallatin County and Southeastern Illinois. Marion, Ill.: IllinoisHistory.com. 464 pages.
- Musgrave, Jon. 2004, Rev. ed. 2005. Slaves, Salt, Sex & Mr. Crenshaw: The Real Story of the Old Slave House and America's Reverse Underground R.R.. Marion, Ill.: IllinoisHistory.com. 608 pages.
- Waggoner, Horace Q., interviewer. 1978. "Lucille Lawler Memoir" Shawneetown Bank Project. Sangamon State University. Springfield, Ill.
External links
- History of Gallatin County http://www.rootsweb.com/~ilgallat/gch.htm
- History of Gallatin County and its Communities https://web.archive.org/web/20060413162609/http://www.lth6.k12.il.us/schools/gallatin/communities.htm
Places adjacent to Gallatin County, Illinois | ||||||||||||||||
|---|---|---|---|---|---|---|---|---|---|---|---|---|---|---|---|---|
| ||||||||||||||||
Municipalities and communities of Gallatin County, Illinois, United States | ||
|---|---|---|
County seat: Shawneetown | ||
| City |
|  |
| Villages | ||
| Townships |
| |
| Unincorporated communities |
| |
| ||
Springfield (capital) | ||
| Topics |
|  Seal of Illinois |
| Regions |
| |
| Municipalities |
| |
| Counties |
| |
Southern Illinois | ||
|---|---|---|
| Counties | 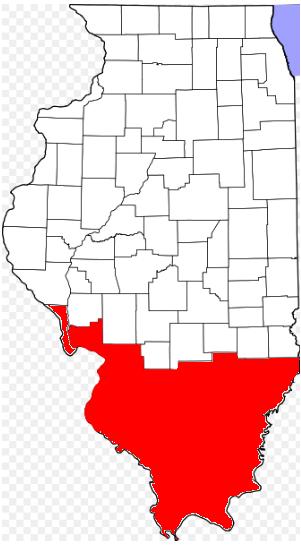 | |
| Mid-sized cities (25,000+) |
| |
| Small Cities (10,000-25,000) |
| |
| Small Cities (5,000-10,000) |
| |
| Interstates |
| |
| Airports/Military bases |
| |
| Universities |
| |
| Colleges |
| |
| Sports teams based in the Southern Illinois |
| |
Authority control | |
|---|---|
| General | |
| National libraries | |
| Other | |
На других языках
[de] Gallatin County (Illinois)
Das Gallatin County[1] ist ein County im US-amerikanischen Bundesstaat Illinois. Im Jahr 2010 hatte das County 5589 Einwohner und eine Bevölkerungsdichte von 6,7 Einwohnern pro Quadratkilometer.[2] Der Verwaltungssitz (County Seat) ist Shawneetown.[3]- [en] Gallatin County, Illinois
[ru] Галлатин (округ, Иллинойс)
Га́ллатин[1] (англ. Gallatin County) — округ в штате Иллинойс, США. По данным переписи 2010 года численность населения округа составила 5589 чел., по сравнению с переписью 2000 года оно уменьшилось на 13,3 %[2]. Окружной центр округа Галлатин — город Шоунитаун.Другой контент может иметь иную лицензию. Перед использованием материалов сайта WikiSort.org внимательно изучите правила лицензирования конкретных элементов наполнения сайта.
WikiSort.org - проект по пересортировке и дополнению контента Википедии