world.wikisort.org - USA
Christian County is a county located in the U.S. state of Illinois. As of the 2010 census, the population was 34,800.[1] Its county seat is Taylorville.[2] Christian County comprises the Taylorville, IL Micropolitan Statistical Area, which is also included in the Springfield-Jacksonville-Lincoln, IL Combined Statistical Area.
Christian County | |
|---|---|
U.S. county | |
 Christian County Courthouse in Taylorville | |
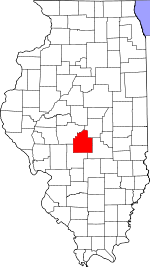 Location within the U.S. state of Illinois | |
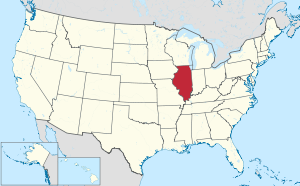 Illinois's location within the U.S. | |
| Coordinates: 39°33′N 89°17′W | |
| Country | |
| State | |
| Founded | 1839 |
| Named for | Christian County, Kentucky |
| Seat | Taylorville |
| Largest city | Taylorville |
| Area | |
| • Total | 716 sq mi (1,850 km2) |
| • Land | 709 sq mi (1,840 km2) |
| • Water | 6.3 sq mi (16 km2) 0.9% |
| Population (2010) | |
| • Total | 34,800 |
| • Estimate (2019) | 32,304 |
| • Density | 49/sq mi (19/km2) |
| Time zone | UTC−6 (Central) |
| • Summer (DST) | UTC−5 (CDT) |
| Congressional district | 13th |
| Website | christiancountyil |
History
Christian County was formed February 15, 1839 out of Sangamon, Montgomery and Shelby counties. It was named for Christian County, Kentucky. It was originally named Dane County and was called Dane County until 1840.[3]
 Christian County at its creation in 1839

Geography
According to the U.S. Census Bureau, the county has a total area of 716 square miles (1,850 km2), of which 709 square miles (1,840 km2) is land and 6.3 square miles (16 km2) (0.9%) is water.[4] The county is bounded on the north by Sangamon River, and intersected by the south fork of that stream.[5]
Adjacent counties
- Macon County (northeast)
- Shelby County (southeast)
- Montgomery County (southwest)
- Sangamon County (northwest)
Major highways
 US Route 51
 Illinois Route 16
 Illinois Route 29
 Illinois Route 48
 Illinois Route 104
Climate and weather
| Taylorville, Illinois | ||||||||||||||||||||||||||||||||||||||||||||||||||||||||||||
|---|---|---|---|---|---|---|---|---|---|---|---|---|---|---|---|---|---|---|---|---|---|---|---|---|---|---|---|---|---|---|---|---|---|---|---|---|---|---|---|---|---|---|---|---|---|---|---|---|---|---|---|---|---|---|---|---|---|---|---|---|
| Climate chart (explanation) | ||||||||||||||||||||||||||||||||||||||||||||||||||||||||||||
| ||||||||||||||||||||||||||||||||||||||||||||||||||||||||||||
| ||||||||||||||||||||||||||||||||||||||||||||||||||||||||||||
In recent years, average temperatures in the county seat of Taylorville have ranged from a low of 16 °F (−9 °C) in January to a high of 86 °F (30 °C) in July, although a record low of −23 °F (−31 °C) was recorded in January 1994 and a record high of 104 °F (40 °C) was recorded in August 1988. Average monthly precipitation ranged from 1.78 inches (45 mm) in January to 3.77 inches (96 mm) in May.[6]
Demographics
| Historical population | |||
|---|---|---|---|
| Census | Pop. | %± | |
| 1840 | 1,878 | — | |
| 1850 | 3,203 | 70.6% | |
| 1860 | 10,492 | 227.6% | |
| 1870 | 20,363 | 94.1% | |
| 1880 | 28,227 | 38.6% | |
| 1890 | 30,531 | 8.2% | |
| 1900 | 32,790 | 7.4% | |
| 1910 | 34,594 | 5.5% | |
| 1920 | 38,458 | 11.2% | |
| 1930 | 37,538 | −2.4% | |
| 1940 | 38,564 | 2.7% | |
| 1950 | 38,816 | 0.7% | |
| 1960 | 37,207 | −4.1% | |
| 1970 | 35,948 | −3.4% | |
| 1980 | 36,446 | 1.4% | |
| 1990 | 34,418 | −5.6% | |
| 2000 | 35,372 | 2.8% | |
| 2010 | 34,800 | −1.6% | |
| 2019 (est.) | 32,304 | [7] | −7.2% |
| U.S. Decennial Census[8] 1790-1960[9] 1900-1990[10] 1990-2000[11] 2010-2013[1] | |||

As of the 2010 United States Census, there were 34,800 people, 14,055 households, and 9,211 families residing in the county.[12] The population density was 49.1 inhabitants per square mile (19.0/km2). There were 15,563 housing units at an average density of 21.9 per square mile (8.5/km2).[4] The racial makeup of the county was 96.6% white, 1.4% black or African American, 0.5% Asian, 0.1% American Indian, 0.4% from other races, and 0.9% from two or more races. Those of Hispanic or Latino origin made up 1.4% of the population.[12] In terms of ancestry, 21.9% were German, 12.7% were Irish, 10.6% were American, and 9.9% were English.[13]
Of the 14,055 households, 30.1% had children under the age of 18 living with them, 50.1% were married couples living together, 10.3% had a female householder with no husband present, 34.5% were non-families, and 29.9% of all households were made up of individuals. The average household size was 2.36 and the average family size was 2.90. The median age was 41.6 years.[12]
The median income for a household in the county was $41,712 and the median income for a family was $52,680. Males had a median income of $42,897 versus $30,027 for females. The per capita income for the county was $21,519. About 12.7% of families and 16.6% of the population were below the poverty line, including 28.6% of those under age 18 and 9.4% of those age 65 or over.[14]
Communities
Cities
- Assumption
- Pana
- Taylorville
Villages
- Bulpitt
- Edinburg
- Harvel
- Jeisyville
- Kincaid
- Morrisonville
- Mount Auburn
- Moweaqua
- Owaneco
- Palmer
- Stonington
- Tovey
Census-designated places
Other unincorporated places
- Bolivia
- Clarksdale
- Dunkel
- Ellis
- Grove City
- Hewittsville
- Midway
- Millersville
- Old Stonington
- Osbernville
- Radford
- Roby
- Rosamond
- Sharpsburg
- Sicily
- Vanderville
- Velma
- Willey Station
- Zenobia
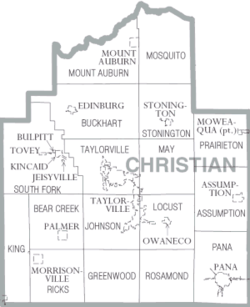
Townships
Christian County is divided into these seventeen townships:
- Assumption
- Bear Creek
- Buckhart
- Greenwood
- Johnson
- King
- Locust
- May
- Mosquito
- Mount Auburn
- Pana
- Prairieton
- Ricks
- Rosamond
- South Fork
- Stonington
- Taylorville
Notable people
- Jon Corzine, Former governor of New Jersey, former resident of Willey Station.
- Roy A. Corzine (1882-1957), Illinois state representative and farmer, was born in Stonington.
- Harry Forrester, member of the Illinois Basketball Hall of Fame and Quincy University Hall of Fame.
- Brant Hansen, Christian radio host and author, graduated from high school in Assumption.
- Frank P. Sadler (1872–1931), Illinois state senator and lawyer, lived on a farm near Grove City.
- John Wesley Fribley (1906–2002), state senate (1934–1952), born in Pana
Politics
Like most of German-settled Central Illinois, Christian County was solidly Democratic until Woodrow Wilson’s response to German defeat in World War I turned the county over to the Republican Party in its 1920, 1924 and 1928 landslides. The county remained Democratic-leaning through the rest of the twentieth century, only voting Republican in landslide wins. However, since 2000 Christian County has become reliably Republican.
| Year | Republican | Democratic | Third party | |||
|---|---|---|---|---|---|---|
| No. | % | No. | % | No. | % | |
| 2020 | 11,563 | 71.24% | 4,335 | 26.71% | 333 | 2.05% |
| 2016 | 10,543 | 68.12% | 3,992 | 25.79% | 942 | 6.09% |
| 2012 | 8,885 | 60.33% | 5,494 | 37.31% | 348 | 2.36% |
| 2008 | 7,872 | 51.94% | 6,918 | 45.65% | 365 | 2.41% |
| 2004 | 9,044 | 59.24% | 6,112 | 40.03% | 111 | 0.73% |
| 2000 | 7,537 | 51.03% | 6,799 | 46.03% | 435 | 2.94% |
| 1996 | 5,563 | 37.49% | 7,431 | 50.08% | 1,843 | 12.42% |
| 1992 | 5,087 | 28.92% | 9,042 | 51.40% | 3,461 | 19.68% |
| 1988 | 7,040 | 45.61% | 8,295 | 53.74% | 101 | 0.65% |
| 1984 | 8,534 | 52.84% | 7,541 | 46.69% | 77 | 0.48% |
| 1980 | 8,770 | 54.69% | 6,625 | 41.31% | 641 | 4.00% |
| 1976 | 7,445 | 43.90% | 9,306 | 54.87% | 209 | 1.23% |
| 1972 | 10,072 | 56.98% | 7,556 | 42.75% | 47 | 0.27% |
| 1968 | 7,486 | 42.31% | 8,465 | 47.84% | 1,743 | 9.85% |
| 1964 | 6,153 | 34.09% | 11,898 | 65.91% | 0 | 0.00% |
| 1960 | 9,263 | 47.54% | 10,207 | 52.38% | 15 | 0.08% |
| 1956 | 10,282 | 52.91% | 9,093 | 46.79% | 59 | 0.30% |
| 1952 | 9,906 | 50.11% | 9,844 | 49.80% | 17 | 0.09% |
| 1948 | 7,576 | 44.40% | 9,366 | 54.89% | 120 | 0.70% |
| 1944 | 8,995 | 48.79% | 9,360 | 50.77% | 82 | 0.44% |
| 1940 | 10,255 | 46.91% | 11,457 | 52.41% | 150 | 0.69% |
| 1936 | 8,145 | 39.69% | 11,400 | 55.55% | 976 | 4.76% |
| 1932 | 6,096 | 33.42% | 11,515 | 63.12% | 631 | 3.46% |
| 1928 | 9,896 | 56.77% | 7,345 | 42.14% | 190 | 1.09% |
| 1924 | 7,398 | 46.08% | 5,826 | 36.29% | 2,832 | 17.64% |
| 1920 | 7,535 | 52.75% | 5,398 | 37.79% | 1,352 | 9.46% |
| 1916 | 6,923 | 44.12% | 7,982 | 50.87% | 787 | 5.02% |
| 1912 | 1,994 | 25.30% | 3,821 | 48.48% | 2,067 | 26.22% |
| 1908 | 3,686 | 43.63% | 4,156 | 49.19% | 607 | 7.18% |
| 1904 | 3,856 | 49.15% | 3,297 | 42.02% | 693 | 8.83% |
| 1900 | 3,686 | 43.59% | 4,519 | 53.44% | 252 | 2.98% |
| 1896 | 3,857 | 44.74% | 4,639 | 53.82% | 124 | 1.44% |
| 1892 | 2,941 | 40.12% | 3,655 | 49.86% | 735 | 10.03% |
See also
- National Register of Historic Places listings in Christian County, Illinois
References
- Specific
- "State & County QuickFacts". United States Census Bureau. Archived from the original on July 8, 2011. Retrieved July 4, 2014.
- "Find a County". National Association of Counties. Archived from the original on May 31, 2011. Retrieved June 7, 2011.
- Adams, James N. (compiler) (1989), Keller, William E. (ed.), Illinois Place Names, Springfield: Illinois State Historical Society, pp. 575, ISBN 0-912226-24-2
- "Population, Housing Units, Area, and Density: 2010 - County". United States Census Bureau. Archived from the original on February 12, 2020. Retrieved July 11, 2015.
- Ripley, George; Dana, Charles A., eds. (1879). . The American Cyclopædia.
- "Monthly Averages for Taylorville, Illinois". The Weather Channel. Retrieved January 27, 2011.
- "County Population Totals: 2010-2019". Retrieved March 3, 2021.
- "U.S. Decennial Census". United States Census Bureau. Retrieved July 4, 2014.
- "Historical Census Browser". University of Virginia Library. Retrieved July 4, 2014.
- "Population of Counties by Decennial Census: 1900 to 1990". United States Census Bureau. Retrieved July 4, 2014.
- "Census 2000 PHC-T-4. Ranking Tables for Counties: 1990 and 2000" (PDF). United States Census Bureau. Retrieved July 4, 2014.
- "DP-1 Profile of General Population and Housing Characteristics: 2010 Demographic Profile Data". United States Census Bureau. Archived from the original on February 13, 2020. Retrieved July 11, 2015.
- "DP02 SELECTED SOCIAL CHARACTERISTICS IN THE UNITED STATES – 2006-2010 American Community Survey 5-Year Estimates". United States Census Bureau. Archived from the original on February 13, 2020. Retrieved July 11, 2015.
- "DP03 SELECTED ECONOMIC CHARACTERISTICS – 2006-2010 American Community Survey 5-Year Estimates". United States Census Bureau. Archived from the original on February 13, 2020. Retrieved July 11, 2015.
- Leip, David. "Dave Leip's Atlas of U.S. Presidential Elections". uselectionatlas.org. Retrieved October 30, 2018.
- General
- United States Census Bureau 2007 TIGER/Line Shapefiles
- United States Board on Geographic Names (GNIS)
- United States National Atlas
Places adjacent to Christian County, Illinois | ||||||||||||||||
|---|---|---|---|---|---|---|---|---|---|---|---|---|---|---|---|---|
| ||||||||||||||||
Municipalities and communities of Christian County, Illinois, United States | ||
|---|---|---|
County seat: Taylorville | ||
| Cities |
|  |
| Villages |
| |
| Townships |
| |
| CDP | ||
| Other unincorporated communities |
| |
| Footnotes | ‡This populated place also has portions in an adjacent county or counties | |
| ||
Springfield (capital) | ||
| Topics |
|  Seal of Illinois |
| Regions |
| |
| Municipalities |
| |
| Counties |
| |
Authority control | |
|---|---|
| General | |
| National libraries | |
| Other |
|
Другой контент может иметь иную лицензию. Перед использованием материалов сайта WikiSort.org внимательно изучите правила лицензирования конкретных элементов наполнения сайта.
WikiSort.org - проект по пересортировке и дополнению контента Википедии