world.wikisort.org - USA
Ziebach County is a county in the U.S. state of South Dakota. As of the 2020 census, the population was 2,413.[1] Its county seat is Dupree.[2] It is the last county (or county equivalent) in the United States alphabetically.
Ziebach County | |
|---|---|
U.S. county | |
 Ziebach County Courthouse | |
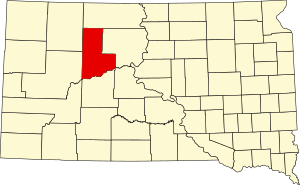 Location within the U.S. state of South Dakota | |
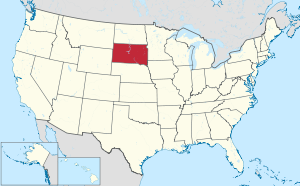 South Dakota's location within the U.S. | |
| Coordinates: 44°59′N 101°40′W | |
| Country | |
| State | |
| Founded | 1911 |
| Named for | Frank M. Ziebach |
| Seat | Dupree |
| Largest city | Dupree |
| Area | |
| • Total | 1,971 sq mi (5,100 km2) |
| • Land | 1,961 sq mi (5,080 km2) |
| • Water | 9.3 sq mi (24 km2) 0.5% |
| Population (2020) | |
| • Total | 2,413 |
| • Estimate (2021) | 2,380 |
| • Density | 1.2/sq mi (0.47/km2) |
| Time zone | UTC−7 (Mountain) |
| • Summer (DST) | UTC−6 (MDT) |
| Congressional district | At-large |
The county's per-capita income makes it the fourth-poorest county in the United States.[3]
History
A county named Ziebach was created in Dakota Territory in 1877. However, after South Dakota became a state, this county was dissolved in 1898 and its areas absorbed by Pennington and Stanley counties. The present Ziebach County was created by the SD Legislature on February 1, 1911, and was fully organized by April 22.[4] The 1911 Ziebach County encompassed parts of the former counties of Schnasse, Armstrong and Sterling, which were the last three extinct counties of South Dakota to cease to exist. It was named for Frank M. Ziebach, a political figure in the Dakota Territory during the territorial period from 1861 to 1889. Previously the area had been used by trappers and in 1907 part was briefly a reservation for Ute Indians displaced from Utah and Wyoming. Early in the 20th Century cattle were raised in substantial numbers, but when the railroad bypassed the area this industry declined. Limited homesteading also occurred on the more fertile lands.[5]
Geography
The Cheyenne River flows east-northeastward along the southern boundary of Ziebach County. The Moreau River flows eastward through the upper portion of the county, and Cherry Creek flows southeastward through the lower portion, draining the area into the Cheyenne River. The terrain is composed of semi-arid rolling hills interrupted by buttes and carved by drainages and gullies, partly devoted to agriculture and cattle.[6] The terrain slopes to the south and the east; its highest point (except for the isolated Thunder Butte, at 2,733') is near its NW corner at 2,582' (787m) ASL.[7] The county has a total area of 1,971 square miles (5,100 km2), of which 1,961 square miles (5,080 km2) is land and 9.3 square miles (24 km2) (0.5%) is water.[8] Almost the entire county lies within the Cheyenne River Indian Reservation. The balance of the county, along its extreme northern county line, lies within the Standing Rock Indian Reservation. It is one of five South Dakota counties that lie entirely on Indian reservations.[9]
Buttes
Ziebach County is part of the Great Plains and is characterized by rolling grasslands and numerous buttes. The buttes form the highest points of elevation in Ziebach County:
- Bessie Butte 2,474 feet (754.08 m)
- Eagle Butte 2,484 feet (757.12 m)
- Gray Butte 2,316 feet (705.92 m)
- High Elk Hill 2,395 feet (730.00 m)
- Joshua Butte 2,165 feet (659.89 m)
- Marple Butte 2,484 feet (757.12 m)
- Mud Butte 2,500 feet (762.00 m)
- Mud Butte 2,365 feet (720.85 m)
- Rattlesnake Butte 2,411 feet (734.87 m)
- Saint Patrick Butte 2,356 feet (718.11 m)
- Squaw Teat Butte[10] 2,365 feet (720.85 m)
- Thunder Butte 2,733 feet (833.02 m)
Major highways
 U.S. Highway 212
 South Dakota Highway 20
 South Dakota Highway 34
 South Dakota Highway 63
 South Dakota Highway 65
 South Dakota Highway 73
Adjacent counties
- Corson County - north
- Dewey County - east
- Stanley County - southeast
- Haakon County - south
- Pennington County - southwest
- Meade County - west
- Perkins County - northwest
Protected areas
- Bednor Lake State Game Production Area
- Cheyenne State Game Production Area (part)
- Grand River National Grassland (part)
Lakes and reservoirs[6]
- Bedners Dam
- K C Dam
- Rattlesnake Lake
Demographics
| Historical population | |||
|---|---|---|---|
| Census | Pop. | %± | |
| 1920 | 3,718 | — | |
| 1930 | 4,039 | 8.6% | |
| 1940 | 2,875 | −28.8% | |
| 1950 | 2,606 | −9.4% | |
| 1960 | 2,495 | −4.3% | |
| 1970 | 2,221 | −11.0% | |
| 1980 | 2,308 | 3.9% | |
| 1990 | 2,220 | −3.8% | |
| 2000 | 2,519 | 13.5% | |
| 2010 | 2,801 | 11.2% | |
| 2020 | 2,413 | −13.9% | |
| 2021 (est.) | 2,380 | [11] | −1.4% |
| US Decennial Census[12] 1790-1960[13] 1900-1990[14] 1990-2000[15] 2010-2020[1] | |||
2000 census
As of the 2000 United States Census,[16] there were 2,519 people, 741 households, and 594 families in the county. The population density was 1.3 people per square mile (0.5/km2). There were 879 housing units at an average density of 0.4 per square mile (0.2/km2). The racial makeup of the county was 72.29% Native American, 26.40% White, 0.08% Asian, 0.12% from other races, and 1.11% from two or more races. 0.99% of the population were Hispanic or Latino of any race.
There were 741 households, out of which 47.2% had children under the age of 18 living with them, 47.9% were married couples living together, 23.8% had a female householder with no husband present, and 19.8% were non-families. 17.4% of all households were made up of individuals, and 5.1% had someone living alone who was 65 years of age or older. The average household size was 3.40 and the average family size was 3.81.
The county population contained 40.6% under the age of 18, 10.8% from 18 to 24, 24.7% from 25 to 44, 16.5% from 45 to 64, and 7.5% who were 65 years of age or older. The median age was 24 years. For every 100 females there were 97.0 males. For every 100 females age 18 and over, there were 98.1 males.
The median income for a household in the county was $18,063, and the median income for a family was $18,672. Males had a median income of $19,038 versus $21,167 for females. The per capita income for the county was $7,463. About 45.20% of families and 49.90% of the population were below the poverty line, including 61.10% of those under age 18 and 27.20% of those age 65 or over. In 2009, it was one of 17 counties in the United States where half of all children live in poverty.
2010 census
As of the 2010 United States Census, there were 2,801 people, 836 households, and 638 families in the county.[17] The population density was 1.4 inhabitants per square mile (0.54/km2). There were 987 housing units at an average density of 0.5 per square mile (0.19/km2).[18] The racial makeup of the county was 74.9% American Indian, 21.8% white, 0.2% black or African American, 0.1% Asian, 0.1% from other races, and 3.0% from two or more races. Those of Hispanic or Latino origin made up 3.1% of the population.[17]
Of the 836 households, 53.7% had children under the age of 18 living with them, 39.0% were married couples living together, 29.3% had a female householder with no husband present, 23.7% were non-families, and 20.9% of all households were made up of individuals. The average household size was 3.35 and the average family size was 3.82. The median age was 25.4 years.[17]
The median income for a household in the county was $27,578 and the median income for a family was $22,857. Males had a median income of $28,954 versus $24,327 for females. The per capita income for the county was $11,069. About 41.9% of families and 46.0% of the population were below the poverty line, including 56.1% of those under age 18 and 22.9% of those age 65 or over.[19]
Communities
Cities
- Dupree (county seat)
- Eagle Butte (partial)
Unincorporated communities[6]
- Bridger
- Chase
- Cherry Creek
- Glad Valley
- Iron Lightning
- Red Elm
- Red Scaffold
- Thunder Butte
Unorganized territories
Ziebach County government does not include subdivision into townships. The county is divided into three areas of unorganized territory: Dupree, North Ziebach, and South Ziebach.
Politics
Ziebach County has traditionally been a swing county. Only Ronald Reagan in 1980 and Barack Obama in 2008 have topped sixty percent for either major party in the past six decades. Donald Trump won 48% of the vote in 2016, being the county or equivalent he won with the highest percentage of Native Americans. Joe Biden won 53% of the vote in 2020.
| Year | Republican | Democratic | Third party | |||
|---|---|---|---|---|---|---|
| No. | % | No. | % | No. | % | |
| 2020 | 404 | 44.59% | 481 | 53.09% | 21 | 2.32% |
| 2016 | 368 | 47.98% | 353 | 46.02% | 46 | 6.00% |
| 2012 | 314 | 41.26% | 439 | 57.69% | 8 | 1.05% |
| 2008 | 312 | 35.02% | 554 | 62.18% | 25 | 2.81% |
| 2004 | 447 | 40.05% | 641 | 57.44% | 28 | 2.51% |
| 2000 | 384 | 53.26% | 314 | 43.55% | 23 | 3.19% |
| 1996 | 375 | 40.32% | 483 | 51.94% | 72 | 7.74% |
| 1992 | 328 | 44.93% | 280 | 38.36% | 122 | 16.71% |
| 1988 | 362 | 45.53% | 427 | 53.71% | 6 | 0.75% |
| 1984 | 429 | 54.17% | 359 | 45.33% | 4 | 0.51% |
| 1980 | 523 | 65.05% | 246 | 30.60% | 35 | 4.35% |
| 1976 | 369 | 48.49% | 370 | 48.62% | 22 | 2.89% |
| 1972 | 486 | 55.86% | 378 | 43.45% | 6 | 0.69% |
| 1968 | 449 | 52.58% | 350 | 40.98% | 55 | 6.44% |
| 1964 | 447 | 44.66% | 554 | 55.34% | 0 | 0.00% |
| 1960 | 568 | 52.59% | 512 | 47.41% | 0 | 0.00% |
| 1956 | 627 | 57.05% | 472 | 42.95% | 0 | 0.00% |
| 1952 | 779 | 67.68% | 372 | 32.32% | 0 | 0.00% |
| 1948 | 463 | 47.24% | 503 | 51.33% | 14 | 1.43% |
| 1944 | 331 | 48.32% | 354 | 51.68% | 0 | 0.00% |
| 1940 | 691 | 50.15% | 687 | 49.85% | 0 | 0.00% |
| 1936 | 561 | 42.53% | 737 | 55.88% | 21 | 1.59% |
| 1932 | 462 | 31.36% | 982 | 66.67% | 29 | 1.97% |
| 1928 | 759 | 55.00% | 615 | 44.57% | 6 | 0.43% |
| 1924 | 659 | 55.01% | 153 | 12.77% | 386 | 32.22% |
| 1920 | 507 | 65.42% | 177 | 22.84% | 91 | 11.74% |
| 1916 | 275 | 54.89% | 211 | 42.12% | 15 | 2.99% |
| 1912 | 0 | 0.00% | 349 | 45.56% | 417 | 54.44% |
See also
- National Register of Historic Places listings in Ziebach County, South Dakota
References
- "2020 Census Results". United States Census Bureau. Retrieved August 14, 2021.
- "Find a County". National Association of Counties. Archived from the original on May 31, 2011. Retrieved June 7, 2011.
- Merchant, N. (February 13, 2011). "A look inside America's poorest county". Associated Press. Retrieved April 4, 2012.
- History of SD Counties/Ziebach (accessed 9 February 2019)
- South Dakota's Ziebach County, History of the Prairie. Dupree SD: Ziebach County Historical Society. 1982. Retrieved November 11, 2012.
- Ziebach County SD Google Maps (accessed 9 February 2019)
- ""Find an Altitude" Google Maps (accessed 9 February 2019)". Archived from the original on May 21, 2019. Retrieved February 9, 2019.
- "2010 Census Gazetteer Files". US Census Bureau. August 22, 2012. Retrieved March 28, 2015.
- The other four are Corson, Dewey, Oglala Lakota, and Todd. In addition, Bennett County lies completely within the boundaries of the Pine Ridge Indian Reservation
- Squaw Teat Butte is the given name of this prominence on the following topographic map of the US Geological Survey: USGS Rattlesnake Butte Quad, South Dakota, Trails.com for the portion of USGS Rattlesnake Butte Quad, with Squaw Teat Butte.
- "Annual Estimates of the Resident Population for Counties: April 1, 2020 to July 1, 2021". Retrieved March 25, 2022.
- "US Decennial Census". US Census Bureau. Retrieved March 28, 2015.
- "Historical Census Browser". University of Virginia Library. Retrieved March 28, 2015.
- Forstall, Richard L., ed. (March 27, 1995). "Population of Counties by Decennial Census: 1900 to 1990". US Census Bureau. Retrieved March 28, 2015.
- "Census 2000 PHC-T-4. Ranking Tables for Counties: 1990 and 2000" (PDF). US Census Bureau. April 2, 2001. Archived (PDF) from the original on October 9, 2022. Retrieved March 28, 2015.
- "U.S. Census website". US Census Bureau. Retrieved May 14, 2011.
- "Profile of General Population and Housing Characteristics: 2010 Demographic Profile Data". US Census Bureau. Archived from the original on February 13, 2020. Retrieved March 12, 2016.
- "Population, Housing Units, Area, and Density: 2010 - County". US Census Bureau. Archived from the original on February 13, 2020. Retrieved March 12, 2016.
- "Selected Economic Characteristics – 2006-2010 American Community Survey 5-Year Estimates". US Census Bureau. Archived from the original on February 13, 2020. Retrieved March 12, 2016.
- Leip, David. "Atlas of US Presidential Elections". uselectionatlas.org. Retrieved April 15, 2018.
Places adjacent to Ziebach County, South Dakota | ||||||||||||||||
|---|---|---|---|---|---|---|---|---|---|---|---|---|---|---|---|---|
| ||||||||||||||||
Municipalities and communities of Ziebach County, South Dakota, United States | ||
|---|---|---|
County seat: Dupree | ||
| Cities | 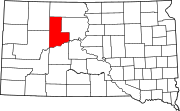 | |
| Unorganized territories |
| |
| CDPs | ||
| Other communities |
| |
| Indian reservations |
| |
| Footnotes | ‡This populated place also has portions in an adjacent county or counties | |
| ||
State of South Dakota | |
|---|---|
Pierre (capital) | |
| Topics |
|
| Society | |
| Regions |
|
| Larger incorporated places pop. over 5,000 | |
| Smaller incorporated places pop. 1,000 - 5,000 |
|
| Largest CDPs pop. over 1,000 |
|
| Counties |
|
Authority control | |
|---|---|
| General | |
| National libraries | |
На других языках
[de] Ziebach County
Ziebach County[1] ist ein County im Bundesstaat South Dakota der Vereinigten Staaten. Es ist eines der ärmsten Countys in den Vereinigten Staaten. Der Sitz der Countyverwaltung (County Seat) ist in Dupree.- [en] Ziebach County, South Dakota
[ru] Зибах
Округ Зибах (англ. Ziebach County) располагается в штате Южная Дакота, США. Официально образован в 1911 году. По состоянию на 2010 год, численность населения составляла 2 801 человек.Другой контент может иметь иную лицензию. Перед использованием материалов сайта WikiSort.org внимательно изучите правила лицензирования конкретных элементов наполнения сайта.
WikiSort.org - проект по пересортировке и дополнению контента Википедии