world.wikisort.org - USA
Charles Mix County is a county in the U.S. state of South Dakota. As of the 2020 United States Census, the population was 9,373.[1] Its county seat is Lake Andes.[2] The county was created in 1862 and organized in 1879.[3] It was named for Charles Eli Mix, an official of the Bureau of Indian Affairs influential in signing a peace treaty with the local Lakota Indian tribes.[4] The easternmost approximately 60% of the county comprises the Yankton Indian Reservation.
Charles Mix County | |
|---|---|
U.S. county | |
 Charles Mix County Courthouse in Lake Andes | |
 Location within the U.S. state of South Dakota | |
 South Dakota's location within the U.S. | |
| Coordinates: 43°13′N 98°35′W | |
| Country | |
| State | |
| Founded | 1862 (created) 1879 (organized) |
| Named for | Charles Eli Mix |
| Seat | Lake Andes |
| Largest city | Wagner |
| Area | |
| • Total | 1,150 sq mi (3,000 km2) |
| • Land | 1,097 sq mi (2,840 km2) |
| • Water | 53 sq mi (140 km2) 4.6% |
| Population (2020) | |
| • Total | 9,373 |
| • Estimate (2021) | 9,163 |
| • Density | 8.2/sq mi (3.1/km2) |
| Time zone | UTC−6 (Central) |
| • Summer (DST) | UTC−5 (CDT) |
| Congressional district | At-large |
| Website | charlesmix |
The Papineau Trading Post, whose building is now in Geddes, South Dakota, was an early county seat.[5] Geddes tried to wrest the county seat from Wheeler in 1900, 1904, and 1908.[6] The Charles Mix County Courthouse in Lake Andes was built in 1918.[6]
Geography
Charles Mix County lies on the south line of South Dakota. Its south boundary line abuts the north boundary line of the state of Nebraska (across the Missouri River, which flows southeastward along the county's south line). A smaller drainage flows south-southwesterly to the river along the east county line, separating it from Bon Homme County. The county terrain consists of rolling hills, mostly dedicated to agriculture.[7] The terrain drops off into the river basin along the county's southwest side, but otherwise generally slopes to the southeast.[8]
The county has a total area of 1,150 square miles (3,000 km2), of which 1,097 square miles (2,840 km2) is land and 53 square miles (140 km2) (4.6%) is water.[9]
Major highways
 U.S. Highway 18
 U.S. Highway 281
 South Dakota Highway 44
 South Dakota Highway 45
 South Dakota Highway 46
 South Dakota Highway 50
 South Dakota Highway 1804
Adjacent counties
- Brule County - northwest
- Aurora County - north
- Douglas County - northeast
- Hutchinson County - northeast
- Bon Homme County - east
- Knox County, Nebraska - southeast
- Boyd County, Nebraska - southwest
- Gregory County - west
Protected areas
- Academy Lake State Game Production Area
- Bovee Lake State Game Production Area[10]
- Central Charles Mix State Game Production Area
- Central Platte State Game Production Area
- Dante Lake State Game Production Area
- Fuchs Waterfowl Production Area[11]
- Gray Area State Game Production Area[12]
- Lake Andes National Wildlife Refuge[13]
- Lake Andes State Game Production Area
- Lake George State Game Production Area[14]
- Missouri National Recreational River (part)
- North Point State Recreation Area
- North Wheeler State Game Production Area
- North Wheeler State Recreation Area
- Paulson State Game Production Area
- Pease Creek State Recreation Area[15]
- Platte Creek State Recreation Area
- Raysby Waterfowl Production Area
- Red Lake State Game Production Area
- Sherman Waterfowl Production Area
- Snake Creek State Recreation Area
- Spillway State Lakeside Use Area
- Trout Waterfowl Production Area[16]
- Tucek Waterfowl Production Area[17]
- Turgeon State Game Production Area
- Van Zee Waterfowl Production Area[18]
- Vanderpol Waterfowl Production Area[19]
- West Platte State Game Production Area
- White Swan State Game Production Area
- White Swan State Lakeside Use Area
- Williamson state Game Production Area
Major lakes
- Academy Lake
- Carroll Lake
- Lake Francis Case (part)
- Goose Lake
- Lake Andes
- Lake Platte
- White Lake
Demographics
| Historical population | |||
|---|---|---|---|
| Census | Pop. | %± | |
| 1870 | 152 | — | |
| 1880 | 407 | 167.8% | |
| 1890 | 4,178 | 926.5% | |
| 1900 | 8,498 | 103.4% | |
| 1910 | 14,899 | 75.3% | |
| 1920 | 16,256 | 9.1% | |
| 1930 | 16,703 | 2.7% | |
| 1940 | 13,449 | −19.5% | |
| 1950 | 15,558 | 15.7% | |
| 1960 | 11,785 | −24.3% | |
| 1970 | 9,994 | −15.2% | |
| 1980 | 9,680 | −3.1% | |
| 1990 | 9,131 | −5.7% | |
| 2000 | 9,350 | 2.4% | |
| 2010 | 9,129 | −2.4% | |
| 2020 | 9,373 | 2.7% | |
| 2021 (est.) | 9,163 | [20] | −2.2% |
| US Decennial Census[21] 1790-1960[22] 1900-1990[23] 1990-2000[24] 2010-2020[1] | |||
2000 census
As of the 2000 census, there were 9,350 people, 3,343 households, and 2,326 families in the county. The population density was 8 people per square mile (3/km2). There were 3,853 housing units at an average density of 4 per square mile (1/km2). The racial makeup of the county was 69.65% White, 0.13% Black or African American, 28.28% Native American, 0.10% Asian, 0.01% Pacific Islander, 0.47% from other races, and 1.37% from two or more races. 1.89% of the population were Hispanic or Latino of any race. 23.9% were of German, 10.2% Czech, 10.1% Dutch and 5.5% Norwegian ancestry.
There were 3,343 households, out of which 34.20% had children under the age of 18 living with them, 53.10% were married couples living together, 11.70% had a female householder with no husband present, and 30.40% were non-families. 28.30% of all households were made up of individuals, and 15.10% had someone living alone who was 65 years of age or older. The average household size was 2.74 and the average family size was 3.37.
The county population contained 32.00% under the age of 18, 7.10% from 18 to 24, 23.20% from 25 to 44, 20.40% from 45 to 64, and 17.30% who were 65 years of age or older. The median age was 36 years. For every 100 females there were 96.60 males. For every 100 females age 18 and over, there were 94.10 males.
The median income for a household in the county was $26,060, and the median income for a family was $30,688. Males had a median income of $24,747 versus $19,688 for females. The per capita income for the county was $11,502. About 20.80% of families and 26.90% of the population were below the poverty line, including 35.50% of those under age 18 and 21.00% of those age 65 or over.
2010 census
As of the 2010 census, there were 9,129 people, 3,249 households, and 2,222 families in the county.[25] The population density was 8.3 inhabitants per square mile (3.2/km2). There were 3,849 housing units at an average density of 3.5 per square mile (1.4/km2).[26] The racial makeup of the county was 65.0% white, 31.7% American Indian, 0.2% Asian, 0.1% black or African American, 0.3% from other races, and 2.7% from two or more races. Those of Hispanic or Latino origin made up 1.7% of the population.[25] In terms of ancestry, 30.2% were German, 12.0% were Dutch, 11.7% were Czech, 6.8% were Norwegian, 5.1% were Irish, and 1.8% were American.[27]
Of the 3,249 households, 33.7% had children under the age of 18 living with them, 50.0% were married couples living together, 12.9% had a female householder with no husband present, 31.6% were non-families, and 29.0% of all households were made up of individuals. The average household size was 2.63 and the average family size was 3.23. The median age was 38.2 years.[25]
The median income for a household in the county was $35,808 and the median income for a family was $46,962. Males had a median income of $33,477 versus $25,740 for females. The per capita income for the county was $17,403. About 17.4% of families and 24.0% of the population were below the poverty line, including 32.9% of those under age 18 and 15.6% of those age 65 or over.[28]
Communities

Reservation
- Yankton Sioux Tribe
Cities
- Geddes
- Lake Andes (county seat)
- Platte
- Wagner
Towns
Census-designated place
Townships
- Bryan
- Carroll
- Choteau Creek
- Darlington
- Forbes
- Goose Lake
- Hamilton
- Highland
- Howard
- Jackson
- Kennedy
- La Roche
- Lake George
- Lawrence
- Lone Tree
- Moore
- Platte
- Plain Center
- Rhoda
- Roe
- Rouse
- Signal
- Waheheh
- White Swan
Unorganized territory
The unorganized territory of Castalia is located in the county.
Notable residents
- Ella Deloria, Yankton Dakota ethnologist
- Doug Eggers, American football player
- Faith Spotted Eagle, first Native American woman to receive an electoral college vote for President of the United States (2016).
- Jack Sully was elected sheriff in 1872.
Politics
Charles Mix County, more akin to the Midwest than the Great Plains, up until recently favored the Democratic Party. It was one of only 130 counties nationwide to be won in 1972 by favorite son George McGovern, and it was only once carried by a Republican nominee between 1932 and 1976 – when Dwight D. Eisenhower swept every county in South Dakota in 1952. Both George W. Bush in 2000 and Donald Trump in 2016 easily exceeded the previous best Republican performance in the county.
| Year | Republican | Democratic | Third party | |||
|---|---|---|---|---|---|---|
| No. | % | No. | % | No. | % | |
| 2020 | 2,552 | 67.46% | 1,177 | 31.11% | 54 | 1.43% |
| 2016 | 2,382 | 69.39% | 935 | 27.24% | 116 | 3.38% |
| 2012 | 2,230 | 59.25% | 1,483 | 39.40% | 51 | 1.35% |
| 2008 | 2,109 | 53.02% | 1,807 | 45.42% | 62 | 1.56% |
| 2004 | 2,556 | 53.27% | 2,155 | 44.91% | 87 | 1.81% |
| 2000 | 2,205 | 61.61% | 1,300 | 36.32% | 74 | 2.07% |
| 1996 | 1,711 | 42.40% | 1,913 | 47.41% | 411 | 10.19% |
| 1992 | 1,570 | 38.30% | 1,639 | 39.99% | 890 | 21.71% |
| 1988 | 1,966 | 46.99% | 2,205 | 52.70% | 13 | 0.31% |
| 1984 | 2,660 | 58.29% | 1,879 | 41.18% | 24 | 0.53% |
| 1980 | 2,608 | 56.71% | 1,741 | 37.86% | 250 | 5.44% |
| 1976 | 1,779 | 40.49% | 2,593 | 59.01% | 22 | 0.50% |
| 1972 | 2,020 | 42.79% | 2,691 | 57.00% | 10 | 0.21% |
| 1968 | 2,093 | 44.77% | 2,369 | 50.67% | 213 | 4.56% |
| 1964 | 1,625 | 31.78% | 3,488 | 68.22% | 0 | 0.00% |
| 1960 | 2,446 | 47.04% | 2,754 | 52.96% | 0 | 0.00% |
| 1956 | 2,202 | 41.40% | 3,117 | 58.60% | 0 | 0.00% |
| 1952 | 3,316 | 54.31% | 2,790 | 45.69% | 0 | 0.00% |
| 1948 | 1,800 | 36.47% | 3,086 | 62.53% | 49 | 0.99% |
| 1944 | 2,171 | 44.56% | 2,701 | 55.44% | 0 | 0.00% |
| 1940 | 2,993 | 47.54% | 3,303 | 52.46% | 0 | 0.00% |
| 1936 | 2,209 | 31.96% | 4,628 | 66.96% | 75 | 1.09% |
| 1932 | 1,397 | 20.41% | 5,399 | 78.86% | 50 | 0.73% |
| 1928 | 3,087 | 50.28% | 3,039 | 49.50% | 14 | 0.23% |
| 1924 | 1,680 | 31.22% | 1,306 | 24.27% | 2,396 | 44.52% |
| 1920 | 2,021 | 50.17% | 1,305 | 32.40% | 702 | 17.43% |
| 1916 | 1,450 | 41.26% | 2,011 | 57.23% | 53 | 1.51% |
| 1912 | 0 | 0.00% | 1,625 | 45.84% | 1,920 | 54.16% |
| 1908 | 1,863 | 55.88% | 1,391 | 41.72% | 80 | 2.40% |
| 1904 | 1,765 | 64.84% | 823 | 30.24% | 134 | 4.92% |
| 1900 | 1,108 | 50.43% | 1,058 | 48.16% | 31 | 1.41% |
| 1896 | 698 | 53.57% | 594 | 45.59% | 11 | 0.84% |
| 1892 | 516 | 57.40% | 115 | 12.79% | 268 | 29.81% |
See also
- National Register of Historic Places listings in Charles Mix County, South Dakota
References
- "2020 Census Results". US Census Bureau. Retrieved August 14, 2021.
- "Find a County". National Association of Counties. Archived from the original on May 31, 2011. Retrieved June 7, 2011.
- "Dakota Territory, South Dakota, and North Dakota: Individual County Chronologies". Dakota Territory Atlas of Historical County Boundaries. The Newberry Library. 2006. Archived from the original on April 2, 2018. Retrieved March 29, 2015.
- Charles Mix County Archived June 9, 2010, at the Wayback Machine
- J. Michael Peterson (March 26, 1973). "National Register of Historic Places Inventory/Nomination: Geddes Historic District". National Park Service. Retrieved August 1, 2022. With aerial photo from 1955 and others from c.1972
- Mark Hufstetler; Lon Johnson (September 1, 1992). "National Register of Historic Places Registration: Charles Mix County Courthouse". National Park Service. Retrieved August 1, 2022. With 14 photos.
- Charles Mix County SD Google Maps (accessed 31 January 2019)
- ""Find an Altitude" Google Maps (accessed January 31, 2019)". Archived from the original on May 21, 2019. Retrieved January 31, 2019.
- "2010 Census Gazetteer Files". US Census Bureau. August 22, 2012. Retrieved March 23, 2015.
- Bovee Lake State Public Shooting Area, Geddes SD Google Maps (accessed 31 January 2019)
- Fuchs Waterfowl Production Area Google Maps (accessed 31 January 2019)
- Gray State Public Shooting Area, Platte SD Google Maps (accessed 31 January 2019)
- "Google Maps".
- Lake George Public Shooting Area, Platte SD Google Maps (accessed 31 January 2019)
- Pease Creek State Recreation Area Google Maps (accessed 31 January 2019)
- Trout Waterfowl Production Area Google Maps (accessed 31 January 2019)
- Tucek Waterfowl Production Area Google Maps (accessed 31 January 2019)
- Van Zee Waterfowl Production Area Google Maps (accessed 31 January 2019)
- Vanderpol Waterfowl Production Area Google Maps (accessed 31 January 2019)
- "Annual Estimates of the Resident Population for Counties: April 1, 2020 to July 1, 2021". Retrieved March 25, 2022.
- "US Decennial Census". US Census Bureau. Retrieved March 23, 2015.
- "Historical Census Browser". University of Virginia Library. Retrieved March 23, 2015.
- Forstall, Richard L., ed. (March 27, 1995). "Population of Counties by Decennial Census: 1900 to 1990". US Census Bureau. Retrieved March 23, 2015.
- "Census 2000 PHC-T-4. Ranking Tables for Counties: 1990 and 2000" (PDF). US Census Bureau. April 2, 2001. Archived (PDF) from the original on October 9, 2022. Retrieved March 23, 2015.
- "Profile of General Population and Housing Characteristics: 2010 Demographic Profile Data". US Census Bureau. Archived from the original on February 13, 2020. Retrieved March 11, 2016.
- "Population, Housing Units, Area, and Density: 2010 - County". US Census Bureau. Archived from the original on February 13, 2020. Retrieved March 11, 2016.
- "Selected Social Characteristics in the US – 2006-2010 American Community Survey 5-Year Estimates". US Census Bureau. Archived from the original on February 13, 2020. Retrieved March 11, 2016.
- "Selected Economic Characteristics – 2006-2010 American Community Survey 5-Year Estimates". US Census Bureau. Archived from the original on February 13, 2020. Retrieved March 11, 2016.
- Leip, David. "Dave Leip's Atlas of U.S. Presidential Elections". uselectionatlas.org. Retrieved April 13, 2018.
External links
- . The American Cyclopædia. 1879.
Places adjacent to Charles Mix County, South Dakota | ||||||||||||||||
|---|---|---|---|---|---|---|---|---|---|---|---|---|---|---|---|---|
| ||||||||||||||||
Municipalities and communities of Charles Mix County, South Dakota, United States | ||
|---|---|---|
County seat: Lake Andes | ||
| Cities | 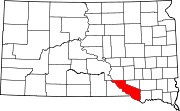 | |
| Towns | ||
| CDPs | ||
| Other communities |
| |
| Indian reservation |
| |
| ||
Authority control | |
|---|---|
| General | |
| National libraries | |
| Other | |
На других языках
[de] Charles Mix County
Charles Mix County[1] ist ein Bezirk im Süden des US-Bundesstaates South Dakota an der Grenze zu Nebraska. Im County leben 9350 Einwohner. Der Verwaltungssitz (County Seat) ist Lake Andes.- [en] Charles Mix County, South Dakota
[ru] Чарльз-Микс
Округ Чарльз Микс (англ. Charles Mix County) располагается в штате Южная Дакота, США. Официально образован в 1862 году. По состоянию на 2010 год, численность населения составляла 9 129 человек.Другой контент может иметь иную лицензию. Перед использованием материалов сайта WikiSort.org внимательно изучите правила лицензирования конкретных элементов наполнения сайта.
WikiSort.org - проект по пересортировке и дополнению контента Википедии