world.wikisort.org - USA
Potter County is a county in the U.S. state of South Dakota. As of the 2020 census, the population was 2,472.[1] Its county seat is Gettysburg.[2] The county was created in 1873 and organized in 1883.[3]
Potter County | |
|---|---|
U.S. county | |
 Potter County Courthouse (July 2013) | |
 Location within the U.S. state of South Dakota | |
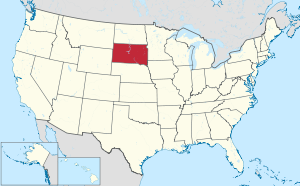 South Dakota's location within the U.S. | |
| Coordinates: 45°04′N 99°57′W | |
| Country | |
| State | |
| Founded | 1873 (created) 1883 (organized) |
| Named for | Joel A. Potter |
| Seat | Gettysburg |
| Largest city | Gettysburg |
| Area | |
| • Total | 899 sq mi (2,330 km2) |
| • Land | 861 sq mi (2,230 km2) |
| • Water | 38 sq mi (100 km2) 4.2% |
| Population (2020) | |
| • Total | 2,472 |
| • Estimate (2021) | 2,475 |
| • Density | 2.7/sq mi (1.1/km2) |
| Time zone | UTC−6 (Central) |
| • Summer (DST) | UTC−5 (CDT) |
| Congressional district | At-large |
Geography
The Missouri River flows southward along the west boundary line of Potter County. The county terrain consists of rolling hills, mostly devoted to agriculture.[4] The county generally slopes to the south, although the western portion slopes into the river valley.[5] The county has a total area of 899 square miles (2,330 km2), of which 861 square miles (2,230 km2) is land and 38 square miles (98 km2) (4.2%) is water.[6]
The eastern portion of South Dakota's counties (48 of 66) observe Central Time; the western counties (18 of 66) observe Mountain Time. Potter County is the westernmost of the SD counties to observe Central Time.[7]
Major highways
 U.S. Highway 83
 U.S. Highway 212
 South Dakota Highway 20
 South Dakota Highway 47
 South Dakota Highway 1804
Adjacent counties
- Walworth County - north
- Edmunds County - northeast
- Faulk County - east
- Hyde County - southeast
- Sully County - south
- Dewey County - west (observes Mountain Time)
Protected areas[4]
- Dodge Draw State Game Production Area
- Dodge Draw State Lakeside Use Area
- East Whitlock State Lakeside Use Area
- Forest City State Game Production Area
- Green Lake State Game Production Area
- Potts Dam State Game Production Area
- Siebrasse State Game Production Area
- West Whitlock State Recreation Area
- Whitlocks Bay State Game Production Area
Lakes[4]
- Green Lake
- Lake Hurley
- Lake Oahe (part)
Demographics
| Historical population | |||
|---|---|---|---|
| Census | Pop. | %± | |
| 1890 | 2,910 | — | |
| 1900 | 2,988 | 2.7% | |
| 1910 | 4,466 | 49.5% | |
| 1920 | 4,382 | −1.9% | |
| 1930 | 5,762 | 31.5% | |
| 1940 | 4,614 | −19.9% | |
| 1950 | 4,688 | 1.6% | |
| 1960 | 4,926 | 5.1% | |
| 1970 | 4,449 | −9.7% | |
| 1980 | 3,674 | −17.4% | |
| 1990 | 3,190 | −13.2% | |
| 2000 | 2,693 | −15.6% | |
| 2010 | 2,329 | −13.5% | |
| 2020 | 2,472 | 6.1% | |
| 2021 (est.) | 2,475 | [8] | 0.1% |
| US Decennial Census[9] 1790-1960[10] 1900-1990[11] 1990-2000[12] 2010-2020[1] | |||
2000 census
As of the 2000 United States Census,[13] there were 2,693 people, 1,145 households, and 767 families in the county. The population density was 3 people per square mile (1/km2). There were 1,760 housing units at an average density of 2 per square mile (1/km2). The racial makeup of the county was 98.14% White, 0.82% Native American, 0.19% Asian, 0.07% from other races, and 0.78% from two or more races. 0.19% of the population were Hispanic or Latino of any race.
There were 1,145 households, out of which 26.60% had children under the age of 18 living with them, 59.20% were married couples living together, 4.90% had a female householder with no husband present, and 33.00% were non-families. 31.30% of all households were made up of individuals, and 17.50% had someone living alone who was 65 years of age or older. The average household size was 2.29 and the average family size was 2.88.
The county population contained 23.00% under the age of 18, 3.90% from 18 to 24, 22.30% from 25 to 44, 25.70% from 45 to 64, and 25.00% who were 65 years of age or older. The median age was 46 years. For every 100 females there were 96.70 males. For every 100 females age 18 and over, there were 94.80 males.
The median income for a household in the county was $30,086, and the median income for a family was $37,827. Males had a median income of $25,320 versus $16,563 for females. The per capita income for the county was $17,417. About 8.90% of families and 12.60% of the population were below the poverty line, including 18.00% of those under age 18 and 12.30% of those age 65 or over.
2010 census
As of the 2010 United States Census, there were 2,329 people, 1,062 households, and 648 families in the county.[14] The population density was 2.7 inhabitants per square mile (1.0/km2). There were 1,500 housing units at an average density of 1.7 per square mile (0.66/km2).[15] The racial makeup of the county was 97.6% white, 0.9% American Indian, 0.3% Asian, 0.1% black or African American, 0.2% from other races, and 0.9% from two or more races. Those of Hispanic or Latino origin made up 0.7% of the population.[14] In terms of ancestry, 65.3% were German, 11.1% were Irish, 8.2% were Norwegian, 8.0% were English, and 3.9% were American.[16]
Of the 1,062 households, 21.7% had children under the age of 18 living with them, 53.0% were married couples living together, 4.2% had a female householder with no husband present, 39.0% were non-families, and 35.5% of all households were made up of individuals. The average household size was 2.13 and the average family size was 2.76. The median age was 50.6 years.[14]
The median income for a household in the county was $42,422 and the median income for a family was $53,214. Males had a median income of $33,750 versus $29,792 for females. The per capita income for the county was $23,986. About 5.4% of families and 10.0% of the population were below the poverty line, including 11.7% of those under age 18 and 10.8% of those age 65 or over.[17]
Communities
City
- Gettysburg (county seat)
Towns
Unincorporated area[4]
- Forest City
Townships
The county has no organized townships. It is divided into three areas of unorganized territory: West Potter, Central Potter, and East Potter.
Politics
Like most of South Dakota outside of Native American counties, Potter County has been predominantly Republican throughout most of the state's history. Only three Democrats – William Jennings Bryan, Franklin D. Roosevelt and Lyndon Johnson – have carried the county as of 2016, and since Jimmy Carter in 1976 no Democrat has passed forty percent of the county's vote.
| Year | Republican | Democratic | Third party | |||
|---|---|---|---|---|---|---|
| No. | % | No. | % | No. | % | |
| 2020 | 1,139 | 82.54% | 227 | 16.45% | 14 | 1.01% |
| 2016 | 1,071 | 80.10% | 215 | 16.08% | 51 | 3.81% |
| 2012 | 1,029 | 74.51% | 339 | 24.55% | 13 | 0.94% |
| 2008 | 937 | 65.07% | 482 | 33.47% | 21 | 1.46% |
| 2004 | 1,143 | 70.64% | 463 | 28.62% | 12 | 0.74% |
| 2000 | 1,112 | 74.43% | 356 | 23.83% | 26 | 1.74% |
| 1996 | 979 | 57.52% | 534 | 31.37% | 189 | 11.10% |
| 1992 | 901 | 50.67% | 493 | 27.73% | 384 | 21.60% |
| 1988 | 1,175 | 62.07% | 701 | 37.03% | 17 | 0.90% |
| 1984 | 1,551 | 76.22% | 482 | 23.69% | 2 | 0.10% |
| 1980 | 1,633 | 75.29% | 436 | 20.10% | 100 | 4.61% |
| 1976 | 1,136 | 55.36% | 908 | 44.25% | 8 | 0.39% |
| 1972 | 1,389 | 61.65% | 858 | 38.08% | 6 | 0.27% |
| 1968 | 1,273 | 57.81% | 780 | 35.42% | 149 | 6.77% |
| 1964 | 954 | 43.09% | 1,260 | 56.91% | 0 | 0.00% |
| 1960 | 1,326 | 56.91% | 1,004 | 43.09% | 0 | 0.00% |
| 1956 | 1,445 | 63.16% | 843 | 36.84% | 0 | 0.00% |
| 1952 | 1,625 | 73.73% | 579 | 26.27% | 0 | 0.00% |
| 1948 | 1,044 | 49.69% | 1,039 | 49.45% | 18 | 0.86% |
| 1944 | 1,001 | 58.27% | 717 | 41.73% | 0 | 0.00% |
| 1940 | 1,278 | 54.80% | 1,054 | 45.20% | 0 | 0.00% |
| 1936 | 914 | 39.64% | 1,338 | 58.02% | 54 | 2.34% |
| 1932 | 660 | 28.09% | 1,668 | 70.98% | 22 | 0.94% |
| 1928 | 1,240 | 52.77% | 1,100 | 46.81% | 10 | 0.43% |
| 1924 | 1,075 | 59.82% | 283 | 15.75% | 439 | 24.43% |
| 1920 | 1,073 | 72.30% | 255 | 17.18% | 156 | 10.51% |
| 1916 | 512 | 54.58% | 408 | 43.50% | 18 | 1.92% |
| 1912 | 0 | 0.00% | 423 | 46.95% | 478 | 53.05% |
| 1908 | 614 | 58.09% | 400 | 37.84% | 43 | 4.07% |
| 1904 | 525 | 62.80% | 275 | 32.89% | 36 | 4.31% |
| 1900 | 375 | 47.95% | 381 | 48.72% | 26 | 3.32% |
| 1896 | 333 | 45.74% | 390 | 53.57% | 5 | 0.69% |
| 1892 | 320 | 51.12% | 57 | 9.11% | 249 | 39.78% |
See also
- National Register of Historic Places listings in Potter County, South Dakota
- Herman Malchow
References
- "2020 Census Results". United States Census Bureau. Retrieved August 14, 2021.
- "Find a County". National Association of Counties. Retrieved June 7, 2011.
- "Dakota Territory, South Dakota, and North Dakota: Individual County Chronologies". Dakota Territory Atlas of Historical County Boundaries. The Newberry Library. 2006. Archived from the original on April 2, 2018. Retrieved March 31, 2015.
- Potter County SD Google Maps (accessed 8 February 2019)
- ""Find an Altitude" Google Maps (accessed February 8, 2019)". Archived from the original on May 21, 2019. Retrieved February 8, 2019.
- "2010 Census Gazetteer Files". US Census Bureau. August 22, 2012. Retrieved March 28, 2015.
- Map of Time Zone Line through South Dakota (accessed 30 January 2019)
- "Annual Estimates of the Resident Population for Counties: April 1, 2020 to July 1, 2021". Retrieved March 25, 2022.
- "US Decennial Census". US Census Bureau. Retrieved March 28, 2015.
- "Historical Census Browser". University of Virginia Library. Retrieved March 28, 2015.
- Forstall, Richard L., ed. (March 27, 1995). "Population of Counties by Decennial Census: 1900 to 1990". US Census Bureau. Retrieved March 28, 2015.
- "Census 2000 PHC-T-4. Ranking Tables for Counties: 1990 and 2000" (PDF). US Census Bureau. April 2, 2001. Archived (PDF) from the original on October 9, 2022. Retrieved March 28, 2015.
- "U.S. Census website". US Census Bureau. Retrieved May 14, 2011.
- "Profile of General Population and Housing Characteristics: 2010 Demographic Profile Data". US Census Bureau. Archived from the original on February 13, 2020. Retrieved March 12, 2016.
- "Population, Housing Units, Area, and Density: 2010 - County". US Census Bureau. Archived from the original on February 13, 2020. Retrieved March 12, 2016.
- "Selected Social Characteristics in the US – 2006-2010 American Community Survey 5-Year Estimates". US Census Bureau. Archived from the original on February 13, 2020. Retrieved March 12, 2016.
- "Selected Economic Characteristics – 2006-2010 American Community Survey 5-Year Estimates". US Census Bureau. Archived from the original on February 13, 2020. Retrieved March 12, 2016.
- Leip, David. "Atlas of US Presidential Elections". uselectionatlas.org. Retrieved April 15, 2018.
Places adjacent to Potter County, South Dakota | ||||||||||||||||
|---|---|---|---|---|---|---|---|---|---|---|---|---|---|---|---|---|
| ||||||||||||||||
Municipalities and communities of Potter County, South Dakota, United States | ||
|---|---|---|
County seat: Gettysburg | ||
| Cities | 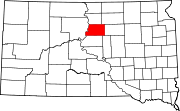 | |
| Towns | ||
| Unincorporated communities |
| |
| Ghost town |
| |
| ||
Authority control | |
|---|---|
| General |
|
| National libraries | |
На других языках
[de] Potter County (South Dakota)
Potter County[1] ist ein County im Bundesstaat South Dakota der Vereinigten Staaten. Der Sitz der Countyverwaltung (County Seat) ist in Gettysburg.- [en] Potter County, South Dakota
[ru] Поттер (округ, Южная Дакота)
Округ Поттер (англ. Potter County) располагается в штате Южная Дакота, США. Официально образован в 1875 году. По состоянию на 2010 год, численность населения составляла 2 329 человек.Другой контент может иметь иную лицензию. Перед использованием материалов сайта WikiSort.org внимательно изучите правила лицензирования конкретных элементов наполнения сайта.
WikiSort.org - проект по пересортировке и дополнению контента Википедии