world.wikisort.org - USA
San Patricio County is located in the U.S. state of Texas. As of the 2020 census, its population was 68,755.[1] Its county seat is Sinton.[2] San Patricio County is part of the Corpus Christi metropolitan statistical area.
San Patricio County | |
|---|---|
U.S. county | |
 Built in 1927 (Henry T. Phelps), this is the eighth structure to serve as the San Patricio County Courthouse in Sinton. | |
 Location within the U.S. state of Texas | |
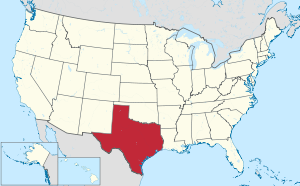 Texas's location within the U.S. | |
| Coordinates: 28°01′N 97°31′W | |
| Country | |
| State | |
| Founded | 1836 |
| Named for | Saint Patrick |
| Seat | Sinton |
| Largest city | Corpus Christi |
| Area | |
| • Total | 708 sq mi (1,830 km2) |
| • Land | 693 sq mi (1,790 km2) |
| • Water | 14 sq mi (40 km2) 2.0%% |
| Population (2020) | |
| • Total | 68,755 |
| • Density | 97/sq mi (37/km2) |
| Time zone | UTC−6 (Central) |
| • Summer (DST) | UTC−5 (CDT) |
| Congressional districts | 27th, 34th |
| Website | www |
History
In 1828, 200 Irish Catholic families, recruited from Ireland and the Irish population of New York City, contracted with the Mexican government to settle on 80 leagues of land in this area. By 1836, about 500 people lived in the colony on 84 Mexican land grants. During the Texas Revolution, most fled from the colony because of fighting in the area. By 1841, a small number of permanent residents had returned. When Texas was annexed by the United States in 1845, the area was stabilized by the presence of U.S. troops under General Zachary Taylor. In 1845, the county was formed (San Patricio is Spanish for Saint Patrick, the primary patron saint of the colonists' home country of Ireland), and Corpus Christi was designated as the county seat. The following year, the county south of the Nueces River was reorganized as Nueces County, and San Patricio became its county seat. In 1848, additional counties were formed out of San Patricio, which further reduced its size.[3]
The 1850 U.S. Census listed only 200 people in the county, including three slaves. The local economy was based on cattle raising. In the mid-1860s, more settlers moved, drawn by the cheap land. By 1870, 602 people lived in the county, and the agricultural census reported 51 farms and ranches, totaling 52,000 acres (210 km2), in the area, with about 2,400 acres (9.7 km2) described as "improved". Development of the county intensified during the early 20th century, as hundreds of farmers moved in from North Texas and other states. The population reached 7,307 by 1910, and was 11,386 by 1920; 470 farms were counted in 1910, and 757 farms in 1920. Cattle ranching remained important, but vegetables and cotton also became important. The acres planted in the cotton increased from about 15,000 acres (61 km2) in 1910 to 155,000 acres (630 km2) by 1930.[3][4] [5]
Geography
According to the U.S. Census Bureau, the county has a total area of 708 sq mi (1,830 km2), of which 693 sq mi (1,790 km2) are land and 14 sq mi (36 km2) (2.0%) are covered by water.[6]
The Gulf of Mexico forms the eastern border of the county.
Major highways
 Interstate 37
 U.S. Highway 77
 Interstate 69E is currently under construction and will follow the current route of U.S. 77 in most places.
 U.S. Highway 181
 State Highway 35
 State Highway 188
 State Highway 359
 State Highway 361
 Farm to Market Road 136
Adjacent counties
- Bee County (north)
- Refugio County (north)
- Aransas County (northeast)
- Nueces County (south)
- Jim Wells County (southwest)
- Live Oak County (northwest)
Demographics
| Historical population | |||
|---|---|---|---|
| Census | Pop. | %± | |
| 1850 | 200 | — | |
| 1860 | 620 | 210.0% | |
| 1870 | 602 | −2.9% | |
| 1880 | 1,010 | 67.8% | |
| 1890 | 1,312 | 29.9% | |
| 1900 | 2,372 | 80.8% | |
| 1910 | 7,307 | 208.1% | |
| 1920 | 11,386 | 55.8% | |
| 1930 | 23,836 | 109.3% | |
| 1940 | 28,871 | 21.1% | |
| 1950 | 35,842 | 24.1% | |
| 1960 | 45,021 | 25.6% | |
| 1970 | 47,288 | 5.0% | |
| 1980 | 58,013 | 22.7% | |
| 1990 | 58,749 | 1.3% | |
| 2000 | 67,138 | 14.3% | |
| 2010 | 64,804 | −3.5% | |
| 2020 | 68,755 | 6.1% | |
| U.S. Decennial Census[7] 1850–2010[8] 2010–2014[9] | |||
| Race | Pop 2010[12] | Pop 2020[13] | % 2010 | % 2020 |
|---|---|---|---|---|
| White (NH) | 27,330 | 26,613 | 42.17% | 38.71% |
| Black or African American (NH) | 902 | 994 | 1.39% | 1.45% |
| Native American or Alaska Native (NH) | 169 | 198 | 0.26% | 0.29% |
| Asian (NH) | 506 | 845 | 0.78% | 1.23% |
| Pacific Islander (NH) | 46 | 66 | 0.07% | 0.1% |
| Some Other Race (NH) | 53 | 227 | 0.08% | 0.33% |
| Mixed/Multi-Racial (NH) | 550 | 1,592 | 0.85% | 2.32% |
| Hispanic or Latino | 35,248 | 38,220 | 54.39% | 55.59% |
| Total | 64,804 | 68,755 |
As of the 2020 United States census, there were 68,755 people, 23,422 households, and 16,838 families residing in the county.
As of the census[14] of 2000, 67,138 people, 22,093 households, and 17,232 families resided in the county. The population density was 97 people/sq mi (37/km2). The 24,864 housing units averaged 36/sq mi (14/km2). The racial makeup of the county was 76.76% White, 2.81% African American, 0.70% Native American, 0.63% Asian, 0.11% Pacific Islander, 15.94% from other races, and 3.05% from two or more races. About 49.42% of the population was Hispanic or Latino of any race.
Of the 22,093 households, 41.6% had children under the age of 18 living with them, 60.6% were married couples living together, 12.7% had a female householder with no husband present, and 22.0% were not families. About 18.7% of all households were made up of individuals, and 8.0% had someone living alone who was 65 or older. The average household size was 2.97, and the average family size was 3.40.
In the county, the age distribution was 31.1% under the age of 18, 10.0% from 18 to 24, 28.2% from 25 to 44, 20.2% from 45 to 64, and 10.5% who were 65 or older. The median age was 32 years. For every 100 females, there were 100.50 males. For every 100 females age 18 and over, there were 98.30 males.
The median income for a household in the county was $34,836, and for a family was $40,002. Males had a median income of $31,132 versus $20,730 for females. The per capita income for the county was $15,425. About 14.60% of families and 18.00% of the population were below the poverty line, including 23.50% of those under age 18 and 16.80% of those age 65 or over.
Communities
Cities (multiple counties)
- Aransas Pass (partly in Aransas and Nueces Counties)
- Corpus Christi (mostly in Nueces County, with small parts in Kleberg and Aransas Counties)
- Ingleside (small part in Nueces County)
- Portland (small part in Nueces County)
- San Patricio (small part in Nueces County)
Cities
Towns
Census-designated places
Unincorporated community
- Sodville
Education
School districts include:
- Aransas Pass Independent School District
- Gregory-Portland Independent School District
- Ingleside Independent School District
- Mathis Independent School District
- Odem-Edroy Independent School District
- Sinton Independent School District
- Taft Independent School District
Del Mar College is the designated community college for all of San Patricio County.[15]
Politics
| Year | Republican | Democratic | Third party | |||
|---|---|---|---|---|---|---|
| No. | % | No. | % | No. | % | |
| 2020 | 16,516 | 63.79% | 8,988 | 34.71% | 387 | 1.49% |
| 2016 | 13,030 | 60.17% | 7,871 | 36.35% | 755 | 3.49% |
| 2012 | 12,005 | 59.79% | 7,856 | 39.13% | 217 | 1.08% |
| 2008 | 12,404 | 57.97% | 8,854 | 41.38% | 138 | 0.64% |
| 2004 | 13,474 | 63.20% | 7,764 | 36.42% | 82 | 0.38% |
| 2000 | 10,599 | 56.68% | 7,840 | 41.93% | 260 | 1.39% |
| 1996 | 7,678 | 45.21% | 8,132 | 47.88% | 1,173 | 6.91% |
| 1992 | 7,456 | 39.48% | 8,202 | 43.43% | 3,229 | 17.10% |
| 1988 | 9,159 | 47.07% | 9,920 | 50.98% | 379 | 1.95% |
| 1984 | 11,074 | 55.48% | 8,838 | 44.27% | 50 | 0.25% |
| 1980 | 8,326 | 47.59% | 8,627 | 49.31% | 541 | 3.09% |
| 1976 | 5,853 | 38.02% | 9,469 | 61.51% | 73 | 0.47% |
| 1972 | 7,179 | 57.42% | 5,097 | 40.77% | 226 | 1.81% |
| 1968 | 3,717 | 29.95% | 6,818 | 54.94% | 1,876 | 15.12% |
| 1964 | 2,188 | 23.32% | 7,176 | 76.47% | 20 | 0.21% |
| 1960 | 3,129 | 37.29% | 5,246 | 62.52% | 16 | 0.19% |
| 1956 | 3,302 | 46.82% | 3,728 | 52.86% | 22 | 0.31% |
| 1952 | 3,220 | 49.24% | 3,315 | 50.69% | 5 | 0.08% |
| 1948 | 963 | 25.19% | 2,649 | 69.29% | 211 | 5.52% |
| 1944 | 878 | 22.86% | 2,712 | 70.61% | 251 | 6.53% |
| 1940 | 980 | 24.73% | 2,963 | 74.77% | 20 | 0.50% |
| 1936 | 482 | 17.69% | 2,213 | 81.21% | 30 | 1.10% |
| 1932 | 407 | 15.86% | 2,142 | 83.48% | 17 | 0.66% |
| 1928 | 1,388 | 70.56% | 579 | 29.44% | 0 | 0.00% |
| 1924 | 987 | 45.63% | 1,097 | 50.72% | 79 | 3.65% |
| 1920 | 308 | 32.25% | 620 | 64.92% | 27 | 2.83% |
| 1916 | 130 | 16.31% | 594 | 74.53% | 73 | 9.16% |
| 1912 | 175 | 19.60% | 551 | 61.70% | 167 | 18.70% |
See also
- Port of Corpus Christi
- National Register of Historic Places listings in San Patricio County, Texas
- Recorded Texas Historic Landmarks in San Patricio County
References
- "QuickFacts: San Patricio County, Texas". U.S. Census Bureau. Retrieved March 27, 2022.
{{cite web}}: CS1 maint: url-status (link) - "Find a County". National Association of Counties. Retrieved June 7, 2011.
- San Patricio County from the Handbook of Texas Online
- Guthrie, Keith; San Patricio County Historical Commission (1986). The history of San Patricio County. Austin, Texas: Eakin Publications. LCCN 87108045. OCLC 1154053506.
- Stewart, Bennie L. (1960). History of San Patricio County. Kingsville, Texas. OCLC 27020541.
- "2010 Census Gazetteer Files". United States Census Bureau. August 22, 2012. Retrieved May 10, 2015.
- "Decennial Census of Population and Housing by Decades". US Census Bureau.
- "Texas Almanac: Population History of Counties from 1850–2010" (PDF). Texas Almanac. Archived (PDF) from the original on October 9, 2022. Retrieved May 10, 2015.
- "State & County QuickFacts". United States Census Bureau. Retrieved December 24, 2013.
- https://www.census.gov/ [not specific enough to verify]
- "About the Hispanic Population and its Origin". www.census.gov. Retrieved May 18, 2022.
- "Explore Census Data". data.census.gov. Retrieved May 21, 2022.
- "Explore Census Data". data.census.gov. Retrieved May 21, 2022.
- "U.S. Census website". United States Census Bureau. Retrieved May 14, 2011.
- Texas Education Code Sec. 130.177. DEL MAR COLLEGE-CORPUS CHRISTI JUNIOR COLLEGE DISTRICT SERVICE AREA.
- Leip, David. "Dave Leip's Atlas of U.S. Presidential Elections". uselectionatlas.org. Retrieved July 30, 2018.
External links
- San Patricio County government's website
- San Patricio County from the Handbook of Texas Online
- Historic San Patricio County materials, hosted by the Portal to Texas History.
- "San Patricio County Profile" from the Texas Association of Counties Archived June 26, 2015, at the Wayback Machine
- Price, W. Armstrong (February 1931). "Discovery of Oil in White Point Gas Field, San Patricio County, Texas, and History of Field: GEOLOGICAL NOTES". AAPG Bulletin. 15 (2): 205–210. doi:10.1306/3d93297e-16b1-11d7-8645000102c1865d. ISSN 0149-1423.
Places adjacent to San Patricio County, Texas | ||||||||||||||||
|---|---|---|---|---|---|---|---|---|---|---|---|---|---|---|---|---|
| ||||||||||||||||
Municipalities and communities of San Patricio County, Texas, United States | ||
|---|---|---|
County seat: Sinton | ||
| Cities | 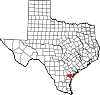 | |
| Towns | ||
| CDPs | ||
| Footnotes | ‡This populated place also has portions in an adjacent county or counties | |
| ||
State of Texas | |
|---|---|
Austin (capital) | |
| Topics |
|
| Society |
|
| Regions |
|
| Metropolitan areas |
|
| Counties | See: List of counties in Texas |
Authority control | |
|---|---|
| General | |
| National libraries | |
| Other | |
На других языках
[de] San Patricio County
Das San Patricio County[1] ist ein County im Bundesstaat Texas der Vereinigten Staaten. Der Sitz der County-Verwaltung (County Seat) befindet sich in Sinton.- [en] San Patricio County, Texas
[ru] Сан-Патрисио (округ)
Округ Сан-Патрисио (англ. San Patricio county) — округ штата Техас Соединённых Штатов Америки. На 2000 год в нем проживало &&&&&&&&&&067249.&&&&&067 249 человек. По оценке бюро переписи населения США в 2009 году население округа составляло &&&&&&&&&&068223.&&&&&068 223 человек.[1] Окружным центром является город Синтон.Другой контент может иметь иную лицензию. Перед использованием материалов сайта WikiSort.org внимательно изучите правила лицензирования конкретных элементов наполнения сайта.
WikiSort.org - проект по пересортировке и дополнению контента Википедии