world.wikisort.org - USA
Hays County is located on the Edwards Plateau in the U.S. state of Texas. Hays County is part of the Austin-Round Rock metropolitan area. As of the 2020 census, its official population had reached 241,067.[1] The county seat is San Marcos.[2] Hays, along with Comal and Kendall Counties, was listed in 2017 as one of the nation's fastest-growing large counties with a population of at least 10,000. From 2015 to 2016, Hays County, third on the national list, had nearly 10,000 new residents during the year.[3]
Hays County | |
|---|---|
U.S. county | |
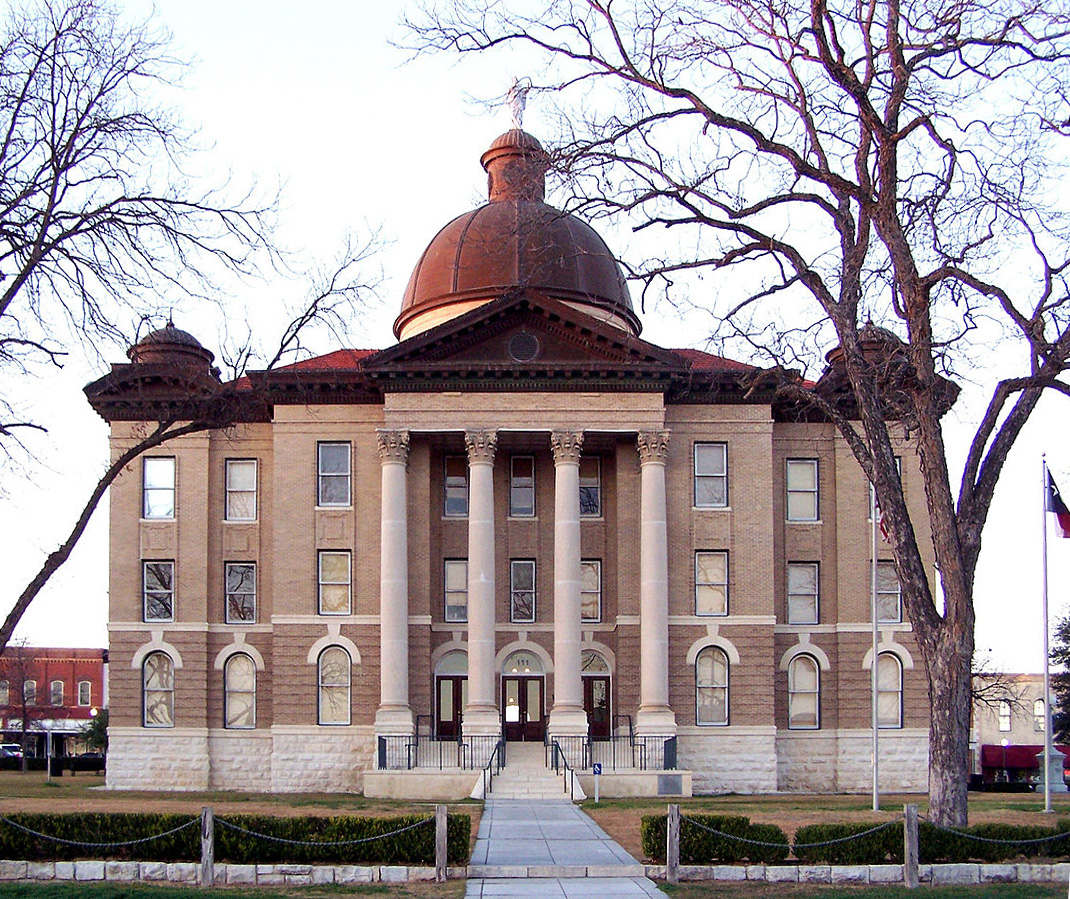 Hays County Courthouse, built in 1908 using the eclectic style of architecture | |
 Location within the U.S. state of Texas | |
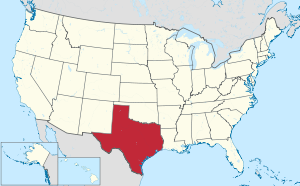 Texas's location within the U.S. | |
| Coordinates: 30°04′N 98°02′W | |
| Country | |
| State | |
| Founded | 1848 |
| Named for | John Coffee Hays |
| Seat | San Marcos |
| Largest city | San Marcos |
| Area | |
| • Total | 680 sq mi (1,800 km2) |
| • Land | 678 sq mi (1,760 km2) |
| • Water | 1.9 sq mi (5 km2) 0.3% |
| Population (2020) | |
| • Total | 241,067 |
| • Density | 350/sq mi (140/km2) |
| Time zone | UTC−6 (Central) |
| • Summer (DST) | UTC−5 (CDT) |
| Congressional districts | 21st, 25th, 35th |
| Website | hayscountytx |


The county is named for John Coffee Hays, a Texas Ranger and Mexican–American War officer.
History
This section is in list format but may read better as prose. (December 2013) |
Hays County has been inhabited for thousands of years. Evidence of Paleo-Indians found in the region goes as far back as 6000 BC.[4] Archeological evidence of native agriculture goes back to 1200 AD.
The earliest Europeans to arrive in the area were explorers and missionaries from the Spanish Empire. Father Isidro Félix de Espinosa, Father Antonio de San Buenaventura y Olivares, and Pedro de Aguirre traveled through the area in 1709.[5] A few years later, French-Canadian Louis Juchereau de St. Denis was attacked by Comanches in 1714.[6]
More permanent European influence was established in 1755, when the Mission San Francisco Xavier de los Dolores was established among the Apache tribe.[7][self-published source?]
- In 1831, Coahuila y Tejas[8] issued a land grant to Juan Martín de Veramendi,[9] to Juan Vicente Campos in 1832,[4] and to Thomas Jefferson Chambers in 1834.[4]
- The Mexican government issued a land grant to the first Anglo-American settler in the county, Thomas G. McGhee of Tennessee, in 1835.[4]
- On March 1, 1848, the legislature formed Hays County from Travis County. The county is named for Tennessee native Captain John Coffee Hays[10] of the Texas Rangers. San Marcos was named as the county seat.[11]
- The legislature established Blanco from part of Hays in 1858, but incorporated part of Comal into Hays. Risher and Hall Stage Lines controls 16 of 31 passenger and mail lines in Texas.[4]
- In 1861, voters in the county favored secession from the Union.[4]
- The legislature transferred more of Comal County to Hays County in 1862.[4]
- In 1867, the first cattle drive from Hays County to Kansas occurred.[4]
- International-Great Northern Railroad was completed from Austin to San Marcos in 1880.[4]
- Camp Ben McCulloch, named after a brigadier general, was organized in 1896 for reunions of United Confederate Veterans.[12]
- A teacher's college, Southwest Texas State Normal School, was established in San Marcos in 1899.[13]
- Wonder Cave opened to the public in 1900.[14]
- The current Hays County Courthouse in San Marcos was erected in 1908. Beaux-Arts style by Architect C.H. Page & Bros.[15]
- The Aquarena Springs tourist site opened in 1928 in San Marcos.[16]
- Lyndon Baines Johnson graduated from Southwest Texas State Teachers College in 1930.[17]
- In 1942, construction of San Marcos Army Air Field began.[18]
- San Marcos Army Air Field was renamed Gary Air Force Base in 1953 to honor Second Lieutenant Arthur Edward Gary, the first San Marcos resident killed in World War II.[18]
- The state legislature resurveyed the Hays and Travis County lines, adding 16,000 acres (65 km2) to Hays County in 1955.[4]
- In 1964, U.S. President Lyndon Johnson announced the establishment of a Job Corps center based at the deactivated Gary Air Force Base.[19]
Geography
According to the U.S. Census Bureau, the county has a total area of 680 sq mi (1,800 km2), of which 678 square miles (1,760 km2) are land and 1.9 sq mi (4.9 km2) (0.3%) are covered by water.[20] The county is predominantly in the Edwards Plateau, with the south east portion in the Texas Blackland Prairies.[21]
Adjacent counties
- Travis County (northeast)
- Caldwell County (southeast)
- Guadalupe County (south)
- Comal County (southwest)
- Blanco County (northwest)
Transportation
Major highways
 Interstate 35
 U.S. Highway 290
 State Highway 21
 State Highway 80
Airport
- San Marcos Regional Airport - general aviation airport without commercial flights
Education
School districts in Hays County include:[22]
- Blanco
- Comal
- Dripping Springs Independent
- Hays Consolidated Independent
- Johnson City
- San Marcos Consolidated
- Wimberley Independent
As of 2020, the county has six high schools, 10 middle schools, and 24 elementary schools.[citation needed]
Higher education in Hays County includes one four-year institution, Texas State University, in San Marcos.
Austin Community College is the designated community college for the whole county.[23] It operates three distance-learning centers that offer basic and early college start classes, along with testing centers for online classes.
Demographics
| Historical population | |||
|---|---|---|---|
| Census | Pop. | %± | |
| 1850 | 387 | — | |
| 1860 | 2,126 | 449.4% | |
| 1870 | 4,088 | 92.3% | |
| 1880 | 7,555 | 84.8% | |
| 1890 | 11,352 | 50.3% | |
| 1900 | 14,142 | 24.6% | |
| 1910 | 15,518 | 9.7% | |
| 1920 | 15,920 | 2.6% | |
| 1930 | 14,915 | −6.3% | |
| 1940 | 15,349 | 2.9% | |
| 1950 | 17,840 | 16.2% | |
| 1960 | 19,934 | 11.7% | |
| 1970 | 27,642 | 38.7% | |
| 1980 | 40,594 | 46.9% | |
| 1990 | 65,614 | 61.6% | |
| 2000 | 97,589 | 48.7% | |
| 2010 | 157,127 | 61.0% | |
| 2020 | 241,067 | 53.4% | |
| U.S. Decennial Census[24] 2010[25] 2020[26] | |||
| Race / Ethnicity | Pop 2010[25] | Pop 2020[26] | % 2010 | % 2020 |
|---|---|---|---|---|
| White alone (NH) | 92,062 | 121,568 | 58.60% | 50.43% |
| Black or African American alone (NH) | 4,970 | 9,004 | 3.16% | 3.74% |
| Native American or Alaska Native alone (NH) | 502 | 599 | 0.32% | 0.25% |
| Asian alone (NH) | 1,699 | 4,822 | 1.08% | 2.00% |
| Pacific Islander alone (NH) | 104 | 144 | 0.07% | 0.06% |
| Some Other Race alone (NH) | 226 | 1,009 | 0.14% | 0.42% |
| Mixed Race/Multi-Racial (NH) | 2,143 | 11,050 | 1.36% | 4.58% |
| Hispanic or Latino (any race) | 55,401 | 92,871 | 35.26% | 38.52% |
| Total | 157,107 | 241,067 | 100.00% | 100.00% |
Note: the US Census treats Hispanic/Latino as an ethnic category. This table excludes Latinos from the racial categories and assigns them to a separate category. Hispanics/Latinos can be of any race.
As of the 2015 Texas population estimate program, the county's population was 193,963: non-Hispanic Whites, 106,919 (55.1%); non-Hispanic Blacks, 5,860 (3.0%); other non-Hispanics, 6,624 (3.4%); and Hispanics and Latinos (of any race), 74,560 (38.4%).[27]
As of the census[28] of 2000, 97,589 people, 51,265 households, and 22,150 families resided in the county. The population density was 144 people per square mile (56/km2). The 55,643 housing units averaged 53 per mi2 (20/km2). The racial makeup of the county was 78.92% White, 3.68% Black or African American, 0.69%Native American, 0.79% Asian, 0.07% Pacific Islander, 13.36% from other races, and 2.49% from two or more races. About 29.57% of the population were Hispanic or Latino of any race.
Of the 33,410 households, 34.00% had children under the age of 18 living with them, 53.10% were married couples living together, 9.00% had a female householder with no husband present, and 33.70% were not families; 21.00% of all households were made up of individuals, and 4.90% had someone living alone who was 65 years of age or older. The average household size was 2.69 and the average family size was 3.21.
A Williams Institute analysis of 2010 census data found about 7.4 same-sex couples per 1,000 households in the county.[29]
The county's population was distributed as 24.50% under the age of 18, 20.50% from 18 to 24, 28.20% from 25 to 44, 19.10% from 45 to 64, and 7.70% who were 65 years of age or older. The median age was 28 years. For every 100 females, there were 101.30 males. For every 100 females age 18 and over, there were 99.50 males.
The county's median household income was $45,006 and the median family income was $56,287. Males had a median income of $35,209 versus $27,334 for females. The county's per capita income was $19,931. About 6.40% of families and 14.30% of the population were below the poverty line, including 10.30% of those under age 18 and 9.70% of those age 65 or over.
Politics
Hays County was once strongly Democratic leaning in federal elections. However, like some other suburban counties in the state, the county began trending towards the Republican Party in the 1970s. The county has voted Democratic for governor (in 2018), Senate (in both 2018 and 2020), and President (in 2020).[30] [31]
Until 2020 when Joe Biden did both with 54.4% of the vote, the last Democrat to carry Hays County in a presidential election was Bill Clinton with a plurality of 39.8% of the vote in 1992 and the last Democrat to win a majority of the vote in the county was Jimmy Carter, also with 54.4% in 1976. Both which Lloyd Bentsen had been the last Democratic Senate candidate to carry the county, winning 69.2% of the vote in 1988, until 2018, when Beto O'Rourke carried the county with 57.1% of the vote.[32]
| Year | Republican | Democratic | Third party | |||
|---|---|---|---|---|---|---|
| No. | % | No. | % | No. | % | |
| 2020 | 47,680 | 43.59% | 59,524 | 54.41% | 2,191 | 2.00% |
| 2016 | 33,826 | 46.87% | 33,224 | 46.04% | 5,114 | 7.09% |
| 2012 | 31,661 | 53.65% | 25,537 | 43.27% | 1,813 | 3.07% |
| 2008 | 29,638 | 50.19% | 28,431 | 48.15% | 983 | 1.66% |
| 2004 | 27,021 | 56.50% | 20,110 | 42.05% | 692 | 1.45% |
| 2000 | 20,170 | 58.78% | 11,387 | 33.18% | 2,760 | 8.04% |
| 1996 | 12,865 | 47.93% | 11,580 | 43.14% | 2,395 | 8.92% |
| 1992 | 10,008 | 36.70% | 10,842 | 39.76% | 6,417 | 23.53% |
| 1988 | 11,716 | 50.36% | 11,187 | 48.09% | 361 | 1.55% |
| 1984 | 12,467 | 64.98% | 6,663 | 34.73% | 57 | 0.30% |
| 1980 | 6,517 | 49.04% | 6,013 | 45.25% | 759 | 5.71% |
| 1976 | 5,714 | 44.38% | 7,005 | 54.41% | 156 | 1.21% |
| 1972 | 5,406 | 56.79% | 4,068 | 42.74% | 45 | 0.47% |
| 1968 | 1,993 | 32.23% | 3,546 | 57.35% | 644 | 10.42% |
| 1964 | 1,279 | 25.26% | 3,780 | 74.64% | 5 | 0.10% |
| 1960 | 1,606 | 35.46% | 2,916 | 64.39% | 7 | 0.15% |
| 1956 | 1,873 | 47.98% | 2,017 | 51.66% | 14 | 0.36% |
| 1952 | 2,135 | 50.74% | 2,070 | 49.19% | 3 | 0.07% |
| 1948 | 555 | 18.58% | 2,239 | 74.96% | 193 | 6.46% |
| 1944 | 495 | 20.39% | 1,690 | 69.60% | 243 | 10.01% |
| 1940 | 453 | 16.02% | 2,371 | 83.84% | 4 | 0.14% |
| 1936 | 286 | 12.66% | 1,964 | 86.94% | 9 | 0.40% |
| 1932 | 220 | 10.73% | 1,822 | 88.88% | 8 | 0.39% |
| 1928 | 1,088 | 63.70% | 620 | 36.30% | 0 | 0.00% |
| 1924 | 394 | 18.86% | 1,616 | 77.36% | 79 | 3.78% |
| 1920 | 242 | 14.61% | 1,075 | 64.92% | 339 | 20.47% |
| 1916 | 123 | 10.86% | 995 | 87.82% | 15 | 1.32% |
| 1912 | 60 | 5.63% | 939 | 88.17% | 66 | 6.20% |
Ann Richards was the last Democratic gubernatorial candidate to win the county with 56.6% of the vote in 1990, until Lupe Valdez won with a 49.6% plurality in 2018.[32]
Democratic voters mostly reside along the I-35 Corridor and communities East. Communities West of the I-35 Corridor lean Republican. San Marcos, home of Texas State University, and the city of Kyle generally vote Democratic. Buda, Dripping Springs, and Wimberley generally vote Republican.
Communities
Cities (multiple counties)
- Austin (primarily in Travis County and a small part in Williamson County)[34]
- Niederwald (partly in Caldwell County)
- San Marcos (county seat) (small parts in Caldwell and Guadalupe counties)
- Uhland (partly in Caldwell County)
Cities
Village
Census-designated places
Ghost town
Gallery

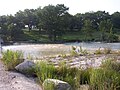
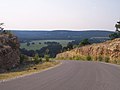 Texas Hill Country


See also
- List of museums in Central Texas
- National Register of Historic Places listings in Hays County, Texas
- Recorded Texas Historic Landmarks in Hays County
References
- "Hays County, Texas". United States Census Bureau. Retrieved January 30, 2022.
- "Find a County". National Association of Counties. Retrieved June 7, 2011.
- Zeke MacCormack, "Folks flocking to area counties: Kendall, Comal, and Hays are on the top 10 list", San Antonio Express-News, March 24, 2017, pp. 1, A11.
- Cecil, Paul F; Greene, Daniel P. "Hays County, Texas". Handbook of Texas Online. Texas State Historical Association. Retrieved December 1, 2010.
- Foster, William C (1995). Spanish Expeditions into Texas, 1689-1768. University of Texas Press. p. 117. ISBN 978-0-292-72489-1.
- Weddle, Robert S (1991). The French Thorn: Rival Explorers in the Spanish Sea, 1682-1762. TAMU Press. p. 200. ISBN 978-0-89096-480-4.
- Arias, David (2009). The First Catholics of the United States. lulu.com. pp. 180–181. ISBN 978-0-557-07527-0.[self-published source]
- "Coahuila and Tejas". Handbook of Texas Online. Texas State Historical Association. Retrieved December 1, 2010.
- "Juan Martín de Veramendi". Handbook of Texas Online. Texas State Historical Association. Retrieved December 1, 2010.
- Gannett, Henry (1905). The Origin of Certain Place Names in the United States. Govt. Print. Off. pp. 153.
- "San Marcos, Texas". Texas Escapes. Texas Escapes - Blueprints For Travel, LLC. Retrieved December 1, 2010.
- Winfrey, Dorman. "Camp Ben Mcculloch". Handbook of Texas Online. Texas State Historical Association. Retrieved December 1, 2010.
- "San Marcos Campus". Texas State University. Archived from the original on February 12, 2014. Retrieved December 1, 2010.
- "Wonder World Park". Retrieved December 1, 2010.
- "Hays County Courthouse". Texas Escapes. Texas Escapes - Blueprints For Travel, LLC. Retrieved December 1, 2010.
- "Aquarena Springs". Texas State University. Retrieved December 1, 2010.[permanent dead link]
- Pietrusza, David (2008). 1960--LBJ vs. JFK vs. Nixon: The Epic Campaign That Forged Three Presidencies. Union Square Press. p. 20. ISBN 978-1-4027-6114-0.
- Ratisseau, Shirley. "Gary Air Force Base". Handbook of Texas Online. Texas State Historical Association. Retrieved December 1, 2010.
- "Gary Job Corps Center". Handbook of Texas Online. Texas State Historical Association. Retrieved December 1, 2010.
- "2010 Census Gazetteer Files". United States Census Bureau. August 22, 2012. Retrieved April 28, 2015.
- "Texas Conservation Action Plan Ecoregions" (PDF). Texas Parks & Wildlife Department. May 20, 2011.
- "2020 CENSUS - SCHOOL DISTRICT REFERENCE MAP: Hays County, TX" (PDF). U.S. Census Bureau. Archived (PDF) from the original on October 9, 2022. Retrieved June 29, 2022. - List
- Texas Education Code, Sec. 130.166. AUSTIN COMMUNITY COLLEGE DISTRICT SERVICE AREA..
- "Decennial Census of Population and Housing by Decade". US Census Bureau.
- "P2 HISPANIC OR LATINO, AND NOT HISPANIC OR LATINO BY RACE - 2010: DEC Redistricting Data (PL 94-171) - Hays County, Texas". United States Census Bureau.
- "P2 HISPANIC OR LATINO, AND NOT HISPANIC OR LATINO BY RACE - 2020: DEC Redistricting Data (PL 94-171) - Hays County, Texas". United States Census Bureau.
- Estimates of the Population by Age, Sex, and Race/Ethnicity for July 1, 2015 for State of Texas (PDF), July 15, 2015, archived from the original (PDF) on May 4, 2017, retrieved June 8, 2017
- "U.S. Census website". United States Census Bureau. Retrieved May 14, 2011.
- Leonhardt, David; Quealy, Kevin (June 26, 2015), "Where Same-Sex Couples Live", The New York Times, retrieved July 6, 2015
- "Cumulative Report — Official HAYS COUNTY — General Election" (PDF). Hays County, Texas. November 6, 2018. Retrieved January 28, 2021.
- "Hays County Texas 2020 election results" (PDF). Archived (PDF) from the original on October 9, 2022. Retrieved January 28, 2021.
- "Dave Leip's Atlas of U.S. Presidential Elections".
- Leip, David. "Dave Leip's Atlas of U.S. Presidential Elections". uselectionatlas.org. Retrieved July 25, 2018.
- "City of Austin Full Purpose Jurisdiction" (PDF). City of Austin. March 9, 2006. Archived from the original (PDF) on November 16, 2010. Retrieved May 1, 2010.
Further reading
- DeCook, K. James (1963). Geology and Ground-water Resources of Hays County, Texas. Texas Board of Water Engineers. Washington, D.C.: United States Department of the Interior, Geological Survey. OCLC 961366150.
External links
- Hays County government's website Archived September 14, 2017, at the Wayback Machine
- Hays County from the Handbook of Texas Online
- HaysWeb - Hays County Information
- Hays County Historical Commission
Places adjacent to Hays County, Texas | ||||||||||||||||
|---|---|---|---|---|---|---|---|---|---|---|---|---|---|---|---|---|
| ||||||||||||||||
Municipalities and communities of Hays County, Texas, United States | ||
|---|---|---|
County seat: San Marcos | ||
| Cities |  | |
| Village | ||
| CDPs | ||
| Ghost town | ||
| Footnotes | ‡This populated place also has portions in an adjacent county or counties | |
| ||
Austin–Round Rock–San Marcos | |||||
|---|---|---|---|---|---|
| Central city |  | ||||
| Satellite cities | |||||
| Other communities | |||||
| Counties |
| ||||
| Parks and preserves |
| ||||
| Geography |
| ||||
| Bodies of water | |||||
| Transportation |
| ||||
State of Texas | |
|---|---|
Austin (capital) | |
| Topics |
|
| Society |
|
| Regions |
|
| Metropolitan areas |
|
| Counties | See: List of counties in Texas |
Authority control | |
|---|---|
| General | |
| National libraries | |
| Other |
|
На других языках
[de] Hays County
Das Hays County[2] ist ein County im Bundesstaat Texas der Vereinigten Staaten. Der Sitz der County-Verwaltung (County Seat) befindet sich in San Marcos.[3] Das County ist Teil der Region Greater Austin.- [en] Hays County, Texas
[ru] Хейс (округ, Техас)
Округ Хейс (англ. Hays County) расположен в США, штате Техас. На 2000 год численность населения составляла &&&&&&&&&&097582.&&&&&097 582 человек. По оценке бюро переписи населения США в 2009 году население округа составляло &&&&&&&&&0155545.&&&&&0155 545 человек.[2] Окружным центром является город Сан-Маркос.Другой контент может иметь иную лицензию. Перед использованием материалов сайта WikiSort.org внимательно изучите правила лицензирования конкретных элементов наполнения сайта.
WikiSort.org - проект по пересортировке и дополнению контента Википедии