world.wikisort.org - USA
Bee County is a county located in the U.S. state of Texas. It is in South Texas and its county seat is Beeville.[1]
Bee County | |
|---|---|
U.S. county | |
 The Bee County Courthouse in Beeville was built in 1913. | |
 Location within the U.S. state of Texas | |
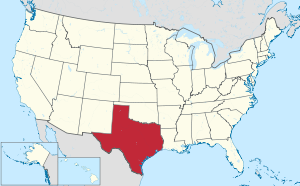 Texas's location within the U.S. | |
| Coordinates: 28°25′N 97°44′W | |
| Country | |
| State | |
| Founded | 1858 |
| Named for | Barnard E. Bee, Sr. |
| Seat | Beeville |
| Largest city | Beeville |
| Area | |
| • Total | 880 sq mi (2,300 km2) |
| • Land | 880 sq mi (2,300 km2) |
| • Water | 0.1 sq mi (0.3 km2) 0.01%% |
| Population (2020) | |
| • Total | 31,047 |
| • Density | 35.3/sq mi (13.6/km2) |
| Time zone | UTC−6 (Central) |
| • Summer (DST) | UTC−5 (CDT) |
| Congressional district | 34th |
| Website | co |
As of the 2020 census, the population was 31,047.[2] The Beeville, TX Micropolitan Statistical Area includes all of Bee County.
The county was founded December 8, 1857, and organized the next year.[3] It is named for Barnard E. Bee, Sr., a secretary of state of the Republic of Texas.
History
On December 8, 1857, the Texas Legislature formed Bee County from sections of Refugio, Live Oak, San Patricio, Goliad and Karnes counties, naming it for Colonel Barnard Elliot Bee who served the Republic of Texas as Sam Houston's Secretary of War and Mirabeau B. Lamar's Secretary of State.[4]
During the Anglo-American land speculation of the 1830s, the area's earliest settlers were mainly Irish immigrants, but by the late 1840s and early 1850s the rise of Jacksonian expansionism inspired Southern whites from the North and South Carolina, Louisiana and Mississippi to occupy and build settlements in the area.[5]
As the constitution of the Republic of Texas no longer recognized the Catholic Church (or any church) as the state religion and slave-holding settlers came to dominate the area in the 1840s, small Methodist, Presbyterian and Baptist congregations began forming with sustained missionary support from these denominations. While research suggests that Baptists and Methodists comprised 65 percent of all Texas congregations by 1870,[6] the reader would be well advised to consider the following contextual factors to avoid falsely minimizing Catholic influence across Texas in general and Bee County in particular:
- A basic familiarity with the unique realities of Catholic-church operations (e.g., holding the Mass as many as six or seven times each Sabbath) suggests that the proliferation of Protestant sanctuaries might not indicate numerical domination or evangelical success.
- Unique global ecclesial priorities and the socio-economic class of local congregants, given the decades of murder and dispossession targeting Spanish-speaking landowners and professionals in South Texas, likely limited the capital available for church construction.
- The repeated official desecration of prominent Catholic churches (e.g., Texas Ranger and militia use of saints' statues for target practice at venerable San Antonio missions) likely dampened the interest among Catholic pastors and congregants to invest in physical infrastructure.
Courthouse
The Bee County Courthouse was designed by the architect William Charles Stephenson, originally from Buffalo, New York. The original courthouse, completed in 1912, cost $72,000. He also sculpted the "Justice Is Blind" monument (In his own words, an "Enlightened Justice") that tops the courthouse; he intentionally chose the "unblindfolded" concept. The structure uses the Chicago window style of a glass pane flanked by two narrow ones. It is classical with the grand portico having Corinthian columns at the entry.[7]
Stephenson also designed the Rialto Theater in Beeville, now used for special occasion, not the running of films, which is located close to the Joe Barnhart Library. He helped construct the death mask of U.S. President William McKinley, who was assassinated in Buffalo in 1901. Stephenson also designed the courthouse in McMullen County, Texas and many other buildings, grand homes, schools, churches, and commercial buildings in and around Beeville.[7]
Geography
According to the U.S. Census Bureau, the county has a total area of 880 square miles (2,300 km2), of which 880 square miles (2,300 km2) are land and 0.1 square miles (0.26 km2) (0.01%) is covered by water.[8] The Aransas River forms in Bee County, southwest of Beeville and north of Skidmore.
Major highways
 U.S. Highway 59
 Interstate 69W is currently under construction and will follow the current route of U.S. 59 in most places.
 U.S. Highway 181
 State Highway 72
 State Highway 202
 State Highway 359
 Farm to Market Road 673
 Farm to Market Road 799
 Farm to Market Road 833
Adjacent counties
- Karnes County (north)
- Goliad County (northeast)
- Refugio County (east)
- San Patricio County (southeast)
- Live Oak County (west)
Demographics
| Historical population | |||
|---|---|---|---|
| Census | Pop. | %± | |
| 1860 | 910 | — | |
| 1870 | 1,082 | 18.9% | |
| 1880 | 2,298 | 112.4% | |
| 1890 | 3,720 | 61.9% | |
| 1900 | 7,720 | 107.5% | |
| 1910 | 12,090 | 56.6% | |
| 1920 | 12,137 | 0.4% | |
| 1930 | 15,721 | 29.5% | |
| 1940 | 16,481 | 4.8% | |
| 1950 | 18,174 | 10.3% | |
| 1960 | 23,755 | 30.7% | |
| 1970 | 22,737 | −4.3% | |
| 1980 | 26,030 | 14.5% | |
| 1990 | 25,135 | −3.4% | |
| 2000 | 32,359 | 28.7% | |
| 2010 | 31,861 | −1.5% | |
| 2020 | 31,047 | −2.6% | |
| U.S. Decennial Census[9] 1850–2010[10] 2010–2020[2] | |||
| Race | Pop 2010[13] | Pop 2020[14] | % 2010 | % 2020 |
|---|---|---|---|---|
| White (NH) | 10,967 | 8,600 | 34.42% | 27.7% |
| Black or African American (NH) | 2,525 | 2,316 | 7.93% | 7.46% |
| Native American or Alaska Native (NH) | 70 | 54 | 0.22% | 0.17% |
| Asian (NH) | 162 | 211 | 0.51% | 0.68% |
| Pacific Islander (NH) | 10 | 2 | 0.03% | 0.01% |
| Some Other Race (NH) | 38 | 65 | 0.12% | 0.21% |
| Mixed/Multi-Racial (NH) | 183 | 407 | 0.57% | 1.31% |
| Hispanic or Latino | 17,906 | 19,392 | 56.2% | 62.46% |
| Total | 31,861 | 31,047 |
As of the 2020 United States census, there were 31,047 people, 8,499 households, and 5,693 families residing in the county. As of the 2010 United States census, 31,861 people were living in the county; 78.8% were White, 8.1% Black or African American, 0.6% Asian, 0.5% Native American, 0.1% Pacific Islander, 9.7% of some other race, and 2.3% of two or more races. About 56.2% were Hispanic or Latino (of any race).
As of the census[15] of 2000, there were 32,359 people, 9,061 households, and 6,578 families living in the county. The population density was 37 people per square mile (14/km2). There were 10,939 housing units at an average density of 12 per square mile (5/km2). The racial makeup of the county was 67.85% White, 9.90% Black or African American, 0.42% Native American, 0.51% Asian, 0.03% Pacific Islander, 19.15% from other races, and 2.13% from two or more races. 53.93% of the population were Hispanic or Latino of any race.
Of the 9,061 households, 37.80% had children under the age of 18 living with them, 52.90% were married couples living together, 14.80% had a female householder with no husband present, and 27.40% were not families. About 23.70% of all households were made up of individuals, and 9.90% had someone living alone who was 65 years of age or older. The average household size was 2.74 and the average family size was 3.25.
In the county, the population was distributed as 23.40% under the age of 18, 13.30% from 18 to 24, 35.40% from 25 to 44, 17.80% from 45 to 64, and 10.20% who were 65 years of age or older. The median age was 32 years. For every 100 females, there were 148.40 males. For every 100 females age 18 and over, there were 164.90 males.
The median income for a household in the county was $28,392, and for a family was $32,967. Males had a median income of $26,473 versus $20,666 for females. The per capita income for the county was $10,625. About 19.70% of families and 24.00% of the population were below the poverty line, including 33.80% of those under age 18 and 18.30% of those age 65 or over.
Government and infrastructure
The Texas Department of Criminal Justice operates the Correctional Institutions Division Region IV Office on the grounds of Chase Field Naval Air Station in unincorporated Bee County.[16] In addition, Garza East Unit and Garza West Unit, transfer facilities, are co-located on the grounds of the naval air station,[17][18] and the McConnell Unit is also in an unincorporated area in Bee County.[19] The Beeville Distribution Center is on the grounds of the air station.[20]
Politics
Bee County is somewhat moderate in comparison to surrounding counties in its support of Republicans in presidential elections. In 2016, Donald Trump won less than 56% of the vote. As recently as 1996 it gave a majority of its votes to the Democratic candidate. [citation needed]
| Year | Republican | Democratic | Third party | |||
|---|---|---|---|---|---|---|
| No. | % | No. | % | No. | % | |
| 2020 | 6,006 | 63.76% | 3,288 | 34.90% | 126 | 1.34% |
| 2016 | 4,744 | 55.91% | 3,444 | 40.59% | 297 | 3.50% |
| 2012 | 4,356 | 55.29% | 3,452 | 43.81% | 71 | 0.90% |
| 2008 | 4,471 | 54.81% | 3,645 | 44.69% | 41 | 0.50% |
| 2004 | 5,428 | 57.03% | 4,045 | 42.50% | 45 | 0.47% |
| 2000 | 4,429 | 53.17% | 3,795 | 45.56% | 106 | 1.27% |
| 1996 | 3,611 | 41.19% | 4,561 | 52.03% | 594 | 6.78% |
| 1992 | 3,633 | 39.89% | 4,083 | 44.83% | 1,392 | 15.28% |
| 1988 | 4,620 | 49.78% | 4,616 | 49.74% | 45 | 0.48% |
| 1984 | 5,377 | 59.32% | 3,659 | 40.37% | 28 | 0.31% |
| 1980 | 4,171 | 52.59% | 3,606 | 45.47% | 154 | 1.94% |
| 1976 | 2,953 | 43.93% | 3,690 | 54.89% | 79 | 1.18% |
| 1972 | 3,779 | 64.42% | 2,067 | 35.24% | 20 | 0.34% |
| 1968 | 1,995 | 35.98% | 2,957 | 53.34% | 592 | 10.68% |
| 1964 | 1,509 | 31.23% | 3,314 | 68.58% | 9 | 0.19% |
| 1960 | 2,220 | 46.38% | 2,557 | 53.42% | 10 | 0.21% |
| 1956 | 2,401 | 55.26% | 1,929 | 44.40% | 15 | 0.35% |
| 1952 | 2,536 | 61.46% | 1,583 | 38.37% | 7 | 0.17% |
| 1948 | 801 | 33.74% | 1,441 | 60.70% | 132 | 5.56% |
| 1944 | 848 | 35.17% | 1,306 | 54.17% | 257 | 10.66% |
| 1940 | 948 | 35.02% | 1,759 | 64.98% | 0 | 0.00% |
| 1936 | 603 | 28.96% | 1,462 | 70.22% | 17 | 0.82% |
| 1932 | 534 | 19.60% | 2,180 | 80.03% | 10 | 0.37% |
| 1928 | 1,189 | 53.18% | 1,043 | 46.65% | 4 | 0.18% |
| 1924 | 944 | 45.45% | 987 | 47.52% | 146 | 7.03% |
| 1920 | 283 | 30.66% | 545 | 59.05% | 95 | 10.29% |
| 1916 | 152 | 19.82% | 584 | 76.14% | 31 | 4.04% |
| 1912 | 35 | 5.91% | 476 | 80.41% | 81 | 13.68% |
Education

These school districts serve Bee County:
- Beeville Independent School District
- Mathis Independent School District (partial)
- Pawnee Independent School District (partial, K-8)
- Pettus Independent School District (partial)
- Refugio Independent School District (partial)
- Skidmore-Tynan Independent School District (partial)
- Three Rivers Independent School District (partial)
Coastal Bend College (formerly Bee County College), a postsecondary institution, serves Bee County among other counties and areas.[22]
Communities

City
- Beeville (county seat)
Census-designated places
Unincorporated communities
- Blanconia
- Cadiz
- Caesar
- Clareville
- Mineral
- Monteola
- Oaks
- Olmos
- Orangedale
- Papalote
- Yougeen
See also
- List of museums in South Texas
- National Register of Historic Places listings in Bee County, Texas
- Recorded Texas Historic Landmarks in Bee County
References
- "Find a County". National Association of Counties. Archived from the original on July 12, 2012. Retrieved June 7, 2011.
- "U.S. Census Bureau QuickFacts: Bee County, Texas". United States Census Bureau. Retrieved January 31, 2022.
- "Texas: Individual County Chronologies". Texas Atlas of Historical County Boundaries. The Newberry Library. 2008. Retrieved May 20, 2015.
- Ezell, Camp (1973). The Historical Story of Bee County, Texas. Beeville, Texas: Beeville Publishing Co. p. 25.
- Jordan, Terry G. (January 1969). "The Origin of Anglo-American Cattle Ranching in Texas: A Documentation of Diffusion from the Lower South". Economic Geography. 45 (45): 63–87. doi:10.2307/143180. JSTOR 143180.
- Pritchard, Linda K. (1988). "A Comparative Approach to Western Religious History: Texas as a Case Study, 1845-1890". The Western Historical Quarterly. 19 (4): 413–430. doi:10.2307/968321. JSTOR 968321.
- Historical Marker, Bee County Courthouse, Beeville, Texas
- "2010 Census Gazetteer Files". United States Census Bureau. August 22, 2012. Retrieved April 19, 2015.
- "Decennial Census of Population and Housing by Decades". US Census Bureau.
- "Texas Almanac: Population History of Counties from 1850–2010" (PDF). Texas Almanac. Archived (PDF) from the original on October 9, 2022. Retrieved April 19, 2015.
- http://www.census.gov [not specific enough to verify]
- "About the Hispanic Population and its Origin". www.census.gov. Retrieved May 18, 2022.
- "Explore Census Data". data.census.gov. Retrieved May 21, 2022.
- "Explore Census Data". data.census.gov. Retrieved May 21, 2022.
- "U.S. Census website". United States Census Bureau. Retrieved May 14, 2011.
- "Correctional Institutions Division Region IV Director's Office Archived 2008-01-21 at the Wayback Machine." Texas Department of Criminal Justice. Retrieved on May 21, 2010.
- "Garza East Unit Archived 2008-01-18 at the Wayback Machine." Texas Department of Criminal Justice. Retrieved on May 21, 2010.
- "Garza West Unit Archived 2010-07-25 at the Wayback Machine." Texas Department of Criminal Justice. Retrieved on May 21, 2010.
- "McConnell Unit Archived 2010-07-25 at the Wayback Machine." Texas Department of Criminal Justice. Retrieved on May 21, 2010.
- "Beeville Distribution Center Archived 2010-07-12 at the Wayback Machine." Texas Department of Criminal Justice. Retrieved on May 22, 2010.
- Leip, David. "Dave Leip's Atlas of U.S. Presidential Elections". uselectionatlas.org. Retrieved July 19, 2018.
- Texas Education Code Sec. 130.167. BEE COUNTY COLLEGE DISTRICT SERVICE AREA. The legislation calls it "Bee County College".
External links
- Bee County government official website
- Bee County, Texas from the Handbook of Texas Online
- Historic Bee County materials, hosted by the Portal to Texas History
- Beeville History
Places adjacent to Bee County, Texas | ||||||||||||||||
|---|---|---|---|---|---|---|---|---|---|---|---|---|---|---|---|---|
| ||||||||||||||||
Municipalities and communities of Bee County, Texas, United States | ||
|---|---|---|
County seat: Beeville | ||
| City |  | |
| CDPs | ||
| Unincorporated communities |
| |
| ||
State of Texas | |
|---|---|
Austin (capital) | |
| Topics |
|
| Society |
|
| Regions |
|
| Metropolitan areas |
|
| Counties | See: List of counties in Texas |
Authority control | |
|---|---|
| General | |
| National libraries | |
| Other | |
На других языках
[de] Bee County
Das Bee County[3] ist ein County im Bundesstaat Texas der Vereinigten Staaten. Der Sitz der County-Verwaltung (County Seat) befindet sich in Beeville.[4]- [en] Bee County, Texas
[ru] Би (округ)
О́круг Би (англ. Bee county) — округ штата Техас Соединённых Штатов Америки. На 2000 год в нём проживало &&&&&&&&&&032359.&&&&&032 359 человек. По оценке бюро переписи населения США в 2008 году население округа составляло &&&&&&&&&&032661.&&&&&032 661 человек.[1] Окружным центром является город Бивилл.Другой контент может иметь иную лицензию. Перед использованием материалов сайта WikiSort.org внимательно изучите правила лицензирования конкретных элементов наполнения сайта.
WikiSort.org - проект по пересортировке и дополнению контента Википедии