world.wikisort.org - USA
Wichita County (/ˈwɪtʃɪtɔː/ WITCH-i-taw) is a county located in the U.S. state of Texas. As of the 2020 census, its population was 129,350.[1] The county seat is Wichita Falls.[2] The county was created in 1858 and organized in 1882.[3] Wichita County is part of the Wichita Falls, Texas, TX Metropolitan Statistical Area.
Wichita County | |
|---|---|
U.S. county | |
 The Wichita County Courthouse in downtown Wichita Falls | |
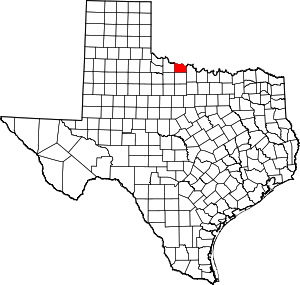 Location within the U.S. state of Texas | |
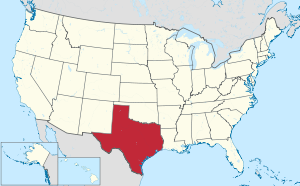 Texas's location within the U.S. | |
| Coordinates: 33°59′N 98°43′W | |
| Country | |
| State | |
| Founded | February 1, 1882 |
| Seat | Wichita Falls |
| Largest city | Wichita Falls |
| Area | |
| • Total | 633 sq mi (1,640 km2) |
| • Land | 628 sq mi (1,630 km2) |
| • Water | 5.3 sq mi (14 km2) 0.8% |
| Population (2020) | |
| • Total | 129,350 |
| • Density | 200/sq mi (79/km2) |
| Time zone | UTC−6 (Central) |
| • Summer (DST) | UTC−5 (CDT) |
| Congressional district | 13th |
| Website | wichitacountytx |
Geography
According to the U.S. Census Bureau, the county has a total area of 633 square miles (1,640 km2), of which 628 square miles (1,630 km2) is land and 5.3 square miles (14 km2) (0.8%) is water.[4] The county is drained by the Wichita River and other streams.[5]
Major highways
 Interstate 44
 U.S. Highway 82
 U.S. Highway 277
 U.S. Highway 281
 U.S. Highway 287
 State Highway 25
 State Highway 79
 State Highway 240
 State Highway 258
Adjacent counties
- Tillman County, Oklahoma (north)
- Cotton County, Oklahoma (northeast)
- Clay County (east)
- Archer County (south)
- Wilbarger County (west)
- Baylor County (southwest)
Geology
Wichita County is part of the Texas Red Beds, which are strata of red-colored sedimentary rock from the Early Permian. The fossils of Permian period vertebrates in the Texas Red Beds were first discovered by Edward Drinker Cope in 1877.[6][7] Subsequent research has revealed rare fossils of Permian period amphibians like Trimerorhachis,[8] as well as rich deposits of other Permian tetrapods such as Dimetrodon and Diadectes.[9]
Demographics
| Historical population | |||
|---|---|---|---|
| Census | Pop. | %± | |
| 1880 | 433 | — | |
| 1890 | 4,831 | 1,015.7% | |
| 1900 | 5,806 | 20.2% | |
| 1910 | 16,094 | 177.2% | |
| 1920 | 72,911 | 353.0% | |
| 1930 | 74,416 | 2.1% | |
| 1940 | 73,604 | −1.1% | |
| 1950 | 98,493 | 33.8% | |
| 1960 | 123,528 | 25.4% | |
| 1970 | 120,563 | −2.4% | |
| 1980 | 121,082 | 0.4% | |
| 1990 | 122,378 | 1.1% | |
| 2000 | 131,664 | 7.6% | |
| 2010 | 131,500 | −0.1% | |
| 2020 | 129,350 | −1.6% | |
| U.S. Decennial Census[10] 1850–2010[11] 2020[12] | |||
| Race / Ethnicity | Pop 2010[13] | Pop 2020[12] | % 2010 | % 2020 |
|---|---|---|---|---|
| White alone (NH) | 90,001 | 79,694 | 68.44% | 61.61% |
| Black or African American alone (NH) | 13,322 | 13,379 | 10.13% | 10.34% |
| Native American or Alaska Native alone (NH) | 1,087 | 992 | 0.83% | 0.77% |
| Asian alone (NH) | 2,586 | 2,647 | 1.97% | 2.05% |
| Pacific Islander alone (NH) | 85 | 140 | 0.06% | 0.11% |
| Some Other Race alone (NH) | 109 | 476 | 0.08% | 0.37% |
| Mixed Race/Multi-Racial (NH) | 2,451 | 6,219 | 1.86% | 4.81% |
| Hispanic or Latino (any race) | 21,859 | 25,803 | 16.62% | 19.95% |
| Total | 131,500 | 129,350 | 100.00% | 100.00% |
Note: the US Census treats Hispanic/Latino as an ethnic category. This table excludes Latinos from the racial categories and assigns them to a separate category. Hispanics/Latinos can be of any race.
As of the census[14] of 2000, there were 131,664 people, 48,441 households, and 32,891 families residing in the county. The population density was 210 people per square mile (81/km2). There were 53,304 housing units at an average density of 85 per square mile (33/km2). The racial makeup of the county was 78.76% White, 10.23% Black or African American, 0.89% Native American, 1.84% Asian, 0.09% Pacific Islander, 5.51% from other races, and 2.68% from two or more races. 12.23% of the population were Hispanic or Latino of any race.
There were 48,441 households, out of which 33.60% had children under the age of 18 living with them, 52.30% were married couples living together, 11.90% had a female householder with no husband present, and 32.10% were non-families. In 2000, there were 1,869 unmarried partner households: 1,677 heterosexual, 94 same-sex male, and 98 same-sex female.
27.20% of all households were made up of individuals, and 10.60% had someone living alone who was 65 years of age or older. The average household size was 2.49 and the average family size was 3.04.
In the county, the population was spread out, with 25.20% under the age of 18, 13.70% from 18 to 24, 29.00% from 25 to 44, 19.50% from 45 to 64, and 12.70% who were 65 years of age or older. The median age was 33 years. For every 100 females, there were 103.80 males. For every 100 females age 18 and over, there were 103.40 males.
The median income for a household in the county was $33,780, and the median income for a family was $40,937. Males had a median income of $28,687 versus $21,885 for females. The per capita income for the county was $16,965. About 10.30% of families and 13.20% of the population were below the poverty line, including 17.40% of those under age 18 and 9.80% of those age 65 or over.
Government and infrastructure
The Texas Department of Criminal Justice James V. Allred Unit is located in Wichita Falls.[15][16][17][18] Wichita County Commissioner Court members: County Judge Woodrow “Woody” Gossom, Commissioner Pct. 1 Mark Beauchamp, Commissioner Pct. 2 Mickey Fincannon, Commissioner Pct. 3 Barry Mahler, and Commissioner Pct. 4 Jeff Watts
The Sheriff of Wichita County is David Duke. He first took office on January 1, 2009.[19]
Politics
Wichita County is represented in the Texas House of Representatives by the Republican James Frank, a businessman from Wichita Falls. Wichita County has about 77% of the population of Texas' 69th state house district, 18% of the population of the 13th congressional district, and 15% of the population of the 30th state senate district.
Presidential elections
In 2008, Wichita County cast the majority of its votes for Republican John McCain. He won 69% of the vote and 31,673 votes. Democrat Barack Obama received 30% of the vote and 13,828 votes. Other candidates received 1% of the vote. In 2004, Republican George W. Bush did better than John McCain and won 71% of the vote and 32,472 votes. Democrat John F. Kerry won 28% of the vote and 12,819 votes.
| Year | Republican | Democratic | Third party | |||
|---|---|---|---|---|---|---|
| No. | % | No. | % | No. | % | |
| 2020 | 32,069 | 69.65% | 13,161 | 28.59% | 810 | 1.76% |
| 2016 | 27,631 | 72.49% | 8,770 | 23.01% | 1,718 | 4.51% |
| 2012 | 29,812 | 72.68% | 10,525 | 25.66% | 681 | 1.66% |
| 2008 | 31,731 | 69.01% | 13,868 | 30.16% | 383 | 0.83% |
| 2004 | 32,472 | 71.30% | 12,819 | 28.15% | 254 | 0.56% |
| 2000 | 27,802 | 65.09% | 14,108 | 33.03% | 803 | 1.88% |
| 1996 | 20,495 | 51.30% | 15,775 | 39.49% | 3,680 | 9.21% |
| 1992 | 17,956 | 38.53% | 17,021 | 36.52% | 11,631 | 24.95% |
| 1988 | 23,324 | 56.08% | 17,956 | 43.17% | 310 | 0.75% |
| 1984 | 28,932 | 64.18% | 16,009 | 35.51% | 139 | 0.31% |
| 1980 | 22,884 | 54.98% | 17,657 | 42.42% | 1,084 | 2.60% |
| 1976 | 19,024 | 46.10% | 22,017 | 53.35% | 225 | 0.55% |
| 1972 | 25,197 | 68.69% | 10,948 | 29.85% | 537 | 1.46% |
| 1968 | 11,937 | 35.72% | 15,387 | 46.05% | 6,090 | 18.23% |
| 1964 | 8,585 | 30.96% | 19,131 | 68.99% | 14 | 0.05% |
| 1960 | 12,587 | 46.25% | 14,587 | 53.60% | 39 | 0.14% |
| 1956 | 12,181 | 48.83% | 12,726 | 51.01% | 41 | 0.16% |
| 1952 | 12,197 | 47.40% | 13,505 | 52.49% | 29 | 0.11% |
| 1948 | 2,887 | 18.20% | 12,235 | 77.11% | 744 | 4.69% |
| 1944 | 1,597 | 10.93% | 11,392 | 77.94% | 1,627 | 11.13% |
| 1940 | 2,206 | 15.89% | 11,672 | 84.05% | 9 | 0.06% |
| 1936 | 1,327 | 12.30% | 9,428 | 87.39% | 33 | 0.31% |
| 1932 | 1,479 | 14.20% | 8,889 | 85.36% | 45 | 0.43% |
| 1928 | 7,226 | 59.82% | 4,853 | 40.18% | 0 | 0.00% |
| 1924 | 2,189 | 25.81% | 5,831 | 68.75% | 461 | 5.44% |
| 1920 | 1,487 | 27.49% | 3,812 | 70.46% | 111 | 2.05% |
| 1916 | 347 | 13.47% | 2,108 | 81.80% | 122 | 4.73% |
| 1912 | 108 | 7.35% | 1,124 | 76.51% | 237 | 16.13% |
Communities
Cities
- Cashion Community
- Burkburnett
- Electra
- Iowa Park
- Wichita Falls (county seat)
Town
Unincorporated communities
Ghost Towns
- Clara
Education
School districts serving the county include:[21]
- Burkburnett Independent School District
- City View Independent School District
- Electra Independent School District
- Holliday Independent School District
- Iowa Park Consolidated Independent School District
- Wichita Falls Independent School District
The county is in the service area of Vernon College.[22]
See also
- List of museums in North Texas
- National Register of Historic Places listings in Wichita County, Texas
- Recorded Texas Historic Landmarks in Wichita County
- Lake Wichita
- The Kell House
References
- "Wichita County, Texas". United States Census Bureau. Retrieved January 30, 2022.
- "Find a County". National Association of Counties. Retrieved June 7, 2011.
- "Texas: Individual County Chronologies". Texas Atlas of Historical County Boundaries. The Newberry Library. 2008. Retrieved May 27, 2015.
- "2010 Census Gazetteer Files". United States Census Bureau. August 22, 2012. Retrieved May 12, 2015.
- Ripley, George; Dana, Charles A., eds. (1879). . The American Cyclopædia.
- Cope, E. D. Descriptions of extinct vertebrata from the Permian and Triassic formations of the United States. Proceedings of the American Philosophical Society, 1877. Volume 17:182–195. JSTOR. Accessed on August 28, 2017.
- Case, E.C. The Red Beds between Wichita Falls, Texas, and Las Vegas, New Mexico, in Relation to Their Vertebrate Fauna. The Journal of Geology, vol. 22, no. 3, 1914, pp. 243–259. JSTOR. Accessed on August 28, 2017.
- Henry, Randy. NRCS and Landowner Team Up With Houston Museum after Rare Species Discovery. Natural Resources Conservation Service. Accessed on August 28, 2017.
- Caulfield, Dave. Prehistoric Predators: Fossil Findings in Seymour 'Redefining'. Newschannel 6: October 25, 2015. Accessed on August 28, 2017.
- "Decennial Census of Population and Housing by Decades". US Census Bureau.
- "Texas Almanac: Population History of Counties from 1850–2010" (PDF). Texas Almanac. Archived (PDF) from the original on October 9, 2022. Retrieved May 12, 2015.
- "P2 HISPANIC OR LATINO, AND NOT HISPANIC OR LATINO BY RACE - 2020: DEC Redistricting Data (PL 94-171) - Wichita County, Texas". United States Census Bureau.
- "P2 HISPANIC OR LATINO, AND NOT HISPANIC OR LATINO BY RACE - 2010: DEC Redistricting Data (PL 94-171) - Wichita County, Texas". United States Census Bureau.
- "U.S. Census website". United States Census Bureau. Retrieved May 14, 2011.
- "Allred Unit Archived 2010-07-25 at the Wayback Machine." Texas Department of Criminal Justice. Retrieved on May 10, 2010.
- "Sheet Number 1." City of Wichita Falls. Retrieved on September 22, 2010.
- "Sheet Number 2." City of Wichita Falls. Retrieved on September 22, 2010.
- "Sheet Number 9." City of Wichita Falls. Retrieved on September 22, 2010.
- Wichita County Sheriff's Office Website
- Leip, David. "Dave Leip's Atlas of U.S. Presidential Elections". uselectionatlas.org. Retrieved August 1, 2018.
- "2020 CENSUS - SCHOOL DISTRICT REFERENCE MAP: Wichita County, TX" (PDF). U.S. Census Bureau. Archived (PDF) from the original on October 9, 2022. Retrieved June 29, 2022. - Text list
- Texas Education Code, Sec. 130.207. VERNON REGIONAL JUNIOR COLLEGE DISTRICT SERVICE AREA.
External links
- Official Wichita County Website
- Wichita County from the Handbook of Texas Online
- Historic Wichita County materials, hosted by the Portal to Texas History.
- Sheppard Air Force Base Home Page
Places adjacent to Wichita County, Texas | ||||||||||||||||
|---|---|---|---|---|---|---|---|---|---|---|---|---|---|---|---|---|
| ||||||||||||||||
Municipalities and communities of Wichita County, Texas, United States | ||
|---|---|---|
County seat: Wichita Falls | ||
| Cities |  | |
| Town | ||
| Unincorporated communities | ||
| ||
State of Texas | |
|---|---|
Austin (capital) | |
| Topics |
|
| Society |
|
| Regions |
|
| Metropolitan areas |
|
| Counties | See: List of counties in Texas |
Authority control | |
|---|---|
| General | |
| National libraries | |
| Other | |
На других языках
[de] Wichita County (Texas)
Das Wichita County[1] ist ein County im Bundesstaat Texas der Vereinigten Staaten. Der Verwaltungssitz (County Seat) ist Wichita Falls.- [en] Wichita County, Texas
[ru] Уичито (округ, Техас)
Округ Уичито (англ. Wichita County) расположен в США, штате Техас. На 2000 год численность населения составляла &&&&&&&&&0131664.&&&&&0131 664 человек. По оценке бюро переписи населения США в 2009 году население округа составляло &&&&&&&&&0127616.&&&&&0127 616 человек.[1] Окружным центром является город Уичито-Фолс.Другой контент может иметь иную лицензию. Перед использованием материалов сайта WikiSort.org внимательно изучите правила лицензирования конкретных элементов наполнения сайта.
WikiSort.org - проект по пересортировке и дополнению контента Википедии