world.wikisort.org - USA
Starr County is located in the U.S. state of Texas. As of the 2020 census, its population was 65,920.[1] Its county seat is Rio Grande City.[2] The county was created in 1848.[3] It is named for James Harper Starr, who served as Secretary of the Treasury of the Republic of Texas.
Starr County | |
|---|---|
County | |
 The Starr County Courthouse in Rio Grande City | |
 Location within the U.S. state of Texas | |
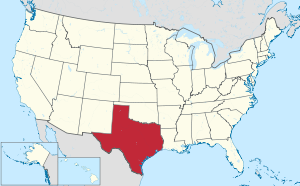 Texas's location within the U.S. | |
| Coordinates: 26°34′N 98°44′W | |
| Country | |
| State | |
| Founded | 1848 |
| Named for | James Harper Starr |
| Seat | Rio Grande City |
| Largest city | Rio Grande City |
| Government | |
| • Sheriff | Rene "Orta" Fuentes |
| Area | |
| • Total | 1,229 sq mi (3,180 km2) |
| • Land | 1,223 sq mi (3,170 km2) |
| • Water | 88.5 sq mi (229 km2) 0.5%% |
| Population (2020) | |
| • Total | 65,920 |
| • Density | 54/sq mi (21/km2) |
| Time zone | UTC−6 (Central) |
| • Summer (DST) | UTC−5 (CDT) |
| Congressional district | 28th |
| Website | www |
Starr County comprises the Rio Grande City, TX Micropolitan Statistical Area, which also includes other small cities, which itself is part of the larger Rio Grande Valley region. It is directly northeast of the Mexican border.
The county population is almost entirely Hispanic. With 97.7% of its population identifying as such, it is the county with the highest proportion of Hispanics[4] in the continental United States.
History
From 2000 to 2010, the population of Starr County increased from 53,597 to 60,968.[5]
Geography
According to the U.S. Census Bureau, the county has a total area of 1,229 square miles (3,180 km2), of which 1,223 square miles (3,170 km2) is land and 5.9 square miles (15 km2) (0.5%) is water.[6]
Major highways
 U.S. Highway 83
Adjacent counties and municipalities
- Jim Hogg County (north)
- Brooks County (northeast)
- Hidalgo County (east)
- Zapata County (northwest)
- Camargo Municipality, Tamaulipas, Mexico (south)
- Guerrero, Tamaulipas, Mexico (south)
- Gustavo Díaz Ordaz, Tamaulipas, Tamaulipas, Mexico (south)
- Mier Municipality, Tamaulipas, Mexico (south)
- Miguel Alemán Municipality, Tamaulipas, Mexico (south)
National protected area
- Lower Rio Grande Valley National Wildlife Refuge (part)
Demographics
| Historical population | |||
|---|---|---|---|
| Census | Pop. | %± | |
| 1860 | 2,406 | — | |
| 1870 | 4,154 | 72.7% | |
| 1880 | 8,304 | 99.9% | |
| 1890 | 10,749 | 29.4% | |
| 1900 | 11,469 | 6.7% | |
| 1910 | 13,151 | 14.7% | |
| 1920 | 11,089 | −15.7% | |
| 1930 | 11,409 | 2.9% | |
| 1940 | 13,312 | 16.7% | |
| 1950 | 13,948 | 4.8% | |
| 1960 | 17,137 | 22.9% | |
| 1970 | 17,707 | 3.3% | |
| 1980 | 27,266 | 54.0% | |
| 1990 | 40,518 | 48.6% | |
| 2000 | 53,597 | 32.3% | |
| 2010 | 60,968 | 13.8% | |
| 2020 | 65,920 | 8.1% | |
| U.S. Decennial Census[7] 1850–2010[8] 2010–2014[9] | |||
| Race | Pop 2010 | Pop 2020 | % 2010 | % 2020 |
|---|---|---|---|---|
| White (NH) | 2,449 | 1,171 | 4.02% | 1.78% |
| Black or African American (NH) | 15 | 31 | 0.02% | 0.05% |
| Native American or Alaska Native (NH) | 17 | 8 | 0.03% | 0.01% |
| Asian (NH) | 119 | 100 | 0.2% | 0.15% |
| Some Other Race (NH) | 5 | 98 | 0.01% | 0.15% |
| Mixed/Multi-Racial (NH) | 26 | 119 | 0.04% | 0.18% |
| Hispanic or Latino | 58,337 | 64,393 | 95.68% | 97.68% |
| Total | 60,968 | 65,920 | 100.00% | 100.00% |
As of the 2020 United States census, there were 65,920 people, 16,281 households, and 12,836 families residing in the county. As of the 2010 United States Census, there were 60,968 people living in the county. 0.4% were Non-Hispanic White, 0.2% Asian, 0.1% Native American, 0.1% Black or African American, 3.0% of some other race and 0.5% of two or more races. 95.7% were Hispanic or Latino (of any race). According to the Census Bureau, Starr County had the highest percentage of Hispanic residents of any county in the United States,[14] and the lowest percentage of non-Hispanic white residents.[15]
As of the census[16] of 2000, there were 53,597 people, 14,410 households, and 12,666 families living in the county. The population density was 44 people per square mile (17/km2). There were 17,589 housing units at an average density of 14 per square mile (6/km2). The racial makeup of the county was 87.92% White, 0.15% Black or African American, 0.25% Native American, 0.28% Asian, 0.04% Pacific Islander, 9.91% from other races, and 1.46% from two or more races.
There were 14,410 households, out of which 54.70% had children under the age of 18 living with them, 66.50% were married couples living together, 17.40% had a female householder with no husband present, and 12.10% were non-families. 11.30% of all households were made up of individuals, and 5.90% had someone living alone who was 65 years of age or older. The average household size was 3.69 and the average family size was 4.01.
In the county, the population was spread out, with 37.40% under the age of 18, 11.00% from 18 to 24, 27.10% from 25 to 44, 16.30% from 45 to 64, and 8.20% who were 65 years of age or older. The median age was 26 years. For every 100 females there were 94.20 males. For every 100 females age 18 and over, there were 88.10 males.
The median income for a household in the county was $16,504, and the median income for a family was $17,556. Males had a median income of $17,398 versus $13,533 for females. The per capita income for the county was $7,069, which is the third-lowest in the United States. About 47.40% of families and 50.90% of the population were below the poverty line, including 59.40% of those under age 18 and 43.30% of those age 65 or over.
As of 2009 the median household income was $22,418.[5]
Politics
Law enforcement
In the 1970s and into the 1980s, federal law enforcement officials concentrated their anti-drug smuggling efforts on Starr County.[17]
On May 1, 2009, the former sheriff of Starr County, Reymundo Guerra, a Democrat, pleaded guilty in federal court to a narcotics conspiracy charge.[18]
In April 2016, Starr County Justice of the Peace Salvador Zarate Jr., faced up to twenty years imprisonment and a $10,000 fine on two counts of bribery for accepting a $500 bribe in exchange for reducing bond on two persons arrested on narcotics charges in an incident on Christmas Eve 2014. He was found not guilty of possession of a controlled substance. Zarate is expected to appeal any sentence rendered.[19]
Presidential elections
Starr County has long been a strongly Democratic county but has suffered from low voter turnout with only approximately twenty percent of its 53,000 residents voting. No Republican has won the county for president since incumbent Benjamin Harrison in 1892 – as of 2020 Starr has the longest streak of voting for Democrats in the entire country. Its streak is currently almost triple the length of Minnesota's Democratic streak, which began in 1976, as of 2020.[20] In 1988, the county gave Michael Dukakis his highest vote share in the nation.[21] In 2008, Illinois Senator Barack H. Obama won Starr County with 8,233 votes (84 percent). In the most recent election, Donald Trump came within five points of winning the county, receiving 8,224 votes (47 percent) to Joe Biden's 9,099 (52 percent). This was a major shift from Hillary Clinton's 60-point margin of victory four years earlier, and represented the strongest pro-Trump swing of any county in the nation.[22][23]
| Year | Republican | Democratic | Third party | |||
|---|---|---|---|---|---|---|
| No. | % | No. | % | No. | % | |
| 2020 | 8,247 | 47.06% | 9,123 | 52.06% | 155 | 0.88% |
| 2016 | 2,224 | 18.94% | 9,289 | 79.12% | 227 | 1.93% |
| 2012 | 1,547 | 13.02% | 10,260 | 86.34% | 76 | 0.64% |
| 2008 | 1,492 | 15.24% | 8,274 | 84.50% | 26 | 0.27% |
| 2004 | 2,552 | 26.09% | 7,199 | 73.60% | 30 | 0.31% |
| 2000 | 1,911 | 22.58% | 6,505 | 76.85% | 48 | 0.57% |
| 1996 | 756 | 10.41% | 6,312 | 86.94% | 192 | 2.64% |
| 1992 | 1,209 | 13.05% | 7,668 | 82.80% | 384 | 4.15% |
| 1988 | 1,218 | 14.83% | 6,958 | 84.74% | 35 | 0.43% |
| 1984 | 1,658 | 24.70% | 5,047 | 75.18% | 8 | 0.12% |
| 1980 | 1,389 | 22.21% | 4,782 | 76.48% | 82 | 1.31% |
| 1976 | 664 | 12.47% | 4,646 | 87.25% | 15 | 0.28% |
| 1972 | 2,389 | 41.82% | 3,320 | 58.11% | 4 | 0.07% |
| 1968 | 1,374 | 25.60% | 3,922 | 73.08% | 71 | 1.32% |
| 1964 | 678 | 14.30% | 4,056 | 85.53% | 8 | 0.17% |
| 1960 | 280 | 6.46% | 4,051 | 93.49% | 2 | 0.05% |
| 1956 | 547 | 16.71% | 2,727 | 83.29% | 0 | 0.00% |
| 1952 | 620 | 16.87% | 3,055 | 83.13% | 0 | 0.00% |
| 1948 | 179 | 8.18% | 1,996 | 91.22% | 13 | 0.59% |
| 1944 | 68 | 4.87% | 1,312 | 94.05% | 15 | 1.08% |
| 1940 | 68 | 5.36% | 1,200 | 94.64% | 0 | 0.00% |
| 1936 | 320 | 12.22% | 2,289 | 87.43% | 9 | 0.34% |
| 1932 | 32 | 4.07% | 754 | 95.93% | 0 | 0.00% |
| 1928 | 79 | 9.69% | 736 | 90.31% | 0 | 0.00% |
| 1924 | 23 | 2.95% | 756 | 97.05% | 0 | 0.00% |
| 1920 | 89 | 17.55% | 418 | 82.45% | 0 | 0.00% |
| 1916 | 115 | 18.23% | 516 | 81.77% | 0 | 0.00% |
| 1912 | 252 | 27.16% | 674 | 72.63% | 2 | 0.22% |
Education
Residents of eastern Starr County are zoned to schools in the Rio Grande City Consolidated Independent School District. Residents of western Starr County are zoned to schools in the Roma Independent School District. Residents of northeastern Starr County are zoned to schools in the San Isidro Independent School District.[25]
The Roman Catholic Diocese of Brownsville operates area Catholic schools. Immaculate Conception School, located in Rio Grande City and founded in 1884, is the only Catholic school in Starr County and provides a faith-based pre-K through eighth-grade education to approximately 250 students each year.
All of the county is in the service area of South Texas College.[26]
Communities
As of 2011 Starr County has about 55 colonias. By 2011 many families were moving to the colonias.[5]
Between the 2000 and 2010 census Starr County went through many changes. Four CDPs were deleted, one gained area, twelve lost area and ninety-two new CDPs were created. Only eleven remained unchanged.[27]
Cities
- Escobares
- La Grulla
- Rio Grande City (county seat)
- Roma
Unincorporated communities
Former communities
- Viboras
Census-designated places
- Airport Heights
- Alto Bonito Heights
- Amada Acres
- Anacua
- B and E
- Barrera
- Benjamin Perez
- Buena Vista
- Camargito
- Campo Verde
- Casa Blanca
- Casas
- Chaparrito
- Chapeno
- Delmita
- East Alto Bonito
- East Lopez
- El Brazil
- El Castillo
- El Cenizo
- El Chaparral
- El Mesquite
- El Quiote
- El Rancho Vela
- El Refugio
- El Socio
- Elias-Fela Solis
- Escobar I (former)
- Eugenio Saenz
- Evergreen
- Falcon Heights
- Falcon Village
- Falconaire
- Fernando Salinas
- Flor del Rio
- Fronton
- Fronton Ranchettes
- Garceno
- Garciasville
- Garza-Salinas II
- Guadalupe-Guerra
- Gutierrez
- H. Cuellar Estates
- Hilltop
- Indio
- Jardin de San Julian
- JF Villarreal
- La Carla
- La Casita
- La Chuparosa
- La Escondida
- La Esperanza
- La Loma de Falcon
- La Minita
- La Paloma Ranchettes
- La Puerta
- La Rosita
- La Victoria
- Lago Vista
- Las Lomas
- Loma Linda East
- Loma Linda West
- Loma Vista
- Longoria
- Los Alvarez
- Los Arrieros
- Los Barreras
- Los Ebanos
- Manuel Garcia
- Manuel Garcia II
- Martinez
- Mesquite
- Mi Ranchito Estate
- Miguel Barrera
- Mikes
- Moraida
- Narciso Pena
- Netos
- Nina
- North Escobares
- Northridge
- Old Escobares (former)
- Olivia Lopez de Gutierrez
- Olmito and Olmito
- Pablo Pena
- Palo Blanco
- Pena
- Quesada
- Rafael Pena
- Ramirez-Perez
- Ramos
- Ranchitos del Norte
- Rancho Viejo
- Regino Ramirez
- Rivera (former)
- Rivereno
- Roma Creek
- Salineño
- Salineño North
- Sammy Martinez
- San Fernando
- San Isidro
- San Juan
- Sandoval
- Santa Anna
- Santa Cruz
- Santa Rosa
- Santel
- Sunset
- Tierra Dorada
- Valle Hermoso
- Valle Vista
- Victoria Vera
- Villarreal
- West Alto Bonito
- Zarate
Economy
Starr is especially known for oilseeds and dry beans, one of the highest-producing counties in the state.[28]: 431
See also
- National Register of Historic Places listings in Starr County, Texas
- Recorded Texas Historic Landmarks in Starr County
References
- "QuickFacts: Starr County, Texas". U.S. Census Bureau. Retrieved March 27, 2022.
{{cite web}}: CS1 maint: url-status (link) - "Find a County". National Association of Counties. Archived from the original on May 31, 2011. Retrieved June 7, 2011.
- "Texas: Individual County Chronologies". Texas Atlas of Historical County Boundaries. The Newberry Library. 2008. Archived from the original on May 13, 2015. Retrieved May 26, 2015.
- "P2: HISPANIC OR LATINO, AND NOT HISPANIC OR LATINO BY RACE". 2020 Census. United States Census Bureau. Retrieved October 10, 2021.
{{cite web}}: CS1 maint: url-status (link) - Grinberg, Emmanuella. "Impoverished border town grows from shacks into community Archived 2012-11-10 at the Wayback Machine." CNN. July 8, 2011. Retrieved on July 9, 2011.
- "2010 Census Gazetteer Files". United States Census Bureau. August 22, 2012. Archived from the original on April 19, 2015. Retrieved May 10, 2015.
- "Decennial Census of Population and Housing by Decade". US Census Bureau.
- "Texas Almanac: Population History of Counties from 1850–2010" (PDF). Texas Almanac. Archived (PDF) from the original on February 26, 2015. Retrieved May 10, 2015.
- "State & County QuickFacts". United States Census Bureau. Archived from the original on October 18, 2011. Retrieved December 24, 2013.
- "Explore Census Data". data.census.gov. Retrieved May 20, 2022.
- "Explore Census Data". data.census.gov. Retrieved May 20, 2022.
- https://www.census.gov/ [not specific enough to verify]
- "About the Hispanic Population and its Origin". www.census.gov. Retrieved May 18, 2022.
- Villarreal, Alexandra (July 10, 2020). "Texas border county had 'model' Covid-19 response – then the governor stepped in". The Guardian. ISSN 0261-3077. Retrieved July 10, 2020.
- Census Bureau data, cited in "Minorities now in the majority in nearly 10% of U.S. counties", Associated Press August 8, 2007, Lexington Herald-Leader p A8
- "U.S. Census website". United States Census Bureau. Retrieved May 14, 2011.
- Miller, Tom. On the Border: Portraits of America’s Southwestern Frontier, pp. 27-34.
- "通博娱乐 官网". www.poligazette.com. Archived from the original on May 26, 2009.
- Aaron Nelsen, "Star County JP faces jail for bribery", San Antonio Express-News, April 16, 2016, p. A7
- "Presidential election of 1892 - Map by counties". geoelections.free.fr. Archived from the original on March 7, 2006.
- "David Leip's Presidential Atlas (1988 election statistics)". uselectionatlas.org. Archived from the original on November 26, 2008.
- "Texas Election Night Results". Texas Election Results. Texas Secretary of State. Retrieved November 7, 2020.
- "President Donald J. Trump nearly wins Starr County". KRGV.com. Mobile Video Tapes, Inc. Retrieved November 7, 2020.
- Leip, David. "Dave Leip's Atlas of U.S. Presidential Elections". uselectionatlas.org. Archived from the original on March 23, 2018.
- "2020 CENSUS - SCHOOL DISTRICT REFERENCE MAP: Starr County, TX" (PDF). U.S. Census Bureau. Archived (PDF) from the original on October 9, 2022. Retrieved June 29, 2022. - list
- Texas Education Code, Sec. 130.199. SOUTH TEXAS COMMUNITY COLLEGE DISTRICT SERVICE AREA..
- "Population and Housing Unit Counts, 2010 Census of Population and Housing" (PDF). Texas: 2010. Archived (PDF) from the original on February 13, 2017.
- "2017 Census - Volume 1, Chapter 1: State Level Data". United States Department of Agriculture National Agricultural Statistics Service (USDA NASS). 2017. Retrieved July 29, 2022.
External links
- Starr County Government
- Starr County in Handbook of Texas Online at the University of Texas
- Starr County Profile from the Texas Association of Counties
Places adjacent to Starr County, Texas | ||||||||||||||||
|---|---|---|---|---|---|---|---|---|---|---|---|---|---|---|---|---|
| ||||||||||||||||

State of Texas | |
|---|---|
Austin (capital) | |
| Topics |
|
| Society |
|
| Regions |
|
| Metropolitan areas |
|
| Counties | See: List of counties in Texas |
Authority control | |
|---|---|
| General | |
| National libraries | |
| Other | |
На других языках
[de] Starr County
Das Starr County[1] ist ein County im Bundesstaat Texas der Vereinigten Staaten. Der Verwaltungssitz (County Seat) ist Rio Grande City.- [en] Starr County, Texas
[ru] Старр (округ)
Округ Старр (англ. Starr) — округ штата Техас Соединённых Штатов Америки. На 2000 год в нем проживало &&&&&&&&&&053597.&&&&&053 597 человек. По оценке бюро переписи населения США в 2009 году население округа составляло &&&&&&&&&&062671.&&&&&062 671 человек.[2] Окружным центром является город Рио-Гранде-Сити.Другой контент может иметь иную лицензию. Перед использованием материалов сайта WikiSort.org внимательно изучите правила лицензирования конкретных элементов наполнения сайта.
WikiSort.org - проект по пересортировке и дополнению контента Википедии