world.wikisort.org - Canada
Sainte-Catherine is an off-island suburb of Montreal, in southwestern Quebec, Canada, on the St. Lawrence River in the Regional County Municipality of Roussillon. The population as of the Canada 2011 Census was 16,762.
This article may be expanded with text translated from the corresponding article in French. (February 2009) Click [show] for important translation instructions.
|
Sainte-Catherine | |
|---|---|
City | |
 Saint Lawrence Seaway at Sainte-Catherine | |
 Location within Roussillon RCM | |
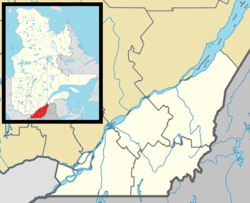 Sainte-Catherine Location in southern Quebec | |
| Coordinates: 45.40402°N 73.5704°W[1] | |
| Country | |
| Province | |
| Region | Montérégie |
| RCM | Roussillon |
| Constituted | October 30, 1937 |
| Government | |
| • Mayor | Jocelyne Bates |
| • Federal riding | La Prairie |
| • Prov. riding | Sanguinet |
| Area | |
| • Total | 16.00 km2 (6.18 sq mi) |
| • Land | 9.50 km2 (3.67 sq mi) |
| Population (2011)[4] | |
| • Total | 16,762 |
| • Density | 1,764.1/km2 (4,569/sq mi) |
| • Pop 2006–2011 | |
| • Dwellings | 6,652 |
| Time zone | UTC−5 (EST) |
| • Summer (DST) | UTC−4 (EDT) |
| Postal code(s) | J5C |
| Area code(s) | 450 and 579 |
| Highways | |
| Website | www |
History
The land had been occupied for more than three centuries, since the establishment of the Iroquois mission in 1676, it is only in 1937 that the founding of la paroisse de Sainte-Catherine de Laprairie really marks a territorial organization. In 1973, a demographic boom finally granted the status of town to the village. In 2006, according to the city's official site, there were 17,000 inhabitants in Sainte-Catherine.
The inauguration of the Honoré Mercier Bridge in 1934, and then of the Champlain Bridge in 1962, greatly boosted the local economy.
Demographics
| Year | Pop. | ±% |
|---|---|---|
| 1991 | 9,805 | — |
| 1996 | 13,724 | +40.0% |
| 2001 | 15,953 | +16.2% |
| 2006 | 16,211 | +1.6% |
| 2011 | 16,762 | +3.4% |
In the 2021 Census of Population conducted by Statistics Canada, Sainte-Catherine had a population of 17,347 living in 6,909 of its 7,016 total private dwellings, a change of 1.8% from its 2016 population of 17,047. With a land area of 9.37 km2 (3.62 sq mi), it had a population density of 1,851.3/km2 (4,794.9/sq mi) in 2021.[6]
| 2021 | 2011 | |
|---|---|---|
| Population | 17,347 (+1.8% from 2016) | 16,762 (+3.4% from 2006) |
| Land area | 9.37 km2 (3.62 sq mi) | 9.50 km2 (3.67 sq mi) |
| Population density | 1,851.4/km2 (4,795/sq mi) | 1,764.1/km2 (4,569/sq mi) |
| Median age | 43.6 (M: 42, F: 45.2) | 39.3 (M: 38.1, F: 40.4) |
| Total private dwellings | 6,905 | 6,652 |
| Median household income | $68,634 |
| Canada Census Mother Tongue – Sainte-Catherine, Quebec[5] | ||||||||||||||||||
|---|---|---|---|---|---|---|---|---|---|---|---|---|---|---|---|---|---|---|
| Census | Total | French |
English |
French & English |
Other | |||||||||||||
| Year | Responses | Count | Trend | Pop % | Count | Trend | Pop % | Count | Trend | Pop % | Count | Trend | Pop % | |||||
2016 |
16,980 |
14,950 | 88.04% | 630 | 3.71% | 155 | 0.91% | 1,100 | 6.47% | |||||||||
2011 |
16,670 |
15,040 | 90.22% | 675 | 4.05% | 140 | 0.84% | 815 | 4.89% | |||||||||
2006 |
16,005 |
14,915 | 93.19% | 485 | 3.03% | 100 | 0.62% | 505 | 3.16% | |||||||||
2001 |
15,945 |
14,705 | 92.22% | 680 | 4.26% | 105 | 0.66% | 455 | 2.85% | |||||||||
1996 |
13,710 |
12,895 | n/a | 94.06% | 480 | n/a | 3.50% | 105 | n/a | 0.76% | 230 | n/a | 1.68% | |||||
Famous natives
- Guillaume Latendresse, NHL player
- Pierre Carl Ouellet, professional wrestler
- Karine Sergerie, women's taekwondo champion, Olympian
See also
- Saint-Regis River
- List of cities in Quebec
References
- "Reference number 56073 in Banque de noms de lieux du Québec". toponymie.gouv.qc.ca (in French). Commission de toponymie du Québec.
- Ministère des Affaires municipales, des Régions et de l'Occupation du territoire: Sainte-Catherine
- Riding history for Châteauguay–Saint-Constant, Quebec from the Library of Parliament
- "2011 Community Profiles". 2011 Canadian Census. Statistics Canada. March 21, 2019. Retrieved 2014-02-22.
- Statistics Canada: 1996, 2001, 2006, 2011, 2016census
- "Population and dwelling counts: Canada, provinces and territories, and census subdivisions (municipalities), Quebec". Statistics Canada. February 9, 2022. Retrieved August 29, 2022.
- "2021 Community Profiles". 2021 Canadian Census. Statistics Canada. February 4, 2022. Retrieved 2022-04-27.
- "2006 Community Profiles". 2006 Canadian Census. Statistics Canada. August 20, 2019.
- "2001 Community Profiles". 2001 Canadian Census. Statistics Canada. July 18, 2021.
Adjacent Municipal Subdivisions | ||||||||||||||||
|---|---|---|---|---|---|---|---|---|---|---|---|---|---|---|---|---|
| ||||||||||||||||
| Cities | |
|---|---|
| Municipalities | |
| Parishes |
|
| |
На других языках
[de] Sainte-Catherine (Québec)
Sainte-Catherine ist eine Stadt im Südwesten der kanadischen Provinz Québec. Sie liegt in der Verwaltungsregion Montérégie, etwa 15 km südlich des Zentrums von Montreal. Sainte-Catherine gehört zur regionalen Grafschaftsgemeinde (municipalité régionale du comté) Roussillon, hat eine Fläche von 9,42 km² und zählt 17.047 Einwohner (Stand: 2016).- [en] Sainte-Catherine, Quebec
Другой контент может иметь иную лицензию. Перед использованием материалов сайта WikiSort.org внимательно изучите правила лицензирования конкретных элементов наполнения сайта.
WikiSort.org - проект по пересортировке и дополнению контента Википедии