world.wikisort.org - USA
Seward County (standard abbreviation: SW) is a county of the U.S. state of Kansas. As of the 2020 census, the county population was 21,964.[1] The largest city and county seat is Liberal.[2] The county was formed on March 20, 1873 and named after William Henry Seward, an American politician and Secretary of State under Abraham Lincoln and Andrew Johnson.
Seward County | |
|---|---|
County | |
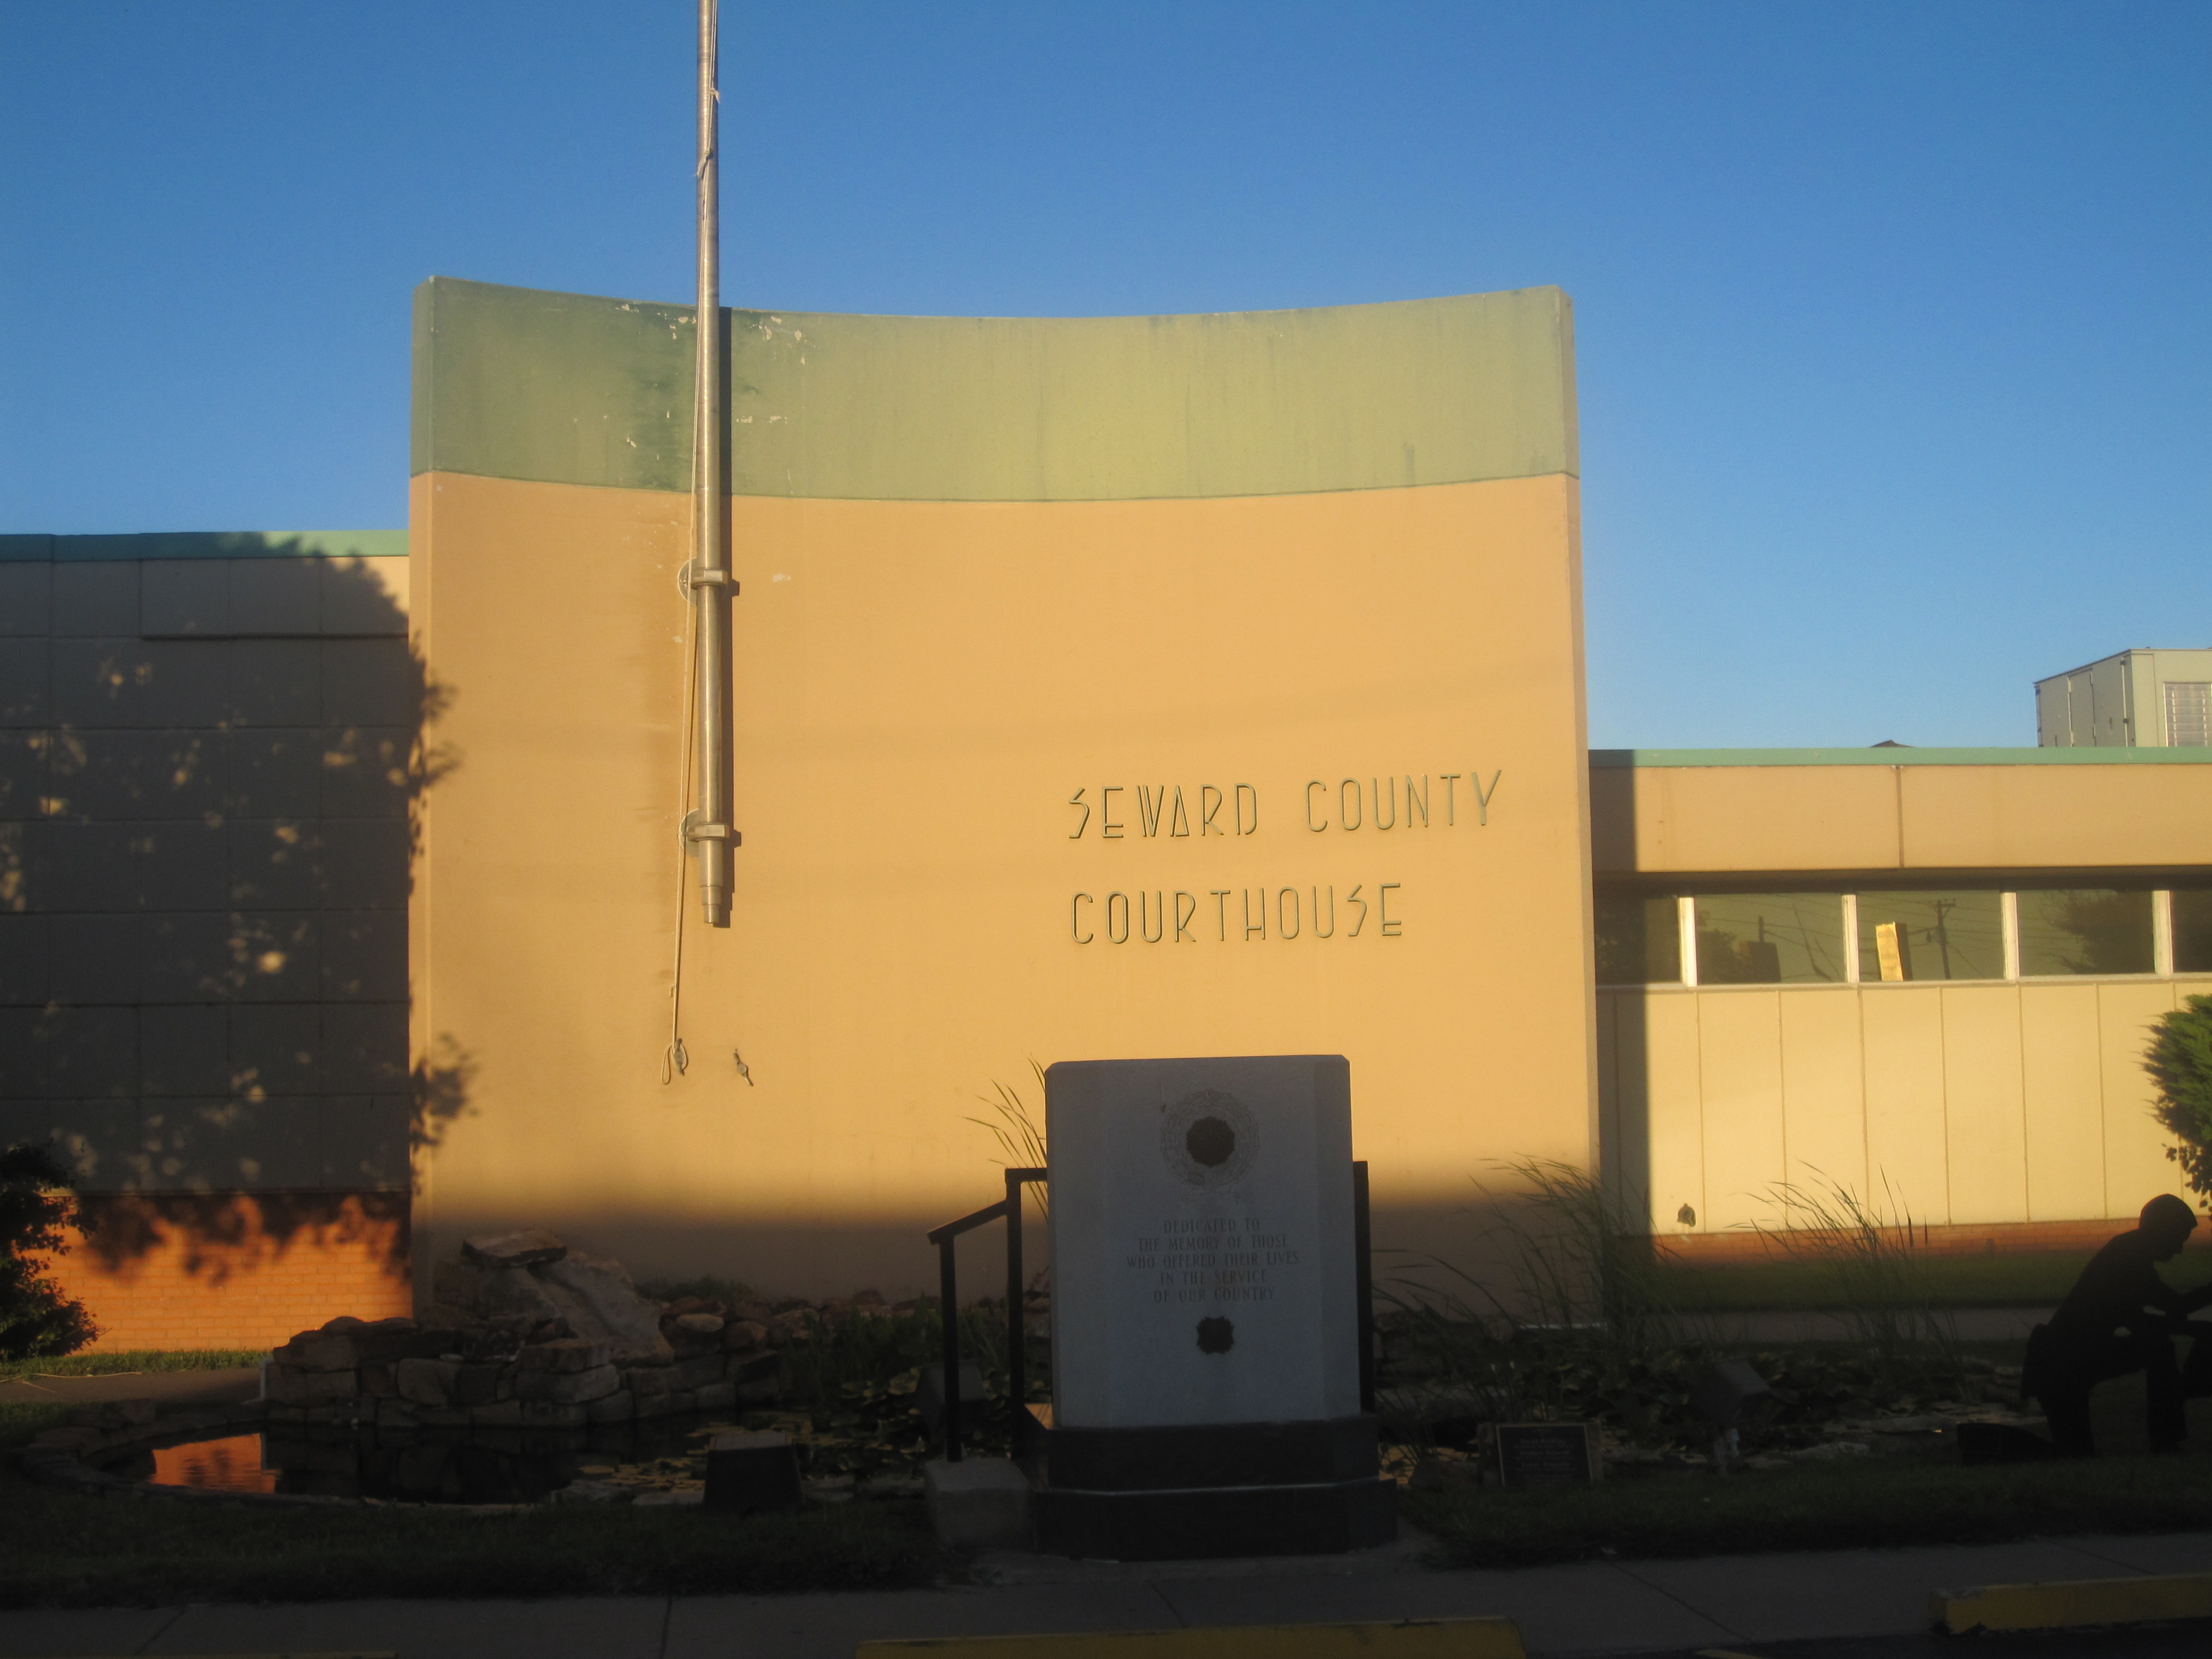 Seward County Courthouse in Liberal (2010) | |
 Location within the U.S. state of Kansas | |
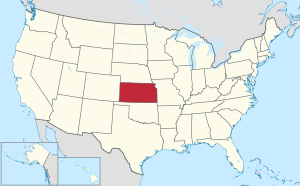 Kansas's location within the U.S. | |
| Coordinates: 37°12′N 100°50′W | |
| Country | |
| State | |
| Founded | March 20, 1873 |
| Named for | William H. Seward |
| Seat | Liberal |
| Largest city | Liberal |
| Area | |
| • Total | 640 sq mi (1,700 km2) |
| • Land | 639 sq mi (1,660 km2) |
| • Water | 1.0 sq mi (3 km2) 0.2% |
| Population (2020)[1] | |
| • Total | 21,964 |
| • Density | 34.4/sq mi (13.3/km2) |
| Time zone | UTC−6 (Central) |
| • Summer (DST) | UTC−5 (CDT) |
| Area code | 620 |
| Congressional district | 1st |
| Website | SewardCountyKS.org |
Geography
According to the U.S. Census Bureau, the county has a total area of 640 square miles (1,700 km2), of which 639 square miles (1,660 km2) is land and 1.0 square mile (2.6 km2) (0.2%) is water.[3] It borders Oklahoma to the south.
Adjacent counties
- Haskell County (north)
- Meade County (east)
- Beaver County, Oklahoma (southeast)
- Texas County, Oklahoma (southwest)
- Stevens County (west)
Demographics
| Historical population | |||
|---|---|---|---|
| Census | Pop. | %± | |
| 1880 | 5 | — | |
| 1890 | 1,503 | 29,960.0% | |
| 1900 | 822 | −45.3% | |
| 1910 | 4,091 | 397.7% | |
| 1920 | 6,220 | 52.0% | |
| 1930 | 8,075 | 29.8% | |
| 1940 | 6,540 | −19.0% | |
| 1950 | 9,972 | 52.5% | |
| 1960 | 15,930 | 59.7% | |
| 1970 | 15,744 | −1.2% | |
| 1980 | 17,071 | 8.4% | |
| 1990 | 18,743 | 9.8% | |
| 2000 | 22,510 | 20.1% | |
| 2010 | 22,952 | 2.0% | |
| 2020 | 21,964 | −4.3% | |
| U.S. Decennial Census[4] 1790-1960[5] 1900-1990[6] 1990-2000[7] 2010-2020[1] | |||

The Liberal, KS Micropolitan Statistical Area includes all of Seward County.
As of the census[8] of 2000, there were 22,510 people, 7,419 households, and 5,504 families residing in the county. The population density was 35 people per square mile (14/km2). There were 8,027 housing units at an average density of 13 per square mile (5/km2). The racial makeup of the county was 65.44% White, 3.78% Black or African American, 0.77% Native American, 2.86% Asian, 0.06% Pacific Islander, 23.81% from other races, and 3.27% from two or more races. 42.14% of the population were Hispanic or Latino of any race.
There were 7,419 households, out of which 43.50% had children under the age of 18 living with them, 59.60% were married couples living together, 10.00% had a female householder with no husband present, and 25.80% were non-families. 20.60% of all households were made up of individuals, and 7.80% had someone living alone who was 65 years of age or older. The average household size was 2.98 and the average family size was 3.46.
In the county, the population was spread out, with 32.00% under the age of 18, 11.70% from 18 to 24, 30.50% from 25 to 44, 16.90% from 45 to 64, and 8.90% who were 65 years of age or older. The median age was 29 years. For every 100 females, there were 105.30 males. For every 100 females age 18 and over, there were 103.70 males.
The median income for a household in the county was $36,752, and the median income for a family was $41,134. Males had a median income of $29,765 versus $21,889 for females. The per capita income for the county was $15,059. About 13.90% of families and 16.90% of the population were below the poverty line, including 21.00% of those under age 18 and 7.30% of those age 65 or over.
Government
Presidential elections
| Year | Republican | Democratic | Third party | |||
|---|---|---|---|---|---|---|
| No. | % | No. | % | No. | % | |
| 2020 | 3,372 | 63.69% | 1,833 | 34.62% | 89 | 1.68% |
| 2016 | 3,159 | 62.70% | 1,628 | 32.31% | 251 | 4.98% |
| 2012 | 3,617 | 69.88% | 1,490 | 28.79% | 69 | 1.33% |
| 2008 | 3,791 | 71.05% | 1,493 | 27.98% | 52 | 0.97% |
| 2004 | 4,272 | 78.54% | 1,122 | 20.63% | 45 | 0.83% |
| 2000 | 3,869 | 75.92% | 1,126 | 22.10% | 101 | 1.98% |
| 1996 | 3,812 | 68.40% | 1,309 | 23.49% | 452 | 8.11% |
| 1992 | 3,477 | 51.09% | 1,488 | 21.86% | 1,841 | 27.05% |
| 1988 | 4,089 | 70.54% | 1,655 | 28.55% | 53 | 0.91% |
| 1984 | 5,222 | 80.54% | 1,198 | 18.48% | 64 | 0.99% |
| 1980 | 4,385 | 70.83% | 1,460 | 23.58% | 346 | 5.59% |
| 1976 | 3,604 | 64.19% | 1,907 | 33.96% | 104 | 1.85% |
| 1972 | 3,866 | 77.27% | 989 | 19.77% | 148 | 2.96% |
| 1968 | 3,065 | 62.32% | 1,291 | 26.25% | 562 | 11.43% |
| 1964 | 2,910 | 53.28% | 2,520 | 46.14% | 32 | 0.59% |
| 1960 | 3,974 | 70.44% | 1,654 | 29.32% | 14 | 0.25% |
| 1956 | 2,885 | 70.95% | 1,162 | 28.58% | 19 | 0.47% |
| 1952 | 3,136 | 72.79% | 1,146 | 26.60% | 26 | 0.60% |
| 1948 | 1,829 | 52.00% | 1,614 | 45.89% | 74 | 2.10% |
| 1944 | 1,590 | 53.92% | 1,342 | 45.51% | 17 | 0.58% |
| 1940 | 1,503 | 49.65% | 1,474 | 48.70% | 50 | 1.65% |
| 1936 | 1,108 | 35.64% | 1,997 | 64.23% | 4 | 0.13% |
| 1932 | 1,297 | 43.64% | 1,576 | 53.03% | 99 | 3.33% |
| 1928 | 1,873 | 76.98% | 538 | 22.11% | 22 | 0.90% |
| 1924 | 1,184 | 52.00% | 676 | 29.69% | 417 | 18.31% |
| 1920 | 1,290 | 61.52% | 722 | 34.43% | 85 | 4.05% |
| 1916 | 678 | 34.52% | 1,105 | 56.26% | 181 | 9.22% |
| 1912 | 155 | 14.98% | 394 | 38.07% | 486 | 46.96% |
| 1908 | 427 | 48.09% | 413 | 46.51% | 48 | 5.41% |
| 1904 | 152 | 65.52% | 62 | 26.72% | 18 | 7.76% |
| 1900 | 122 | 60.40% | 77 | 38.12% | 3 | 1.49% |
| 1896 | 100 | 55.87% | 78 | 43.58% | 1 | 0.56% |
| 1892 | 156 | 57.14% | 0 | 0.00% | 117 | 42.86% |
| 1888 | 400 | 61.16% | 207 | 31.65% | 47 | 7.19% |
Seward County has voted Republican since 1940.[10] The last time Seward County voted for a Democratic candidate for President was when it favored incumbent Democrat Franklin D. Roosevelt in 1936 over Kansas Governor Alf Landon.[11] In the Kansas Senate it is currently represented by Republican Garrett Love. In the Kansas House of Representatives it is represented by Republicans Bill Light and Carl Holmes.[12]
In 2016, Hillary Clinton became the first Democrat to break 30% in Seward County since Jimmy Carter in 1976.
Laws
Following amendment to the Kansas Constitution in 1986, the county remained a prohibition, or "dry", county until 1996, when voters approved the sale of alcoholic liquor by the individual drink with a 30% food sales requirement.[13]
Education
Unified school districts
Communities

Cities
Unincorporated communities
- Hayne
Townships
Seward County is divided into three townships. The city of Liberal is considered governmentally independent and is excluded from the census figures for the townships. In the following table, the population center is the largest city (or cities) included in that township's population total, if it is of a significant size.
| Township | FIPS | Population center |
Population | Population density /km2 (/sq mi) |
Land area km2 (sq mi) | Water area km2 (sq mi) | Water % | Geographic coordinates |
|---|---|---|---|---|---|---|---|---|
| Fargo | 23000 | 1,684 | 3 (8) | 570 (220) | 2 (1) | 0.29% | 37°9′1″N 100°45′3″W | |
| Liberal | 39850 | 803 | 2 (4) | 502 (194) | 0 (0) | 0.03% | 37°5′52″N 100°56′58″W | |
| Seward | 64075 | 357 | 1 (2) | 556 (215) | 0 (0) | 0.06% | 37°18′55″N 100°50′34″W |
See also
|
|
References
- "QuickFacts; Seward County, Kansas; Population, Census, 2020 & 2010". United States Census Bureau. Archived from the original on August 19, 2021. Retrieved August 19, 2021.
- "Find a County". National Association of Counties. Retrieved June 7, 2011.
- "US Gazetteer files: 2010, 2000, and 1990". United States Census Bureau. February 12, 2011. Retrieved April 23, 2011.
- "U.S. Decennial Census". United States Census Bureau. Retrieved July 29, 2014.
- "Historical Census Browser". University of Virginia Library. Retrieved July 29, 2014.
- "Population of Counties by Decennial Census: 1900 to 1990". United States Census Bureau. Retrieved July 29, 2014.
- "Census 2000 PHC-T-4. Ranking Tables for Counties: 1990 and 2000" (PDF). United States Census Bureau. Retrieved July 29, 2014.
- "U.S. Census website". United States Census Bureau. Retrieved January 31, 2008.
- "Dave Leip's Atlas of U.S. Presidential Elections".
- David Leip's Atlas of US Elections
- Geographie Electorale
- Institute for Policy and Social Research Archived 2010-06-16 at the Wayback Machine
- "Map of Wet and Dry Counties". Alcoholic Beverage Control, Kansas Department of Revenue. November 2006. Archived from the original on October 8, 2007. Retrieved December 26, 2007.
- Notes
Further reading
External links
- County
- Seward County - Official Website
- Seward County - Directory of Public Officials
- Seward County Historical Society
- Historical railroad trestle - "Samson of the Cimarron"
- Samson of the Cimarron, kansastravel.org
- Mighty Samson Bridge nears 73rd birthday Archived 2016-04-20 at the Wayback Machine, leaderandtimes.com
- Sampson of the Cimarron history, rits.org
- Maps
- Seward County Maps: Current, Historic, KDOT
- Kansas Highway Maps: Current, Historic, KDOT
- Kansas Railroad Maps: Current, 1996, 1915, KDOT and Kansas Historical Society
Places adjacent to Seward County, Kansas | ||||||||||||||||
|---|---|---|---|---|---|---|---|---|---|---|---|---|---|---|---|---|
| ||||||||||||||||
Municipalities and communities of Seward County, Kansas, United States | ||
|---|---|---|
County seat: Liberal | ||
| Cities |  | |
| Unincorporated community |
| |
| Ghost towns | ||
| ||
State of Kansas | |
|---|---|
Topeka (capital) | |
| Topics |
|
| Society |
|
| Regions |
|
| Largest cities |
|
| Counties |
|
| Lists |
|
Authority control | |
|---|---|
| General | |
| National libraries | |
На других языках
[de] Seward County (Kansas)
Seward County[1] ist ein County im Bundesstaat Kansas der Vereinigten Staaten. Der Verwaltungssitz (County Seat) ist Liberal.- [en] Seward County, Kansas
[es] Condado de Seward (Kansas)
El condado de Seward (en inglés: Seward County), fundado en 1873, es uno de 105 condados del estado estadounidense de Kansas. En el año 2005, el condado tenía una población de 176,255 habitantes y una densidad poblacional de 124 personas por km². La sede del condado es Liberal.[1] El condado recibe su nombre en honor a William Henry Seward.[ru] Сьюард (округ, Канзас)
Сью́ард[1] (англ. Seward County; стандартное обозначение SW) — округ в штате Канзас, США. Официально образован 20-го марта 1873 года. По состоянию на 2010 год, численность населения составляла 22 952 человека.Другой контент может иметь иную лицензию. Перед использованием материалов сайта WikiSort.org внимательно изучите правила лицензирования конкретных элементов наполнения сайта.
WikiSort.org - проект по пересортировке и дополнению контента Википедии