world.wikisort.org - USA
Lee County is a county located in the U.S. state of Georgia. As of the 2010 census, the population was 28,298.[1] Its county seat is Leesburg.[2]
Lee County | |
|---|---|
U.S. county | |
 Lee County courthouse in Leesburg | |
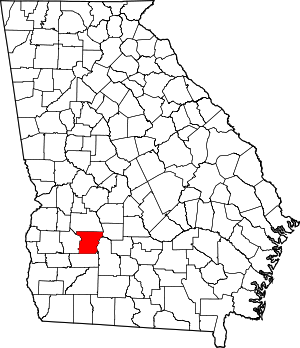 Location within the U.S. state of Georgia | |
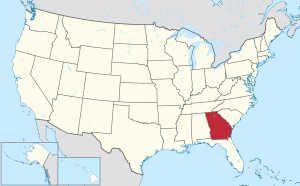 Georgia's location within the U.S. | |
| Coordinates: 31°47′N 84°08′W | |
| Country | |
| State | |
| Founded | June 9, 1825 |
| Named for | Henry Lee III |
| Seat | Leesburg |
| Largest city | Leesburg |
| Area | |
| • Total | 362 sq mi (940 km2) |
| • Land | 356 sq mi (920 km2) |
| • Water | 5.9 sq mi (15 km2) 1.6%% |
| Population (2020) | |
| • Total | 33,163 |
| • Density | 80/sq mi (30/km2) |
| Time zone | UTC−5 (Eastern) |
| • Summer (DST) | UTC−4 (EDT) |
| Congressional district | 2nd |
| Website | www |
Lee County is included in the Albany, GA Metropolitan Statistical Area.
History
The land for Lee, Muscogee, Troup, Coweta, and Carroll counties was ceded by the Creek people in the 1825 Treaty of Indian Springs. The counties' boundaries were created by the Georgia General Assembly on June 9, but they were not named until December 14, 1826.[3] The county was named in honor of Henry Lee III, popularly known as "Light-Horse Harry," the father of Confederate general Robert E. Lee.[4]
On January 29, 1916, five African-American men were lynched; they were taken from the Worth county jail and hung, their bodies riddled with bullets.[5]
The Leesburg Stockade occurred in Lee County.
Geography
According to the U.S. Census Bureau, the county has a total area of 362 square miles (940 km2), of which 356 square miles (920 km2) is land and 5.9 square miles (15 km2) (1.6%) is water.[6]
Most of the western three-quarters of Lee County is located in the Kinchafoonee-Muckalee sub-basin of the ACF River Basin (Apalachicola-Chattahoochee-Flint River Basin). The eastern quarter of the county is located in the Middle Flint River sub-basin of the same ACF River Basin, while a very small corner in the south of Lee County is located in the Lower Flint River sub-basin of the same larger ACF River Basin. An even smaller southwestern corner is located in the Ichawaynochaway Creek sub-basin of the ACF River Basin.[7]
Major highways
 U.S. Route 19
 U.S. Route 19 Bypass
 U.S. Route 82
 State Route 3
 State Route 3 Bypass
 State Route 32
 State Route 91
 State Route 118
 State Route 133
 State Route 195
 State Route 377
 State Route 520
Adjacent counties
- Sumter County (north)
- Crisp County (northeast)
- Worth County (east)
- Dougherty County (south)
- Terrell County (west)
Demographics
| Historical population | |||
|---|---|---|---|
| Census | Pop. | %± | |
| 1830 | 1,680 | — | |
| 1840 | 4,520 | 169.0% | |
| 1850 | 6,660 | 47.3% | |
| 1860 | 7,196 | 8.0% | |
| 1870 | 9,567 | 32.9% | |
| 1880 | 10,577 | 10.6% | |
| 1890 | 9,074 | −14.2% | |
| 1900 | 10,344 | 14.0% | |
| 1910 | 11,679 | 12.9% | |
| 1920 | 10,904 | −6.6% | |
| 1930 | 8,328 | −23.6% | |
| 1940 | 7,837 | −5.9% | |
| 1950 | 6,674 | −14.8% | |
| 1960 | 6,204 | −7.0% | |
| 1970 | 7,044 | 13.5% | |
| 1980 | 11,684 | 65.9% | |
| 1990 | 16,250 | 39.1% | |
| 2000 | 24,757 | 52.4% | |
| 2010 | 28,298 | 14.3% | |
| 2020 | 33,163 | 17.2% | |
| U.S. Decennial Census[8] 1790-1960[9] 1900-1990[10] 1990-2000[11] 2010-2013[1] | |||
2000 census
As of the census[12] of 2000, there were 24,757 people, 8,229 households, and 6,797 families living in the county. The population density was 70 inhabitants per square mile (27/km2). There were 8,813 housing units at an average density of 25 per square mile (10/km2). The racial makeup of the county was 82.24% White, 15.50% Black or African American, 0.24% Native American, 0.84% Asian, 0.01% Pacific Islander, 0.48% from other races, and 0.68% from two or more races. 1.21% of the population were Hispanic or Latino of any race.
There were 8,229 households, out of which 48.30% had children under the age of 18 living with them, 65.80% were married couples living together, 13.00% had a female householder with no husband present, and 17.40% were non-families. 14.30% of all households were made up of individuals, and 4.30% had someone living alone who was 65 years of age or older. The average household size was 2.91 and the average family size was 3.21.
In the county, the population was spread out, with 30.70% under the age of 18, 8.50% from 18 to 24, 33.20% from 25 to 44, 21.30% from 45 to 64, and 6.30% who were 65 years of age or older. The median age was 33 years. For every 100 females, there were 102.10 males. For every 100 females age 18 and over, there were 100.20 males.
The median income for a household in the county was $48,600, and the median income for a family was $53,132. Males had a median income of $39,848 versus $25,715 for females. The per capita income for the county was $19,897. About 6.50% of families and 8.20% of the population were below the poverty line, including 10.50% of those under age 18 and 11.70% of those aged 65 or over.
2010 census
As of the 2010 United States Census, there were 28,298 people, 9,706 households, and 7,740 families living in the county.[13] The population density was 79.5 inhabitants per square mile (30.7/km2). There were 10,276 housing units at an average density of 28.9 per square mile (11.2/km2).[14] The racial makeup of the county was 76.9% white, 18.6% black or African American, 2.2% Asian, 0.3% American Indian, 0.1% Pacific islander, 0.6% from other races, and 1.4% from two or more races. Those of Hispanic or Latino origin made up 2.0% of the population.[13] In terms of ancestry, 15.1% were American, 12.3% were Irish, 10.3% were German, and 9.1% were English.[15]
Of the 9,706 households, 44.4% had children under the age of 18 living with them, 62.1% were married couples living together, 13.6% had a female householder with no husband present, 20.3% were non-families, and 16.4% of all households were made up of individuals. The average household size was 2.83 and the average family size was 3.17. The median age was 36.0 years.[13]
The median income for a household in the county was $59,811 and the median income for a family was $67,943. Males had a median income of $49,213 versus $34,880 for females. The per capita income for the county was $23,867. About 7.5% of families and 8.2% of the population were below the poverty line, including 9.2% of those under age 18 and 8.2% of those age 65 or over.[16]
2020 census
| Race | Num. | Perc. |
|---|---|---|
| White (non-Hispanic) | 22,758 | 68.62% |
| Black or African American (non-Hispanic) | 7,331 | 22.11% |
| Native American | 57 | 0.17% |
| Asian | 850 | 2.56% |
| Pacific Islander | 9 | 0.03% |
| Other/Mixed | 1,205 | 3.63% |
| Hispanic or Latino | 953 | 2.87% |
As of the 2020 United States census, there were 33,163 people, 10,226 households, and 7,872 families residing in the county.
Education

Public schools are operated by the Lee County School District. Lee County High School is the sole high school of the district.
Politics
Historically, Lee County was part of the solidly Democratic Solid South[18] where control of the dominant black population dictated unified white voting for Democratic candidates due to the Republican association with Reconstruction and black political power. However, with a combination of the Great Migration and white in-migration, the black share of the county's population has declined and it is now powerfully Republican, having voted Republican in every presidential election since 1964, with the exception of 1968 and 1976 when it backed Southern “favorite sons” George Wallace and Jimmy Carter.
| Year | Republican | Democratic | Third party | |||
|---|---|---|---|---|---|---|
| No. | % | No. | % | No. | % | |
| 2020 | 12,007 | 71.82% | 4,558 | 27.26% | 154 | 0.92% |
| 2016 | 10,646 | 75.27% | 3,170 | 22.41% | 327 | 2.31% |
| 2012 | 10,314 | 75.58% | 3,196 | 23.42% | 136 | 1.00% |
| 2008 | 9,925 | 75.69% | 3,100 | 23.64% | 87 | 0.66% |
| 2004 | 8,201 | 78.64% | 2,182 | 20.92% | 45 | 0.43% |
| 2000 | 5,872 | 74.48% | 1,936 | 24.56% | 76 | 0.96% |
| 1996 | 3,983 | 61.15% | 2,005 | 30.78% | 525 | 8.06% |
| 1992 | 3,061 | 51.81% | 1,811 | 30.65% | 1,036 | 17.54% |
| 1988 | 2,875 | 74.04% | 995 | 25.62% | 13 | 0.33% |
| 1984 | 2,972 | 69.83% | 1,284 | 30.17% | 0 | 0.00% |
| 1980 | 1,942 | 53.05% | 1,670 | 45.62% | 49 | 1.34% |
| 1976 | 1,110 | 39.13% | 1,727 | 60.87% | 0 | 0.00% |
| 1972 | 1,441 | 78.70% | 390 | 21.30% | 0 | 0.00% |
| 1968 | 389 | 17.18% | 674 | 29.77% | 1,201 | 53.05% |
| 1964 | 1,041 | 81.01% | 244 | 18.99% | 0 | 0.00% |
| 1960 | 191 | 32.10% | 404 | 67.90% | 0 | 0.00% |
| 1956 | 79 | 12.93% | 532 | 87.07% | 0 | 0.00% |
| 1952 | 205 | 34.45% | 390 | 65.55% | 0 | 0.00% |
| 1948 | 36 | 7.69% | 215 | 45.94% | 217 | 46.37% |
| 1944 | 27 | 5.70% | 447 | 94.30% | 0 | 0.00% |
| 1940 | 17 | 3.91% | 416 | 95.63% | 2 | 0.46% |
| 1936 | 1 | 0.20% | 490 | 99.59% | 1 | 0.20% |
| 1932 | 6 | 2.33% | 252 | 97.67% | 0 | 0.00% |
| 1928 | 45 | 13.55% | 287 | 86.45% | 0 | 0.00% |
| 1924 | 23 | 9.39% | 211 | 86.12% | 11 | 4.49% |
| 1920 | 19 | 7.04% | 251 | 92.96% | 0 | 0.00% |
| 1916 | 4 | 1.24% | 316 | 97.83% | 3 | 0.93% |
| 1912 | 5 | 2.22% | 213 | 94.67% | 7 | 3.11% |
Communities
- Leesburg (county seat)
- Smithville
See also
- National Register of Historic Places listings in Lee County, Georgia
References
- "State & County QuickFacts". United States Census Bureau. Archived from the original on June 7, 2011. Retrieved June 23, 2014.
- "Find a County". National Association of Counties. Retrieved June 7, 2011.
- Hellmann, Paul T. (May 13, 2013). Historical Gazetteer of the United States. Routledge. p. 236. ISBN 978-1135948597. Retrieved November 30, 2013.
- Gannett, Henry (1905). The Origin of Certain Place Names in the United States. U.S. Government Printing Office. p. 184.
- "Coroner Probes Lynching in Lee". Atlanta Constitution. January 22, 1916. p. 9.
- "US Gazetteer files: 2010, 2000, and 1990". United States Census Bureau. February 12, 2011. Retrieved April 23, 2011.
- "Georgia Soil and Water Conservation Commission Interactive Mapping Experience". Georgia Soil and Water Conservation Commission. Retrieved November 24, 2015.
- "U.S. Decennial Census". United States Census Bureau. Retrieved June 23, 2014.
- "Historical Census Browser". University of Virginia Library. Retrieved June 23, 2014.
- "Population of Counties by Decennial Census: 1900 to 1990". United States Census Bureau. Retrieved June 23, 2014.
- "Census 2000 PHC-T-4. Ranking Tables for Counties: 1990 and 2000" (PDF). United States Census Bureau. Archived (PDF) from the original on March 27, 2010. Retrieved June 23, 2014.
- "U.S. Census website". United States Census Bureau. Retrieved May 14, 2011.
- "DP-1 Profile of General Population and Housing Characteristics: 2010 Demographic Profile Data". United States Census Bureau. Archived from the original on February 13, 2020. Retrieved December 30, 2015.
- "Population, Housing Units, Area, and Density: 2010 - County". United States Census Bureau. Archived from the original on February 13, 2020. Retrieved December 30, 2015.
- "DP02 SELECTED SOCIAL CHARACTERISTICS IN THE UNITED STATES – 2006-2010 American Community Survey 5-Year Estimates". United States Census Bureau. Archived from the original on February 13, 2020. Retrieved December 30, 2015.
- "DP03 SELECTED ECONOMIC CHARACTERISTICS – 2006-2010 American Community Survey 5-Year Estimates". United States Census Bureau. Archived from the original on February 13, 2020. Retrieved December 30, 2015.
- "Explore Census Data". data.census.gov. Retrieved December 18, 2021.
- Phillips, Kevin P.; The Emerging Republican Majority, p. 267 ISBN 9780691163246
- Leip, David. "Dave Leip's Atlas of U.S. Presidential Elections". uselectionatlas.org. Retrieved March 15, 2018.
External links
Places adjacent to Lee County, Georgia | ||||||||||||||||
|---|---|---|---|---|---|---|---|---|---|---|---|---|---|---|---|---|
| ||||||||||||||||
Municipalities and communities of Lee County, Georgia, United States | ||
|---|---|---|
County seat: Leesburg | ||
| Cities | 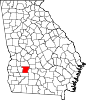 | |
| Unincorporated communities |
| |
| Ghost towns |
| |
| ||
Authority control | |
|---|---|
| General | |
| National libraries | |
| Other | |
На других языках
[de] Lee County (Georgia)
Das Lee County[1] ist ein County im US-Bundesstaat Georgia der Vereinigten Staaten. Der Verwaltungssitz (County Seat) ist Leesburg.- [en] Lee County, Georgia
[fr] Comté de Lee (Géorgie)
Le comté de Lee est un comté de Géorgie, aux États-Unis.[it] Contea di Lee (Georgia)
La contea di Lee (in inglese Lee County) è una contea dello Stato della Georgia, negli Stati Uniti. La popolazione al censimento del 2000 era di 24 757 abitanti. Il capoluogo di contea è Leesburg.[ru] Ли (округ, Джорджия)
Ли[1] (англ. Lee County) — округ штата Джорджия, США. Население округа на 2000 год составляло 24757 человек. Административный центр округа — город Лисберг.Другой контент может иметь иную лицензию. Перед использованием материалов сайта WikiSort.org внимательно изучите правила лицензирования конкретных элементов наполнения сайта.
WikiSort.org - проект по пересортировке и дополнению контента Википедии