world.wikisort.org - USA
Charlton County is the southernmost county of the U.S. state of Georgia, located in the southeastern part of the state. As of the 2010 census, the population was 12,171.[2] The county seat is Folkston.[3]
Charlton County | |
|---|---|
U.S. county | |
 Charlton County Courthouse in Folkston | |
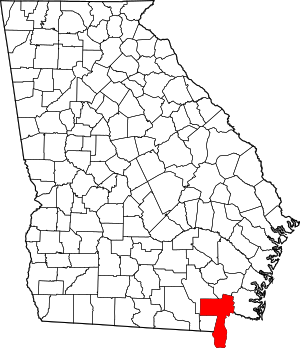 Location within the U.S. state of Georgia | |
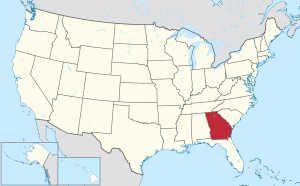 Georgia's location within the U.S. | |
| Coordinates: 30°47′N 82°08′W | |
| Country | |
| State | |
| Founded | 1854 |
| Named for | Robert M. Charlton |
| Seat | Folkston |
| Largest city | Folkston |
| Area | |
| • Total | 782 sq mi (2,030 km2) |
| • Land | 774 sq mi (2,000 km2) |
| • Water | 8.8 sq mi (23 km2) 1.1%% |
| Population | |
| • Estimate (2019) | 13,392[1] |
| • Density | 16.4/sq mi (6.3/km2) |
| Time zone | UTC−5 (Eastern) |
| • Summer (DST) | UTC−4 (EDT) |
| Congressional district | 1st |
| Website | https://www.charltoncountyga.us/ |
History
Georgia, by an act of the Georgia General Assembly on February 18, 1854.[4] The original county seat was at Trader's Hill, until 1901. Additional lands from Ware County, Georgia, were added to Charlton's borders by an 1855 act of the General Assembly. In 1856, an additional legislative act redefined the Charlton–Camden borders again with each county ceding land to the other.[5]
The county is named for Robert Milledge Charlton, a U. S. Senator from Georgia.[6]
Geography
According to the U.S. Census Bureau, the county has a total area of 782 square miles (2,030 km2), of which 774 square miles (2,000 km2) is land and 8.8 square miles (23 km2) (1.1%) is water.[7] It is the fifth-largest county by area in Georgia. It is the southernmost county in Georgia. A large portion of the county lies within the Okefenokee Swamp and its federally protected areas.
The entire central and southern portion of Charlton County is located in the St. Marys sub-basin of the St. Marys-Satilla basin. The county's northeastern portion, north of Homeland, is located in the Satilla River sub-basin of the St. Marys-Satilla basin. The western portion of Charlton County is located in the Upper Suwannee River sub-basin of the larger Suwannee River basin.[8] The country's southern region is level with the northern most part of the central and eastern Panhandle of the Florida peninsula.
Major highways
 U.S. Route 1
 U.S. Route 23
 U.S. Route 301
 State Route 4
 State Route 15
 State Route 23
 State Route 40
 State Route 40 Connector
 State Route 94
 State Route 121
 State Route 177
 State Route 185
 State Route 252
Adjacent counties
- Brantley County - northeast
- Nassau County, Florida - east
- Camden County - east
- Baker County, Florida - south
- Ware County - northwest
National protected area
- Okefenokee National Wildlife Refuge (part)
Demographics
| Historical population | |||
|---|---|---|---|
| Census | Pop. | %± | |
| 1860 | 1,780 | — | |
| 1870 | 1,897 | 6.6% | |
| 1880 | 2,154 | 13.5% | |
| 1890 | 3,335 | 54.8% | |
| 1900 | 3,592 | 7.7% | |
| 1910 | 4,722 | 31.5% | |
| 1920 | 4,536 | −3.9% | |
| 1930 | 4,381 | −3.4% | |
| 1940 | 5,256 | 20.0% | |
| 1950 | 4,821 | −8.3% | |
| 1960 | 5,313 | 10.2% | |
| 1970 | 5,680 | 6.9% | |
| 1980 | 7,343 | 29.3% | |
| 1990 | 8,496 | 15.7% | |
| 2000 | 10,282 | 21.0% | |
| 2010 | 12,171 | 18.4% | |
| 2020 | 12,518 | 2.9% | |
| U.S. Decennial Census[9] 1790-1960[10] 1900-1990[11] 1990-2000[12] 2010-2019[2] | |||
2000 census
As of the census[13] of 2000, there were 10,282 people, 3,342 households, and 2,499 families living in the county. The population density was 13 people per square mile (5/km2). There were 3,859 housing units at an average density of 5 per square mile (2/km2). The racial makeup of the county was 68.59% White, 29.26% Black or African American, 0.42% Native American, 0.34% Asian, 0.06% Pacific Islander, 0.14% from other races, and 1.21% from two or more races. 0.79% of the population were Hispanic or Latino of any race.
There were 3,342 households, out of which 37.60% had children under the age of 18 living with them, 55.40% were married couples living together, 15.00% had a female householder with no husband present, and 25.20% were non-families. 21.80% of all households were made up of individuals, and 8.50% had someone living alone who was 65 years of age or older. The average household size was 2.74 and the average family size was 3.20.
In the county, the population was spread out, with 27.50% under the age of 18, 10.60% from 18 to 24, 31.70% from 25 to 44, 20.60% from 45 to 64, and 9.70% who were 65 years of age or older. The median age was 33 years. For every 100 females there were 112.40 males. For every 100 females age 18 and over, there were 115.60 males.
The median income for a household in the county was $27,869, and the median income for a family was $33,364. Males had a median income of $26,631 versus $17,978 for females. The per capita income for the county was $12,920. About 17.80% of families and 20.90% of the population were below the poverty line, including 29.10% of those under age 18 and 20.40% of those age 65 or over.
2010 census
As of the 2010 United States Census, there were 12,171 people, 3,927 households, and 2,866 families living in the county.[14] The population density was 15.7 inhabitants per square mile (6.1/km2). There were 4,475 housing units at an average density of 5.8 per square mile (2.2/km2).[15] The racial makeup of the county was 68.6% white, 28.5% black or African American, 0.6% Asian, 0.4% American Indian, 0.3% from other races, and 1.6% from two or more races. Those of Hispanic or Latino origin made up 2.5% of the population.[14] In terms of ancestry, 7.9% were American, 7.3% were English, and 6.2% were Irish.[16]
Of the 3,927 households, 35.3% had children under the age of 18 living with them, 52.5% were married couples living together, 15.2% had a female householder with no husband present, 27.0% were non-families, and 23.1% of all households were made up of individuals. The average household size was 2.64 and the average family size was 3.10. The median age was 38.2 years.[14]
The median income for a household in the county was $40,850 and the median income for a family was $45,913. Males had a median income of $36,675 versus $25,140 for females. The per capita income for the county was $16,652. About 18.1% of families and 19.8% of the population were below the poverty line, including 23.4% of those under age 18 and 12.8% of those age 65 or over.[17]
2020 census
| Race | Num. | Perc. |
|---|---|---|
| White (non-Hispanic) | 7,532 | 60.17% |
| Black or African American (non-Hispanic) | 2,386 | 19.06% |
| Native American | 40 | 0.32% |
| Asian | 109 | 0.87% |
| Pacific Islander | 2 | 0.02% |
| Other/Mixed | 413 | 3.3% |
| Hispanic or Latino | 2,036 | 16.26% |
As of the 2020 United States census, there were 12,518 people, 3,675 households, and 2,685 families residing in the county.
Communities
Education
Politics
| Year | Republican | Democratic | Third party | |||
|---|---|---|---|---|---|---|
| No. | % | No. | % | No. | % | |
| 2020 | 3,419 | 74.85% | 1,105 | 24.19% | 44 | 0.96% |
| 2016 | 2,951 | 73.48% | 1,004 | 25.00% | 61 | 1.52% |
| 2012 | 2,527 | 67.12% | 1,197 | 31.79% | 41 | 1.09% |
| 2008 | 2,466 | 66.70% | 1,197 | 32.38% | 34 | 0.92% |
| 2004 | 2,311 | 68.15% | 1,064 | 31.38% | 16 | 0.47% |
| 2000 | 1,770 | 62.86% | 1,015 | 36.04% | 31 | 1.10% |
| 1996 | 1,374 | 45.33% | 1,368 | 45.13% | 289 | 9.53% |
| 1992 | 1,333 | 46.09% | 1,127 | 38.97% | 432 | 14.94% |
| 1988 | 1,327 | 57.60% | 943 | 40.93% | 34 | 1.48% |
| 1984 | 1,368 | 55.18% | 1,111 | 44.82% | 0 | 0.00% |
| 1980 | 779 | 34.08% | 1,469 | 64.26% | 38 | 1.66% |
| 1976 | 452 | 20.53% | 1,750 | 79.47% | 0 | 0.00% |
| 1972 | 1,244 | 80.05% | 310 | 19.95% | 0 | 0.00% |
| 1968 | 332 | 17.08% | 455 | 23.41% | 1,157 | 59.52% |
| 1964 | 1,179 | 67.26% | 574 | 32.74% | 0 | 0.00% |
| 1960 | 289 | 28.28% | 733 | 71.72% | 0 | 0.00% |
| 1956 | 204 | 21.38% | 750 | 78.62% | 0 | 0.00% |
| 1952 | 288 | 26.11% | 815 | 73.89% | 0 | 0.00% |
| 1948 | 70 | 12.32% | 339 | 59.68% | 159 | 27.99% |
| 1944 | 89 | 16.15% | 462 | 83.85% | 0 | 0.00% |
| 1940 | 60 | 9.65% | 562 | 90.35% | 0 | 0.00% |
| 1936 | 28 | 5.63% | 468 | 94.16% | 1 | 0.20% |
| 1932 | 32 | 8.82% | 330 | 90.91% | 1 | 0.28% |
| 1928 | 160 | 27.83% | 415 | 72.17% | 0 | 0.00% |
| 1924 | 20 | 11.24% | 151 | 84.83% | 7 | 3.93% |
| 1920 | 28 | 15.14% | 157 | 84.86% | 0 | 0.00% |
| 1916 | 11 | 4.74% | 169 | 72.84% | 52 | 22.41% |
| 1912 | 49 | 22.17% | 150 | 67.87% | 22 | 9.95% |
See also
- National Register of Historic Places listings in Charlton County, Georgia
References
- "U.S. Census Bureau QuickFacts: Charlton County, Georgia". Census Bureau QuickFacts.
- "State & County QuickFacts". United States Census Bureau. Archived from the original on September 5, 2015. Retrieved June 19, 2014.
- "Find a County". National Association of Counties. Archived from the original on May 31, 2011. Retrieved June 7, 2011.
- Krakow, Kenneth K. (1975). Georgia Place-Names: Their History and Origins (PDF). Macon, GA: Winship Press. p. 39. ISBN 0-915430-00-2.
- "Charlton County". New Georgia Encyclopedia.
- "Charlton County". Georgia.gov. Archived from the original on June 14, 2012. Retrieved March 19, 2018.
- "US Gazetteer files: 2010, 2000, and 1990". United States Census Bureau. February 12, 2011. Retrieved April 23, 2011.
- "Georgia Soil and Water Conservation Commission Interactive Mapping Experience". Georgia Soil and Water Conservation Commission. Retrieved November 27, 2015.
- "U.S. Decennial Census". United States Census Bureau. Retrieved June 17, 2014.
- "Historical Census Browser". University of Virginia Library. Retrieved June 19, 2014.
- "Population of Counties by Decennial Census: 1900 to 1990". United States Census Bureau. Retrieved June 19, 2014.
- "Census 2000 PHC-T-4. Ranking Tables for Counties: 1990 and 2000" (PDF). United States Census Bureau. Retrieved June 19, 2014.
- "U.S. Census website". United States Census Bureau. Retrieved May 14, 2011.
- "DP-1 Profile of General Population and Housing Characteristics: 2010 Demographic Profile Data". United States Census Bureau. Archived from the original on February 13, 2020. Retrieved December 27, 2015.
- "Population, Housing Units, Area, and Density: 2010 - County". United States Census Bureau. Archived from the original on February 13, 2020. Retrieved December 27, 2015.
- "DP02 SELECTED SOCIAL CHARACTERISTICS IN THE UNITED STATES – 2006-2010 American Community Survey 5-Year Estimates". United States Census Bureau. Archived from the original on February 13, 2020. Retrieved December 27, 2015.
- "DP03 SELECTED ECONOMIC CHARACTERISTICS – 2006-2010 American Community Survey 5-Year Estimates". United States Census Bureau. Archived from the original on February 13, 2020. Retrieved December 27, 2015.
- "Explore Census Data". data.census.gov. Retrieved December 18, 2021.
- Leip, David. "Dave Leip's Atlas of U.S. Presidential Elections". uselectionatlas.org. Retrieved March 19, 2018.
External links
![]() Media related to Charlton County, Georgia at Wikimedia Commons
Media related to Charlton County, Georgia at Wikimedia Commons
- Okefenokee National Wildlife Refuge U.S. Fish and Wildlife Service
- Charlton County historical marker
- Sardis Church historical marker
Places adjacent to Charlton County, Georgia | ||||||||||||||||
|---|---|---|---|---|---|---|---|---|---|---|---|---|---|---|---|---|
| ||||||||||||||||
Municipalities and communities of Charlton County, Georgia, United States | ||
|---|---|---|
County seat: Folkston | ||
| Cities |  | |
| Unincorporated communities |
| |
| Ghost towns |
| |
| ||
Authority control | |
|---|---|
| General | |
| National libraries | |
| Other | |
На других языках
[de] Charlton County
Das Charlton County[1] befindet sich im Bundesstaat Georgia der Vereinigten Staaten. Der Verwaltungssitz (County Seat) ist Folkston, das viele Jahre die selbsternannte Hauptstadt der Hochzeiten gewesen war. Viele Heiratswillige fuhren durch das ganze Land, um hier zu heiraten, da es keine Wartezeiten nach dem Aufgebot gab.- [en] Charlton County, Georgia
[ru] Чарлтон (округ)
Ча́рлтон[1] (англ. Charlton County) — округ штата Джорджия, США. Население округа на 2000 год составляло 10282 человек. Административный центр округа — город Фолкстон.Другой контент может иметь иную лицензию. Перед использованием материалов сайта WikiSort.org внимательно изучите правила лицензирования конкретных элементов наполнения сайта.
WikiSort.org - проект по пересортировке и дополнению контента Википедии