world.wikisort.org - USA
Harrison County is a county located in the U.S. state of Mississippi. As of the 2020 census, the population was 208,621,[3] making it the second-most populous county in Mississippi. Its county seats are Biloxi and Gulfport.[4] The county is named after U.S. President William Henry Harrison.[5]
Harrison County | |
|---|---|
U.S. county | |
 Harrison County Courthouse (constructed in 1903, destroyed by fire in 1970s)[2] | |
 Seal | |
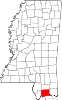
 Location within the U.S. state of Mississippi | |
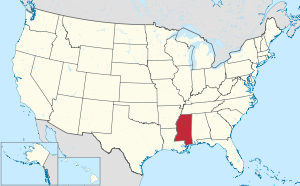 Mississippi's location within the U.S. | |
| Coordinates: 30°25′N 89°05′W | |
| Country | |
| State | |
| Founded | 1841 |
| Named for | William Henry Harrison |
| Seat | Biloxi and Gulfport |
| Largest city | Gulfport |
| Area | |
| • Total | 976 sq mi (2,530 km2) |
| • Land | 574 sq mi (1,490 km2) |
| • Water | 402 sq mi (1,040 km2) 41% |
| Population (2020) | |
| • Total | 208,621 |
| • Estimate (2021) | 209,396 |
| • Density | 362/sq mi (140/km2) |
| Time zone | UTC−6 (Central) |
| • Summer (DST) | UTC−5 (CDT) |
| Congressional district | 4th |
| Website | harrisoncountyms |
Harrison County is part of the Gulfport-Biloxi, MS Metropolitan Statistical Area.
The county was severely damaged from both Hurricane Camille on August 17, 1969, and Hurricane Katrina on August 29, 2005, causing catastrophic effects.
Geography
According to the United States Census Bureau, the county has a total area of 976 square miles (2,530 km2), of which 574 square miles (1,490 km2) is land and 402 square miles (1,040 km2) (41%) is water.[6] The Tchoutacabouffa River has its mouth at Biloxi Bay just north of the city of Biloxi. Gulfport, Mississippi is the chief port in the state, with access to the Gulf of Mexico through a ship channel. This is the second-largest county in Mississippi by total area.
Wildlife
A single pond in the county contains the critically endangered dusky gopher frog.[7]
Major highways
 Interstate 10
 Interstate 110
 U.S. Highway 49
 U.S. Highway 90
 Mississippi Highway 15
 Mississippi Highway 53
 Mississippi Highway 67
 Mississippi Highway 605
 Mississippi Highway 43
Adjacent counties and parishes
- Stone County (north)
- Jackson County (east)
- Hancock County (west)
- St. Bernard Parish, Louisiana (southwest)
National protected areas
- De Soto National Forest (part)
- Gulf Islands National Seashore (part)
Demographics
| Historical population | |||
|---|---|---|---|
| Census | Pop. | %± | |
| 1850 | 4,875 | — | |
| 1860 | 4,819 | −1.1% | |
| 1870 | 5,795 | 20.3% | |
| 1880 | 7,895 | 36.2% | |
| 1890 | 12,481 | 58.1% | |
| 1900 | 21,002 | 68.3% | |
| 1910 | 34,658 | 65.0% | |
| 1920 | 32,855 | −5.2% | |
| 1930 | 44,143 | 34.4% | |
| 1940 | 50,799 | 15.1% | |
| 1950 | 84,073 | 65.5% | |
| 1960 | 119,489 | 42.1% | |
| 1970 | 134,582 | 12.6% | |
| 1980 | 157,665 | 17.2% | |
| 1990 | 165,365 | 4.9% | |
| 2000 | 189,601 | 14.7% | |
| 2010 | 187,105 | −1.3% | |
| 2020 | 208,621 | 11.5% | |
| 2021 (est.) | 209,396 | [8] | 0.4% |
| U.S. Decennial Census[9] 1790-1960[10] 1900-1990[11] 1990-2000[12] 2010-2020[3] | |||
2020 census
| Race | Number | Percent |
|---|---|---|
| White (non-Hispanic) | 125,092 | 59.96% |
| Black or African American (non-Hispanic) | 51,143 | 24.51% |
| Native American | 786 | 0.38% |
| Asian | 5,913 | 2.83% |
| Pacific Islander | 257 | 0.12% |
| Other/Mixed | 11,454 | 5.49% |
| Hispanic or Latino | 13,976 | 6.7% |
As of the 2020 United States census, there were 208,621 people, 74,628 households, and 50,074 families residing in the county.
2000 census
As of the census of 2000, there were 187,479 people, 71,538 households, and 48,574 families residing in the county. The population density was 326 people per square mile (126/km2). There were 79,636 housing units at an average density of 137 per square mile (53/km2). The racial makeup of the county was 73.15% White, 21.09% Black or African American, 0.45% Native American, 2.60% Asian, 0.09% Pacific Islander, 0.90% from other races, and 1.72% from two or more races. 2.59% of the population were Hispanic or Latino of any race.
There were 71,538 households, out of which 33.50% had children under the age of 18 living with them, 48.10% were married couples living together, 15.10% had a female householder with no husband present, and 32.10% were non-families. 25.80% of all households were made up of individuals, and 8.30% had someone living alone who was 65 years of age or older. The average household size was 2.55 and the average family size was 3.07.
In the county, the population was spread out, with 26.00% under the age of 18, 11.10% from 18 to 24, 30.50% from 25 to 44, 21.20% from 45 to 64, and 11.10% who were 65 years of age or older. The median age was 34 years. For every 100 females, there were 99.10 males. For every 100 females age 18 and over, there were 97.50 males.
The main income for a household in the county was $35,624, and the median income for a family was $41,445. Males had a median income of $29,867 versus $22,030 for females. The per capita income for the county was $18,024. 14.60% of the population and 11.60% of families were below the poverty line. Out of the total population, 20.70% of those under the age of 18 and 11.30% of those 65 and older were living below the poverty line.
Harrison County has the sixth highest per capita income in the State of Mississippi.
Corrections system
Harrison County has been studied by CNN and other media, which have reported on the beatings of inmates in the Harrison County Jail in Gulfport, Mississippi. Inmate Jessie Lee Williams Jr. died while in custody on February 4, 2006.[14] In 2006 and 2007, six Harrison County Sheriff's Department deputies pleaded guilty to crimes related to the abuse of inmates at the jail.[15] Sheriff Melvin Brisolara-R was elected in 2008, for Harrison County.
Communities

Cities
- Biloxi (county seat)
- D'Iberville
- Gulfport (county seat)
- Long Beach
- Pass Christian
Census-designated places
Unincorporated communities
Politics
Since 1964, Harrison County has voted overwhelmingly Republican. The last Democrat to receive over 40% of the vote was Jimmy Carter in 1976.
| Year | Republican | Democratic | Third party | |||
|---|---|---|---|---|---|---|
| No. | % | No. | % | No. | % | |
| 2020 | 46,822 | 61.70% | 27,728 | 36.54% | 1,335 | 1.76% |
| 2016 | 40,354 | 63.74% | 21,169 | 33.44% | 1,790 | 2.83% |
| 2012 | 39,470 | 62.33% | 23,119 | 36.51% | 739 | 1.17% |
| 2008 | 38,757 | 62.55% | 22,673 | 36.59% | 527 | 0.85% |
| 2004 | 39,703 | 62.73% | 23,076 | 36.46% | 509 | 0.80% |
| 2000 | 32,256 | 61.30% | 19,142 | 36.38% | 1,218 | 2.31% |
| 1996 | 25,486 | 52.84% | 18,775 | 38.92% | 3,974 | 8.24% |
| 1992 | 25,049 | 52.84% | 15,268 | 32.21% | 7,090 | 14.96% |
| 1988 | 32,892 | 68.88% | 14,439 | 30.24% | 423 | 0.89% |
| 1984 | 33,995 | 72.83% | 12,495 | 26.77% | 187 | 0.40% |
| 1980 | 25,175 | 58.70% | 16,318 | 38.05% | 1,395 | 3.25% |
| 1976 | 19,207 | 51.72% | 16,569 | 44.61% | 1,363 | 3.67% |
| 1972 | 28,962 | 84.02% | 4,761 | 13.81% | 747 | 2.17% |
| 1968 | 6,542 | 22.37% | 4,549 | 15.55% | 18,157 | 62.08% |
| 1964 | 16,301 | 75.14% | 5,393 | 24.86% | 0 | 0.00% |
| 1960 | 5,177 | 30.89% | 8,961 | 53.47% | 2,621 | 15.64% |
| 1956 | 5,742 | 44.17% | 6,549 | 50.37% | 710 | 5.46% |
| 1952 | 5,960 | 45.35% | 7,181 | 54.65% | 0 | 0.00% |
| 1948 | 415 | 5.56% | 692 | 9.28% | 6,351 | 85.16% |
| 1944 | 622 | 9.43% | 5,976 | 90.57% | 0 | 0.00% |
| 1940 | 633 | 10.19% | 5,577 | 89.75% | 4 | 0.06% |
| 1936 | 495 | 10.44% | 4,208 | 88.78% | 37 | 0.78% |
| 1932 | 449 | 9.72% | 4,124 | 89.28% | 46 | 1.00% |
| 1928 | 1,485 | 28.57% | 3,712 | 71.43% | 0 | 0.00% |
| 1924 | 523 | 13.99% | 3,044 | 81.41% | 172 | 4.60% |
| 1920 | 314 | 19.29% | 1,270 | 78.01% | 44 | 2.70% |
| 1916 | 197 | 11.96% | 1,395 | 84.70% | 55 | 3.34% |
| 1912 | 45 | 2.82% | 1,292 | 80.95% | 259 | 16.23% |
Education
School districts include:[17]
- Biloxi Public School District
- Gulfport School District
- Harrison County School District
- Long Beach School District
- Pass Christian Public School District
See also
- Friendship Oak (Long Beach, Mississippi)
- Grass Lawn (Gulfport, Mississippi)
- Harrison Experimental Forest
- Historic Grand Hotels on the Mississippi Gulf Coast
- Land Trust for the Mississippi Coastal Plain
- Mississippi Aquarium
- National Register of Historic Places listings in Harrison County, Mississippi
- Old Brick House (Biloxi, Mississippi)
- Tivoli Hotel (Biloxi, Mississippi)
- Turkey Creek Community Historic District
References
- Shaw, Betty Hancock. 2011. Gulfport: Images of America, Arcadia Publishing: Charleston, SC (page 28).
- Shaw, Betty Hancock. 2011. Gulfport: Images of America, Arcadia Publishing: Charleston, SC (page 28).
- "State & County QuickFacts". United States Census Bureau. Retrieved September 4, 2022.
- "Find a County". National Association of Counties. Retrieved June 7, 2011.
- Gannett, Henry (1905). The Origin of Certain Place Names in the United States. Govt. Print. Off. pp. 150.
- "2010 Census Gazetteer Files". United States Census Bureau. August 22, 2012. Archived from the original on September 28, 2013. Retrieved November 4, 2014.
- Dusky gopher frog
- "Annual Estimates of the Resident Population for Counties: April 1, 2020 to July 1, 2021". Retrieved September 4, 2022.
- "U.S. Decennial Census". United States Census Bureau. Retrieved November 4, 2014.
- "Historical Census Browser". University of Virginia Library. Retrieved November 4, 2014.
- "Population of Counties by Decennial Census: 1900 to 1990". United States Census Bureau. Retrieved November 4, 2014.
- "Census 2000 PHC-T-4. Ranking Tables for Counties: 1990 and 2000" (PDF). United States Census Bureau. Retrieved November 4, 2014.
- "Explore Census Data". data.census.gov. Retrieved December 16, 2021.
- "CNN.com - Anderson Cooper 360° Blog". www.cnn.com. Retrieved March 2, 2018.
- "Sixth Harrison County Sheriff's Department Officer Pleads Guilty"
- Leip, David. "Dave Leip's Atlas of U.S. Presidential Elections". uselectionatlas.org. Retrieved October 18, 2017.
- "2020 CENSUS - SCHOOL DISTRICT REFERENCE MAP: Harrison County, MS" (PDF). United States Census Bureau. Retrieved July 31, 2022. - Text list
Further reading
- Burt, D.E. and H.L. Welch. (2007). Quality of water in selected wells, Harrison County, Mississippi, 1997-2005 [U.S. Geological Survey Open-File Report 2007-1287]. Reston, VA: U.S. Department of the Interior, U.S. Geological Survey.
External links
Places adjacent to Harrison County, Mississippi | ||||||||||||||||
|---|---|---|---|---|---|---|---|---|---|---|---|---|---|---|---|---|
| ||||||||||||||||
Municipalities and communities of Harrison County, Mississippi, United States | ||
|---|---|---|
| Cities |
|  |
| CDPs | ||
| Unincorporated communities | ||
| ||
Authority control | |
|---|---|
| General | |
| National libraries | |
| Other | |
На других языках
[de] Harrison County (Mississippi)
Das Harrison County[1] ist ein County im US-Bundesstaat Mississippi. Die Verwaltungssitze (County Seats) sind Gulfport, das nach seiner Lage am Golf von Mexiko benannt wurde, und Biloxi. Es gehört zu den zehn Countys in Mississippi, die zwei County-Verwaltungen haben.- [en] Harrison County, Mississippi
[ru] Гаррисон (округ, Миссисипи)
Округ Гаррисон (англ. Harrison County) — округ штата Миссисипи, США. Население округа на 2000 год составляло 189 601 человек. В округе 2 административных центра — города Галфпорт и Билокси.Другой контент может иметь иную лицензию. Перед использованием материалов сайта WikiSort.org внимательно изучите правила лицензирования конкретных элементов наполнения сайта.
WikiSort.org - проект по пересортировке и дополнению контента Википедии