world.wikisort.org - USA
Newton County is a county located in the U.S. state of Mississippi. As of the 2010 census, the population was 21,720.[1] Its county seat is Decatur.[2]
Newton County | |
|---|---|
U.S. county | |
 Alabama and Vicksburg Railroad Depot | |
 Location within the U.S. state of Mississippi | |
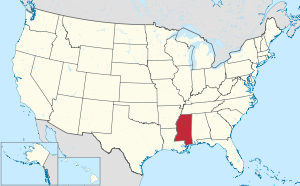 Mississippi's location within the U.S. | |
| Coordinates: 32°25′N 89°07′W | |
| Country | |
| State | |
| Founded | 1836 |
| Seat | Decatur |
| Largest city | Newton |
| Area | |
| • Total | 580 sq mi (1,500 km2) |
| • Land | 578 sq mi (1,500 km2) |
| • Water | 1.5 sq mi (4 km2) 0.3% |
| Population (2010) | |
| • Total | 21,720 |
| • Estimate (2018) | 21,443 |
| • Density | 37/sq mi (14/km2) |
| Time zone | UTC−6 (Central) |
| • Summer (DST) | UTC−5 (CDT) |
| Congressional district | 3rd |
| Website | www |
History
Newton County was formed in 1836 and named after scientist Isaac Newton.[3]
The Battle of Newton's Station was fought in the county on April 24, 1863, during Grierson's Raid of the American Civil War.[citation needed]
In February 1864, General William Tecumseh Sherman crossed the county, burning the county seat at Decatur and was nearly captured during the Meridian Campaign. Sherman stopped during the return trip from Meridian and slept in the town of Union.[citation needed]
On October 10, 1908, a mob of white people brutally shot, tortured, and lynched Frank Johnson, Dee Dawkins, and William Fielder near Hickory, Mississippi.
On October 8, a Black sharecropper named Shep Jones had a disagreement about his work schedule with his white employer. The white planter assaulted Mr. Jones, leading to an altercation that ended with the white man's death. Mr. Jones fled Newton County, aware that Black people were not believed to have a right to defend themselves against white people and that he was at risk of being lynched.
For the next two days, an angry white mob terrorized the entire Black community in a manhunt for Mr. Jones. The mob destroyed property owned by Black people, burned a Black church and meeting lodge near Gardlandville, and threatened Black families.
On October 9, the mob hanged Mr. Jones's father-in-law, William Fielder, from a tree near his home. The next morning, unable to locate Mr. Jones but refusing to be denied a lynching, the mob lynched Dee Dawkins and Frank Johnson, two Black men who were targeted merely for being associated with Mr. Jones.
Many Black people were so traumatized by the violence that they fled Newton County. White elected officials and law enforcement failed to hold anyone accountable for the destruction of Black property or the lynchings.[4]
Geography
According to the U.S. Census Bureau, the county has a total area of 580 square miles (1,500 km2), of which 578 square miles (1,500 km2) is land and 1.5 square miles (3.9 km2) (0.3%) is water.[5]
Major highways
 Interstate 20
 U.S. Highway 80
 Mississippi Highway 15
Adjacent counties
- Neshoba County (north)
- Lauderdale County (east)
- Jasper County (south)
- Scott County (west)
National protected area
- Bienville National Forest (part)
Demographics
| Historical population | |||
|---|---|---|---|
| Census | Pop. | %± | |
| 1840 | 2,527 | — | |
| 1850 | 4,465 | 76.7% | |
| 1860 | 9,661 | 116.4% | |
| 1870 | 10,067 | 4.2% | |
| 1880 | 13,436 | 33.5% | |
| 1890 | 16,625 | 23.7% | |
| 1900 | 19,708 | 18.5% | |
| 1910 | 23,085 | 17.1% | |
| 1920 | 20,727 | −10.2% | |
| 1930 | 22,910 | 10.5% | |
| 1940 | 24,249 | 5.8% | |
| 1950 | 22,681 | −6.5% | |
| 1960 | 19,517 | −14.0% | |
| 1970 | 18,983 | −2.7% | |
| 1980 | 19,944 | 5.1% | |
| 1990 | 20,291 | 1.7% | |
| 2000 | 21,838 | 7.6% | |
| 2010 | 21,720 | −0.5% | |
| 2018 (est.) | 21,443 | [6] | −1.3% |
| U.S. Decennial Census[7] 1790-1960[8] 1900-1990[9] 1990-2000[10] 2010-2013[1] | |||
2020 census
| Race | Num. | Perc. |
|---|---|---|
| White | 12,796 | 60.1% |
| Black or African American | 6,447 | 30.28% |
| Native American | 1,169 | 5.49% |
| Asian | 77 | 0.36% |
| Other/Mixed | 473 | 2.22% |
| Hispanic or Latino | 329 | 1.55% |
As of the 2020 United States Census, there were 21,291 people, 8,037 households, and 5,697 families residing in the county.
2000 census
As of the census[12] of 2000, there were 21,838 people, 8,221 households, and 6,001 families residing in the county. The population density was 38 people per square mile (15/km2). There were 9,259 housing units at an average density of 16 per square mile (6/km2). The racial makeup of the county was 65.01% white, 30.37% black or African American, 3.68% Native American, 0.18% Asian, 0.33% from other races, and 0.44% from two or more races. 0.91% of the population were Hispanic or Latino of any race.
There were 8,221 households, out of which 33.50% had children under the age of 18 living with them, 53.00% were married couples living together, 16.00% had a female householder with no husband present, and 27.00% were non-families. 24.60% of all households were made up of individuals, and 11.60% had someone living alone who was 65 years of age or older. The average household size was 2.57 and the average family size was 3.04.
In the county, the population was spread out, with 26.20% under the age of 18, 11.20% from 18 to 24, 26.00% from 25 to 44, 21.70% from 45 to 64, and 14.90% who were 65 years of age or older. The median age was 35 years. For every 100 females there were 92.40 males. For every 100 females age 18 and over, there were 88.70 males.
The median income for a household in the county was $28,735, and the median income for a family was $34,606. Males had a median income of $27,820 versus $20,757 for females. The per capita income for the county was $14,008. About 16.40% of families and 19.90% of the population were below the poverty line, including 26.30% of those under age 18 and 21.70% of those age 65 or over.
Communities
City
Towns
Census-designated place
- Conehatta
Unincorporated communities
- Battlefield
- Cedar Grove
- Duffee
- Lawrence
- Little Rock
- Perdue
- Stratton
Ghost towns
Politics
| Year | Republican | Democratic | Third party | |||
|---|---|---|---|---|---|---|
| No. | % | No. | % | No. | % | |
| 2020 | 6,997 | 68.71% | 3,075 | 30.20% | 111 | 1.09% |
| 2016 | 6,548 | 69.38% | 2,756 | 29.20% | 134 | 1.42% |
| 2012 | 6,394 | 65.40% | 3,319 | 33.95% | 64 | 0.65% |
| 2008 | 6,579 | 66.76% | 3,218 | 32.65% | 58 | 0.59% |
| 2004 | 6,165 | 72.63% | 2,280 | 26.86% | 43 | 0.51% |
| 2000 | 5,540 | 71.59% | 2,147 | 27.75% | 51 | 0.66% |
| 1996 | 4,223 | 61.30% | 2,163 | 31.40% | 503 | 7.30% |
| 1992 | 5,128 | 65.69% | 2,146 | 27.49% | 532 | 6.82% |
| 1988 | 5,658 | 70.70% | 2,332 | 29.14% | 13 | 0.16% |
| 1984 | 5,911 | 73.23% | 2,127 | 26.35% | 34 | 0.42% |
| 1980 | 4,317 | 54.36% | 3,455 | 43.51% | 169 | 2.13% |
| 1976 | 3,813 | 57.00% | 2,741 | 40.97% | 136 | 2.03% |
| 1972 | 5,585 | 88.05% | 597 | 9.41% | 161 | 2.54% |
| 1968 | 542 | 7.85% | 799 | 11.58% | 5,561 | 80.57% |
| 1964 | 4,735 | 95.21% | 238 | 4.79% | 0 | 0.00% |
| 1960 | 508 | 15.05% | 912 | 27.01% | 1,956 | 57.94% |
| 1956 | 360 | 11.52% | 2,359 | 75.46% | 407 | 13.02% |
| 1952 | 851 | 25.70% | 2,460 | 74.30% | 0 | 0.00% |
| 1948 | 39 | 1.47% | 169 | 6.38% | 2,442 | 92.15% |
| 1944 | 56 | 2.18% | 2,516 | 97.82% | 0 | 0.00% |
| 1940 | 41 | 1.61% | 2,495 | 98.27% | 3 | 0.12% |
| 1936 | 39 | 1.46% | 2,624 | 98.42% | 3 | 0.11% |
| 1932 | 56 | 2.41% | 2,253 | 97.11% | 11 | 0.47% |
| 1928 | 368 | 15.07% | 2,074 | 84.93% | 0 | 0.00% |
| 1924 | 72 | 3.95% | 1,657 | 90.94% | 93 | 5.10% |
| 1920 | 108 | 7.73% | 1,208 | 86.41% | 82 | 5.87% |
| 1916 | 19 | 1.34% | 1,341 | 94.70% | 56 | 3.95% |
| 1912 | 6 | 0.47% | 1,197 | 94.62% | 62 | 4.90% |
Education
School districts include:[14]
- Newton County School District
- Newton Municipal School District
- Union Public School District
Conehatta Elementary School of the Choctaw Tribal School System is in the community.[15]
See also
- Dry counties
- National Register of Historic Places listings in Newton County, Mississippi
References
- "State & County QuickFacts". United States Census Bureau. Archived from the original on March 9, 2013. Retrieved September 4, 2013.
- "Find a County". National Association of Counties. Retrieved June 7, 2011.
- Rowland, Dunbar (1907). Mississippi: Comprising Sketches of Counties, Towns, Events, Institutions, and Persons, Arranged in Cyclopedic Form. Vol. 2. Southern Historical Publishing Association. p. 339.
- "Descendants of Lynching Victims Dedicate Historical Marker in Hickory, Mississippi". Equal Justice Initiative. August 19, 2021. Retrieved October 12, 2021.
- "2010 Census Gazetteer Files". United States Census Bureau. August 22, 2012. Archived from the original on September 28, 2013. Retrieved November 6, 2014.
- "Population and Housing Unit Estimates". Retrieved November 9, 2019.
- "U.S. Decennial Census". United States Census Bureau. Retrieved November 6, 2014.
- "Historical Census Browser". University of Virginia Library. Retrieved November 6, 2014.
- "Population of Counties by Decennial Census: 1900 to 1990". United States Census Bureau. Retrieved November 6, 2014.
- "Census 2000 PHC-T-4. Ranking Tables for Counties: 1990 and 2000" (PDF). United States Census Bureau. Retrieved November 6, 2014.
- "Explore Census Data". data.census.gov. Retrieved December 8, 2021.
- "U.S. Census website". United States Census Bureau. Retrieved January 31, 2008.
- Leip, David. "Dave Leip's Atlas of U.S. Presidential Elections". uselectionatlas.org. Retrieved March 4, 2018.
- "2020 CENSUS - SCHOOL DISTRICT REFERENCE MAP: Newton County, MS" (PDF). U.S. Census Bureau. Retrieved August 6, 2022. - Text list
- "Home". Conehatta Elementary School. Retrieved August 6, 2022.
851 Tushka Drive Conehatta, MS 39057
Further reading
- A.J. Brown, History of Newton County, Mississippi from 1834 to 1894. Jackson, MS: Clarion-Ledger Co., 1894. • HTML version
- Nicholas Russell Murray, Newton County, Mississippi, 1872-1900. Hammond, LA: Hunting for Bears, 1981.
- Newton County Pictorial History Committee, Newton County, Mississippi: A Pictorial History. Humboldt, TN: Rose Publishing Co., 2000.
Places adjacent to Newton County, Mississippi | ||||||||||||||||
|---|---|---|---|---|---|---|---|---|---|---|---|---|---|---|---|---|
| ||||||||||||||||
Municipalities and communities of Newton County, Mississippi, United States | ||
|---|---|---|
County seat: Decatur | ||
| Cities |  | |
| Towns | ||
| CDPs |
| |
| Other unincorporated communities |
| |
| Ghost towns | ||
| Indian reservation |
| |
| Footnotes | ‡This populated place also has portions in an adjacent county or counties | |
| ||
Jackson (capital) | ||
| Topics |
|  Seal of Mississippi |
| Society |
| |
| Regions |
| |
| Metros |
| |
| Larger cities |
| |
| Smaller cities |
| |
| Counties |
| |
Authority control | |
|---|---|
| General | |
| National libraries | |
| Other |
|
На других языках
- [en] Newton County, Mississippi
[ru] Ньютон (округ, Миссисипи)
Округ Ньютон (англ. Newton County) — округ штата Миссисипи, США. Население округа на 2000 год составляло 21 838 человек. Административный центр округа — город Декейтер[en].Другой контент может иметь иную лицензию. Перед использованием материалов сайта WikiSort.org внимательно изучите правила лицензирования конкретных элементов наполнения сайта.
WikiSort.org - проект по пересортировке и дополнению контента Википедии