world.wikisort.org - USA
Gogebic County (/ɡoʊˈɡɪbɪk/ goh-GHIB-ik) is the westernmost county in the Upper Peninsula in the U.S. state of Michigan, and the westernmost in the state as a whole. As of the 2020 Census, the population was 14,380.[2] The county seat is Bessemer.[3] This was historically part of the territory of the Lake Superior Band of Chippewa, which had twelve bands in Michigan, Wisconsin and Minnesota. The Lac Vieux Desert Indian Reservation is in this county, in Watersmeet Township; it is the land base of one of the federally recognized tribes.
Gogebic County | |
|---|---|
U.S. county | |
 Gogebic County Courthouse, July 2014 | |
|
Logo | |
 Location within the U.S. state of Michigan | |
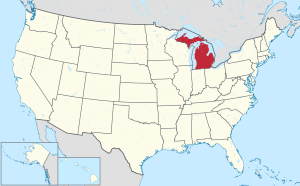 Michigan's location within the U.S. | |
| Coordinates: 46°29′N 89°47′W | |
| Country | |
| State | |
| Founded | 1887[1] |
| Named for | Lake Gogebic |
| Seat | Bessemer |
| Largest city | Ironwood |
| Area | |
| • Total | 1,476 sq mi (3,820 km2) |
| • Land | 1,102 sq mi (2,850 km2) |
| • Water | 374 sq mi (970 km2) 25%% |
| Population (2020) | |
| • Total | 14,380 |
| • Density | 15/sq mi (6/km2) |
| Time zone | UTC−6 (Central) |
| • Summer (DST) | UTC−5 (CDT) |
| Congressional district | 1st |
Gogebic County was organized in 1887, partitioned from Ontonagon County. The county's name derives from a lake of the same name, which was originally rendered Agogebic. Sources agree that the name is from Ojibwe, but differ on the original meaning. The county's website suggests it meant "body of water hanging on high,"[4] but an 1884 military annal said it meant "water-mold lake" (Agogibing).[5] (See also: List of place names of Native American origin in Michigan)
Geography
According to the U.S. Census Bureau, the county has a total area of 1,476 square miles (3,820 km2), of which 1,102 square miles (2,850 km2) is land and 374 square miles (970 km2) (25%) is water.[6]
Water features
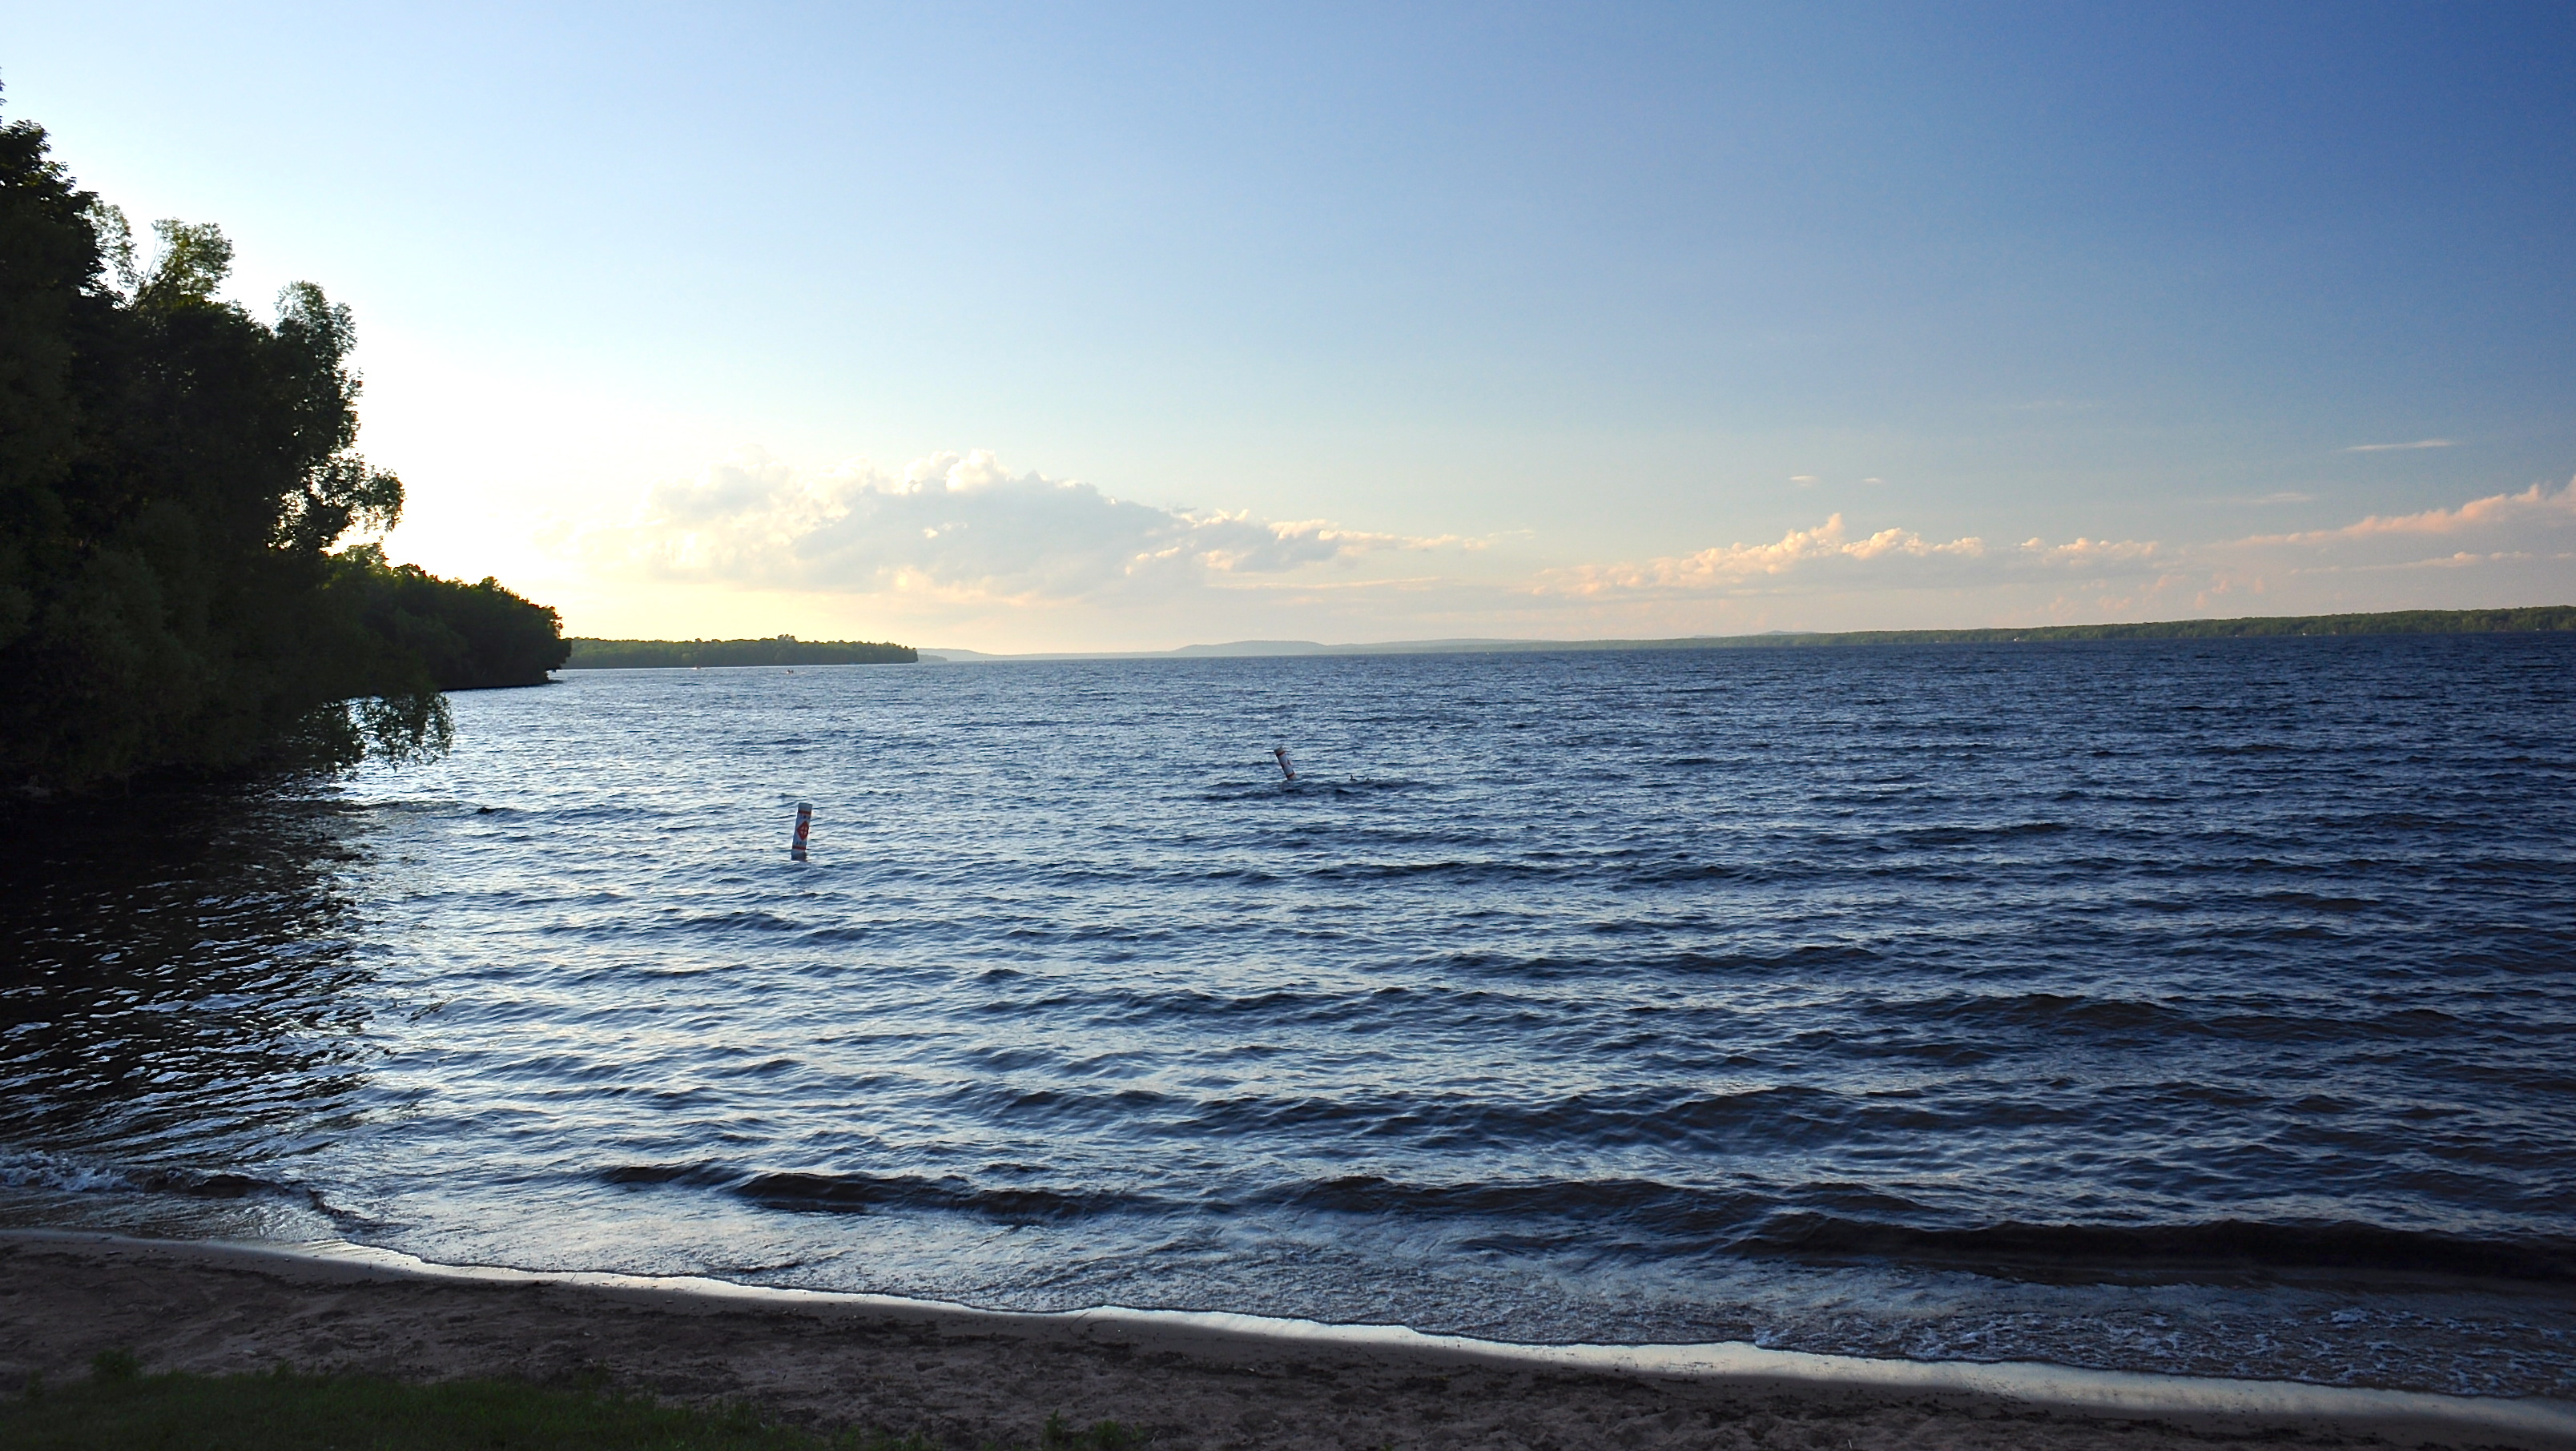
- Lake Superior – forms the county's northern land border.
- Lake Gogebic – the largest lake in the Upper Peninsula.
- Montreal River – forms the county's western border, as well as the state's border with Wisconsin in this area.
Adjacent counties
- Ontonagon County – north, northeast
- Iron County – east
- Vilas County, Wisconsin – south
- Iron County, Wisconsin – southwest
- Ashland County, Wisconsin – northwest
National protected area
- Ottawa National Forest (part)
State protected area
- Lake Gogebic State Park
Demographics
| Historical population | |||
|---|---|---|---|
| Census | Pop. | %± | |
| 1890 | 13,166 | — | |
| 1900 | 16,738 | 27.1% | |
| 1910 | 23,333 | 39.4% | |
| 1920 | 33,225 | 42.4% | |
| 1930 | 31,577 | −5.0% | |
| 1940 | 31,797 | 0.7% | |
| 1950 | 27,053 | −14.9% | |
| 1960 | 24,370 | −9.9% | |
| 1970 | 20,676 | −15.2% | |
| 1980 | 19,686 | −4.8% | |
| 1990 | 18,052 | −8.3% | |
| 2000 | 17,370 | −3.8% | |
| 2010 | 16,427 | −5.4% | |
| 2020 | 14,380 | −12.5% | |
| U.S. Decennial Census[7] 1790-1960[8] 1900-1990[9] 1990-2000[10] 2010-2018[2] | |||
The 2010 United States Census[11] indicates Gogebic County had a population of 16,427. This decrease of 943 people from the 2000 United States Census is a -5.4% change in population. In 2010 there were 7,037 households and 4,171 families residing in the county. The population density was 15 people per square mile (6/km2). There were 10,795 housing units at an average density of 10 per square mile (4/km2). 91.7% of the population were White, 4.1% Black or African American, 2.4% Native American, 0.2% Asian, 0.2% of some other race and 1.4% of two or more races. 0.9% were Hispanic or Latino (of any race). 17.4% were of Finnish, 12.8% German, 11.2% American, 10.0% Italian, 6.8% Polish, 6.7% English and 5.1% Irish ancestry.[12]
There were 7,037 households, out of which 20.6% had children under the age of 18 living with them, 45.4% were married couples living together, 9.3% had a female householder with no husband present, and 40.7% were non-families. 35.3% of all households were made up of individuals, and 16.5% had someone living alone who was 65 years of age or older. The average household size was 2.11 and the average family size was 2.69.
The county population was 16.9% under the age of 18, 8.4% from 18 to 24, 22.2% from 25 to 44, 31.1% from 45 to 64, and 21.5% who were 65 years of age or older. The median age was 46.8 years. 53.3% of the population was male, and 46.7% of the population was female.
The median income for a household in the county was $34,917, and the median income for a family was $47,219. The per capita income for the county was $20,759. About 14.0% of families and 17.2% of the population were below the poverty line, including 28.6% of those under age 18 and 9.0% of those age 65 or over.
Politics
Gogebic County was reliably Republican at the beginning of the twentieth century. Roosevelt's New Deal changed the county's mood, which has voted for the Democratic candidate in all but four presidential elections since 1932. In 2016, Donald Trump became the first Republican to win the county since Richard Nixon did in 1972. Trump carried the county again in 2020, despite losing nationally.
| Year | Republican | Democratic | Third party | |||
|---|---|---|---|---|---|---|
| No. | % | No. | % | No. | % | |
| 2020 | 4,600 | 55.58% | 3,570 | 43.14% | 106 | 1.28% |
| 2016 | 4,018 | 54.42% | 2,925 | 39.62% | 440 | 5.96% |
| 2012 | 3,444 | 45.24% | 4,058 | 53.30% | 111 | 1.46% |
| 2008 | 3,330 | 40.21% | 4,757 | 57.44% | 194 | 2.34% |
| 2004 | 3,935 | 46.56% | 4,421 | 52.31% | 96 | 1.14% |
| 2000 | 3,929 | 47.12% | 4,066 | 48.76% | 344 | 4.13% |
| 1996 | 2,769 | 33.83% | 4,436 | 54.19% | 981 | 11.98% |
| 1992 | 2,838 | 30.76% | 4,792 | 51.95% | 1,595 | 17.29% |
| 1988 | 3,509 | 40.38% | 5,151 | 59.27% | 31 | 0.36% |
| 1984 | 4,006 | 41.81% | 5,554 | 57.97% | 21 | 0.22% |
| 1980 | 4,388 | 42.80% | 5,254 | 51.25% | 610 | 5.95% |
| 1976 | 3,953 | 38.04% | 6,341 | 61.02% | 98 | 0.94% |
| 1972 | 5,631 | 52.26% | 4,984 | 46.25% | 161 | 1.49% |
| 1968 | 4,140 | 39.71% | 5,839 | 56.00% | 447 | 4.29% |
| 1964 | 3,350 | 29.60% | 7,945 | 70.19% | 24 | 0.21% |
| 1960 | 5,429 | 42.89% | 7,200 | 56.88% | 30 | 0.24% |
| 1956 | 6,865 | 52.68% | 6,142 | 47.13% | 25 | 0.19% |
| 1952 | 6,195 | 47.47% | 6,803 | 52.13% | 53 | 0.41% |
| 1948 | 5,204 | 41.40% | 6,722 | 53.48% | 643 | 5.12% |
| 1944 | 5,283 | 39.82% | 7,938 | 59.83% | 47 | 0.35% |
| 1940 | 6,431 | 40.87% | 9,104 | 57.86% | 199 | 1.26% |
| 1936 | 4,649 | 35.07% | 8,461 | 63.82% | 147 | 1.11% |
| 1932 | 5,379 | 46.69% | 5,531 | 48.01% | 611 | 5.30% |
| 1928 | 6,061 | 64.74% | 3,134 | 33.48% | 167 | 1.78% |
| 1924 | 5,128 | 66.54% | 487 | 6.32% | 2,092 | 27.14% |
| 1920 | 5,486 | 79.72% | 823 | 11.96% | 573 | 8.33% |
| 1916 | 2,204 | 55.04% | 1,540 | 38.46% | 260 | 6.49% |
| 1912 | 818 | 26.92% | 572 | 18.82% | 1,649 | 54.26% |
| 1908 | 2,256 | 72.96% | 614 | 19.86% | 222 | 7.18% |
| 1904 | 2,111 | 77.98% | 414 | 15.29% | 182 | 6.72% |
| 1900 | 2,166 | 73.13% | 676 | 22.82% | 120 | 4.05% |
| 1896 | 1,982 | 68.37% | 837 | 28.87% | 80 | 2.76% |
| 1892 | 2,344 | 57.25% | 1,615 | 39.45% | 135 | 3.30% |
| 1888 | 1,367 | 54.35% | 1,112 | 44.21% | 36 | 1.43% |
Government

The county government operates the jail, maintains rural roads, operates the major local courts, maintains vital records and property records, administers public health regulations, and participates with the state in the provision of welfare and other social services. The county board of commissioners controls the budget and has limited authority to make laws or ordinances. In Michigan, most local government functions — police and fire, building and zoning, tax assessment, street maintenance, etc. — are the responsibility of individual cities and townships.
Transportation
Major highways
 US 2
US 2 Bus. US 2 serves the city of Ironwood.
 US 45
US 45 M-28
M-28 M-64
M-64
Airport
- KIWD - Gogebic-Iron County Airport – 7 miles (13 km) NE of Ironwood. Commercial air service is available.
Communities

Cities
Charter township
Civil townships
Census-designated places
Other unincorporated communities
Indian reservations
See also
- List of Michigan State Historic Sites in Gogebic County, Michigan
- National Register of Historic Places listings in Gogebic County, Michigan
References
- "Bibliography on Gogebic County". Clarke Historical Library, Central Michigan University. Retrieved June 29, 2013.
- "State & County QuickFacts". US Census Bureau. Retrieved September 15, 2021.
- "Find a County". National Association of Counties. Archived from the original on May 31, 2011. Retrieved June 7, 2011.
- Heikkinen, Carlo (1966). "Little Known Facts of the Gogebic Range". Gogebic County. Archived from the original on November 2016.
- Kelton, Dwight H. (1884). Annals of Fort Mackinac. Library of Congress. pp. 146–147.
- "2010 Census Gazetteer Files". US Census Bureau. August 22, 2012. Archived from the original on November 13, 2013. Retrieved September 21, 2014.
- "US Decennial Census". US Census Bureau. Retrieved September 21, 2014.
- "Historical Census Browser". University of Virginia Library. Retrieved September 21, 2014.
- "Population of Counties by Decennial Census: 1900 to 1990". US Census Bureau. Retrieved September 21, 2014.
- "Census 2000 PHC-T-4. Ranking Tables for Counties: 1990 and 2000" (PDF). US Census Bureau. Retrieved September 21, 2014.
- "U.S. Census website". Retrieved July 6, 2013.
- Data Access and Dissemination Systems (DADS). "U.S. Census website". census.gov.
- US Election Atlas
External links
- Gogebic County government
- Gogebic County Profile, Sam M Cohodas Regional Economist, Tawni Hunt Ferrarini, Ph.D.
- "Bibliography on Gogbebic County". Clarke Historical Library, Central Michigan University. Retrieved January 19, 2013.
- Western Upper Peninsula Planning & Development Region
Places adjacent to Gogebic County, Michigan | ||||||||||||||||
|---|---|---|---|---|---|---|---|---|---|---|---|---|---|---|---|---|
| ||||||||||||||||
Municipalities and communities of Gogebic County, Michigan, United States | ||
|---|---|---|
County seat: Bessemer | ||
| Cities |  | |
| Charter township | ||
| Civil townships | ||
| CDPs |
| |
| Other unincorporated communities | ||
| Indian reservation | ||
| ||
| Central cities | |
|---|---|
| Counties | |
| Geography |
|
| Transportation |
|
| Economy |
|
| |
Authority control | |
|---|---|
| General | |
| National libraries | |
| Other |
|
На других языках
[de] Gogebic County
Das Gogebic County[1] ist ein County im US-amerikanischen Bundesstaat Michigan. Im Jahr 2010 hatte das County 16.427 Einwohner und eine Bevölkerungsdichte von 5,8 Einwohnern pro Quadratkilometer. Bis 2013 verringerte sich die Einwohnerzahl auf 15.916.[2] Der Verwaltungssitz (County Seat) ist Bessemer.[3]- [en] Gogebic County, Michigan
[ru] Гогибик (округ)
Округ Гогибик (англ. Gogebic County) располагается в штате Мичиган, США. Официально образован в 1887 году. По состоянию на 2010 год, численность населения составляла 16 427 человек.Другой контент может иметь иную лицензию. Перед использованием материалов сайта WikiSort.org внимательно изучите правила лицензирования конкретных элементов наполнения сайта.
WikiSort.org - проект по пересортировке и дополнению контента Википедии