world.wikisort.org - USA
Trinity County is a county located in the northwestern portion of the U.S. state of California. Trinity County is rugged, mountainous, heavily forested, and lies along the Trinity River (for which it is named) within the Salmon and Klamath Mountains. It is also one of three counties in California with no incorporated cities (the other two counties in California with that distinction are Alpine and Mariposa counties).[6]
Trinity County, California | |
|---|---|
County | |
| County of Trinity | |
    Images, from top down, left to right: Weaverville Historic District, Hayfork Creek, Trinity Lake, Weaverville Joss House State Historic Park | |
 Seal | |
 Interactive map of Trinity County | |
 Location in the state of California | |
| Country | United States |
| State | California |
| Region | North Coast |
| Incorporated | February 18, 1850[1] |
| Named for | Trinity River |
| County seat | Weaverville |
| Largest community | Weaverville |
| Government | |
| • Type | Council–CAO |
| • Chair[2] | Dan Frasier |
| • Vice Chair | Keith Groves |
| • Board of Supervisors[3] | Supervisors
|
| • Interim County Administrative Officer | Letty Garza |
| Area | |
| • Total | 3,208 sq mi (8,310 km2) |
| • Land | 3,179 sq mi (8,230 km2) |
| • Water | 28 sq mi (70 km2) |
| Highest elevation | 9,037 ft (2,754 m) |
| Population (April 1, 2020)[5] | |
| • Total | 16,112 |
| • Density | 5.0/sq mi (1.9/km2) |
| Time zone | UTC−8 (Pacific Time Zone) |
| • Summer (DST) | UTC−7 (Pacific Daylight Time) |
| Area code | 530 |
| FIPS code | 06-105 |
| GNIS feature ID | 277317 |
| Website | www |
As of the 2020 census, the population was 16,112,[5] making it the fifth least-populous county in California, and the least-populous of California's 27 original counties. The county seat and largest community is Weaverville.[7]
History
Trinity County has a rich history of Native Americans: Tsnungwe including the South Fork Hupa and tł'oh-mitah-xwe,[8] Chimariko, and Wintu.
The county takes its name from the Trinity River, which was in turn named in 1845 by Major Pierson B. Reading, who was under the mistaken impression that the river emptied into Trinidad Bay. Trinity is the English translation of Trinidad.
Trinity County was one of the original counties of California, created in 1850 at the time of statehood. Parts of the county were ceded to Klamath County in 1852 and to Humboldt County in 1853.
Geography
According to the U.S. Census Bureau, the county has a total area of 3,208 square miles (8,310 km2), of which 3,179 square miles (8,230 km2) is land and 28 square miles (73 km2) (0.9%) is water.[9] The county contains a significant portion of Shasta-Trinity National Forest and the Trinity Alps Wilderness—the second largest wilderness in California.
Trinity County is made up of five census tracts. Census Tract 1.01 includes the communities of Douglas City, Lewiston, Trinity Center, and part of Coffee Creek and Weaverville. Notable features are Trinity Dam and Lake, Lewiston Dam and Lake, the Trinity River, and the Lewiston Valley. It has a population of 2585 people in 550 square miles, leading to a population density of 4.7 people per square mile.[10] Census Tract 1.02 includes most of Weaverville and Coffee Creek. It is the most populous census tract in the county, with 4558 people. It has 449 square miles, leading to a population density of 10.2 people per square mile. Notable features are the Weaver Basin, the Trinity Alps, Scott Mountain, and the upper Trinity River.[11] Census Tract 2 includes the Downriver area of Trinity County. This means the communities of Junction City, Big Flat, Big Bar, Burnt Ranch, Hawkins Bar, and Salyer. It includes 2024 people, and notable features are the Trinity River, the Trinity Alps, and the New River.[12] Census Tract 3 includes the communities of Hayfork, Hyampom, and Wildwood. It has 3105 people in 600 square miles, leading to a population density of 5.2 people per square mile. Notable features are the South Fork of the Trinity River, South Fork Mountain, Hayfork Valley, Hyampom Valley, Chanchellula Peak, and Hayfork Bally. Census Tract 4 is the largest by area but the least populous census tract in the county with 975 people. It contains 833 square miles, leading to a population density of 1.2 people per square mile. The largest community by far is Mad River, with other smaller ones being Ruth, Kettenpom, and Zenia. Notable features include South Fork Mountain, the Mad River, the Van Duzen River, Ruth Lake, Ruth Valley, Kettenpom Valley, and Hoaglin Valley.
The county hosts many visitors, especially during summer months, for camping, backpacking, boating on the lakes, rafting/kayaking on the rivers, hunting, and fishing. The summers tend to be clear, sunny, warm, and very dry, with little rain from June to September except for some mountain thunderstorms in the highest elevations. Summer days in the populated areas of the county range from 90 to 97 degrees, and summer nights range from 45 to 55. Winter days range from 40 to 50, and nights range from 25 to 35. The winters tend to have copious precipitation, increasing with elevation and falling mostly as rain under 1000m/3300 ft in the valley bottoms, and mostly as snow over 1000m/3300 ft on the mountainsides. December, January, and February are the wettest. The precipitation ranges from 30 to 35 inches at low elevations isolated from coastal influence, such as Big Bar, Hayfork, and Weaverville, up to 55 or 60 inches at high elevations, on the coastal side of South Fork Mountain, or where gaps in the mountain allow for precipitation to get through. Examples of this last phenomenon include Salyer and Forest Glen. Kalmia Lake, at nearly 7500 feet in the Canyon Creek area of the Trinity Alps, is reputed to be the snowiest place in California, outpacing Lake Helen in Mount Lassen National Park, which receives 600-700 inches of snow each winter. Average snowfall in the populated parts of the county ranges from 0-5 inches in the lower Trinity Valley to at least 100 inches in places above 4000 feet, such as Indian Valley west of Hayfork.
There is an extensive wild river and stream system, and the terrain is quite rugged and forested, with the highest point at Mount Eddy, over 9,000 ft (2,700 m). The Klamath Mountains occupy the vast portion of the county.
Adjacent counties
- Siskiyou County - north
- Shasta County - east
- Tehama County - southeast
- Mendocino County - south
- Humboldt County - west
National protected areas
- Shasta-Trinity National Forest (part)[13]
- Six Rivers National Forest (part)[14]
- Mendocino National Forest (part)[15]
- Shasta-Trinity National Recreation Area (part)[16]
- Trinity Alps Wilderness (part)[17]
- Yolla Bolly-Middle Eel Wilderness (part)[18]
Climate
Trinity County has a mediterranean climate with very warm, dry and sunny summer days and high diurnal temperature variation due to the cool nights. The hot afternoons form a stark contrast to the mild coastal climates of Humboldt County relatively nearby. Winters are chilly and wet. Below is climate normals from county seat Weaverville. There are different microclimates in the county as elevations vary.
| Climate data for Weaverville, California (1991–2020 normals, 1894–2020 extremes) | |||||||||||||
|---|---|---|---|---|---|---|---|---|---|---|---|---|---|
| Month | Jan | Feb | Mar | Apr | May | Jun | Jul | Aug | Sep | Oct | Nov | Dec | Year |
| Record high °F (°C) | 75 (24) |
82 (28) |
90 (32) |
94 (34) |
106 (41) |
113 (45) |
113 (45) |
116 (47) |
111 (44) |
104 (40) |
89 (32) |
85 (29) |
116 (47) |
| Mean maximum °F (°C) | 61.0 (16.1) |
69.2 (20.7) |
77.4 (25.2) |
84.8 (29.3) |
93.5 (34.2) |
101.0 (38.3) |
105.3 (40.7) |
104.4 (40.2) |
100.6 (38.1) |
91.0 (32.8) |
72.4 (22.4) |
59.1 (15.1) |
106.8 (41.6) |
| Average high °F (°C) | 49.5 (9.7) |
55.3 (12.9) |
61.1 (16.2) |
67.6 (19.8) |
77.1 (25.1) |
86.1 (30.1) |
95.1 (35.1) |
94.5 (34.7) |
88.5 (31.4) |
75.2 (24.0) |
57.3 (14.1) |
46.7 (8.2) |
71.2 (21.8) |
| Daily mean °F (°C) | 40.3 (4.6) |
43.3 (6.3) |
47.2 (8.4) |
51.8 (11.0) |
59.4 (15.2) |
66.3 (19.1) |
73.7 (23.2) |
72.3 (22.4) |
66.2 (19.0) |
55.8 (13.2) |
45.4 (7.4) |
38.6 (3.7) |
55.0 (12.8) |
| Average low °F (°C) | 31.2 (−0.4) |
31.2 (−0.4) |
33.3 (0.7) |
36.1 (2.3) |
41.8 (5.4) |
46.4 (8.0) |
52.2 (11.2) |
50.0 (10.0) |
43.9 (6.6) |
36.4 (2.4) |
33.4 (0.8) |
30.5 (−0.8) |
38.9 (3.8) |
| Mean minimum °F (°C) | 20.3 (−6.5) |
20.7 (−6.3) |
23.1 (−4.9) |
25.7 (−3.5) |
31.3 (−0.4) |
35.9 (2.2) |
43.8 (6.6) |
42.6 (5.9) |
34.8 (1.6) |
27.1 (−2.7) |
21.3 (−5.9) |
19.0 (−7.2) |
14.9 (−9.5) |
| Record low °F (°C) | −7 (−22) |
0 (−18) |
12 (−11) |
16 (−9) |
22 (−6) |
28 (−2) |
32 (0) |
29 (−2) |
23 (−5) |
14 (−10) |
4 (−16) |
−10 (−23) |
−10 (−23) |
| Average precipitation inches (mm) | 6.68 (170) |
5.69 (145) |
5.01 (127) |
2.62 (67) |
1.86 (47) |
0.93 (24) |
0.27 (6.9) |
0.17 (4.3) |
0.31 (7.9) |
2.00 (51) |
4.33 (110) |
7.67 (195) |
37.54 (954) |
| Average snowfall inches (cm) | 2.2 (5.6) |
1.3 (3.3) |
0.2 (0.51) |
0.2 (0.51) |
0.0 (0.0) |
0.0 (0.0) |
0.0 (0.0) |
0.0 (0.0) |
0.0 (0.0) |
0.0 (0.0) |
0.8 (2.0) |
4.0 (10) |
8.7 (22) |
| Average precipitation days (≥ 0.01 in) | 17.1 | 14.8 | 13.8 | 10.3 | 5.7 | 3.6 | 1.3 | 1.2 | 2.1 | 6.0 | 14.5 | 18.1 | 108.5 |
| Average snowy days (≥ 0.1 in) | 1.5 | 0.8 | 0.4 | 0.3 | 0.0 | 0.0 | 0.0 | 0.0 | 0.0 | 0.0 | 0.5 | 1.4 | 4.9 |
| Source: NOAA[19] | |||||||||||||
Politics
Trinity was a Republican-leaning county in Presidential and congressional elections until recently; now it is a tossup. No Democrat had won the county since Jimmy Carter in 1976 until Barack Obama defeated John McCain by a 4% margin (50% to 46%) in 2008. In 2012, the county again voted Republican, but narrowly. Voter registration reflects this trend, with Democratic and Republican registration in a near dead heat (D: 2,710, R: 2,716). Third-party candidates tend to do rather well in Trinity County: George Wallace got over 13% of the county's vote in 1968, and it was the only California county carried by Ross Perot in 1992. It was also Perot's best performance in the state in 1996, although he didn't carry it again. John Anderson also did very well in 1980, as did third-party candidates in 2016.
Trinity County was the only California county where Obama won in 2008 and Joe Biden lost in 2020.
| Year | Republican | Democratic | Third party | |||
|---|---|---|---|---|---|---|
| No. | % | No. | % | No. | % | |
| 2020 | 3,188 | 50.36% | 2,851 | 45.04% | 291 | 4.60% |
| 2016 | 2,812 | 48.62% | 2,214 | 38.28% | 758 | 13.11% |
| 2012 | 2,716 | 47.33% | 2,674 | 46.59% | 349 | 6.08% |
| 2008 | 2,940 | 45.72% | 3,233 | 50.28% | 257 | 4.00% |
| 2004 | 3,560 | 54.66% | 2,782 | 42.71% | 171 | 2.63% |
| 2000 | 3,340 | 57.62% | 1,932 | 33.33% | 525 | 9.06% |
| 1996 | 2,530 | 42.93% | 2,203 | 37.38% | 1,160 | 19.68% |
| 1992 | 1,886 | 31.28% | 1,967 | 32.63% | 2,176 | 36.09% |
| 1988 | 3,267 | 54.63% | 2,518 | 42.11% | 195 | 3.26% |
| 1984 | 3,544 | 59.71% | 2,218 | 37.37% | 173 | 2.91% |
| 1980 | 3,048 | 54.96% | 1,734 | 31.27% | 764 | 13.78% |
| 1976 | 1,989 | 45.66% | 2,172 | 49.86% | 195 | 4.48% |
| 1972 | 1,868 | 50.75% | 1,621 | 44.04% | 192 | 5.22% |
| 1968 | 1,426 | 43.12% | 1,433 | 43.33% | 448 | 13.55% |
| 1964 | 1,252 | 36.41% | 2,175 | 63.25% | 12 | 0.35% |
| 1960 | 1,418 | 38.35% | 2,262 | 61.17% | 18 | 0.49% |
| 1956 | 1,447 | 50.42% | 1,406 | 48.99% | 17 | 0.59% |
| 1952 | 1,697 | 57.14% | 1,242 | 41.82% | 31 | 1.04% |
| 1948 | 975 | 45.08% | 1,053 | 48.68% | 135 | 6.24% |
| 1944 | 567 | 42.22% | 770 | 57.33% | 6 | 0.45% |
| 1940 | 780 | 34.79% | 1,431 | 63.83% | 31 | 1.38% |
| 1936 | 655 | 30.87% | 1,424 | 67.11% | 43 | 2.03% |
| 1932 | 318 | 21.09% | 1,101 | 73.01% | 89 | 5.90% |
| 1928 | 447 | 48.85% | 433 | 47.32% | 35 | 3.83% |
| 1924 | 336 | 36.48% | 154 | 16.72% | 431 | 46.80% |
| 1920 | 622 | 62.89% | 285 | 28.82% | 82 | 8.29% |
| 1916 | 424 | 35.16% | 661 | 54.81% | 121 | 10.03% |
| 1912 | 1 | 0.10% | 461 | 46.29% | 534 | 53.61% |
| 1908 | 393 | 44.41% | 331 | 37.40% | 161 | 18.19% |
| 1904 | 467 | 54.11% | 308 | 35.69% | 88 | 10.20% |
| 1900 | 544 | 52.36% | 485 | 46.68% | 10 | 0.96% |
| 1896 | 502 | 46.44% | 545 | 50.42% | 34 | 3.15% |
| 1892 | 495 | 50.82% | 457 | 46.92% | 22 | 2.26% |
Trinity County is in California's 2nd congressional district, represented by Democrat Jared Huffman.[21]
In the state legislature Trinity is in the 2nd Senate District, represented by Democrat Mike McGuire,[22] and the 2nd Assembly District, represented by Democrat Jim Wood.[23]
In 2010, Trinity County voted against Proposition 19, which would have taxed and regulated marijuana.
In 2016 Trinity County residents were asked again to vote on legalization of state-level recreational marijuana, facilitated by the Adult Use of Marijuana Act (AUMA), also known as California Proposition 64. The measure passed with 50.1% in favor of legalization.[24] Statewide, the measure passed with 57.1% of the vote.[25]
Voter registration statistics
| Population and registered voters | ||
|---|---|---|
| Total population[26] | 13,711 | |
| Registered voters[27][note 1] | 7,846 | 57.2% |
| Democratic[27] | 2,630 | 33.5% |
| Republican[27] | 2,695 | 34.3% |
| Democratic–Republican spread[27] | -65 | -0.8% |
| Independent[27] | 376 | 4.8% |
| Green[27] | 126 | 1.6% |
| Libertarian[27] | 93 | 1.2% |
| Peace and Freedom[27] | 33 | 0.4% |
| Americans Elect[27] | 0 | 0.0% |
| Other[27] | 100 | 1.3% |
| No party preference[27] | 1,793 | 22.9% |
Transportation
Major highways
Public transportation
Trinity Transit provides weekday intercity bus service on State Routes 3 and 299, with connecting service in Willow Creek and Redding. Service is also provided from Weaverville to Lewiston (MWF) and Hayfork (daily).
Airports
The county owns five general aviation airports: Trinity Center Airport, Weaverville Airport, Hayfork Airport, Hyampom Airport and Ruth Airport.
Crime
The following table includes the number of incidents reported and the rate per 1,000 persons for each type of offense.
| Population and crime rates | ||
|---|---|---|
| Population[26] | 13,711 | |
| Violent crime[29] | 22 | 1.60 |
| Homicide[29] | 0 | 0.00 |
| Forcible rape[29] | 0 | 0.00 |
| Robbery[29] | 3 | 0.22 |
| Aggravated assault[29] | 19 | 1.39 |
| Property crime[29] | 123 | 8.97 |
| Burglary[29] | 60 | 4.38 |
| Larceny-theft[29][note 2] | 66 | 4.81 |
| Motor vehicle theft[29] | 26 | 1.90 |
| Arson[29] | 0 | 0.00 |
Demographics
2011
| Population, race, and income | |||||
|---|---|---|---|---|---|
| Total population[26] | 13,711 | ||||
| White[26] | 12,201 | 89.0% | |||
| Black or African American[26] | 53 | 0.4% | |||
| American Indian or Alaska Native[26] | 237 | 1.7% | |||
| Asian[26] | 158 | 1.2% | |||
| Native Hawaiian or other Pacific Islander[26] | 40 | 0.3% | |||
| Some other race[26] | 130 | 0.9% | |||
| Two or more races[26] | 892 | 6.5% | |||
| Hispanic or Latino (of any race)[30] | 924 | 6.7% | |||
| Per capita income[31] | $22,551 | ||||
| Median household income[32] | $37,672 | ||||
| Median family income[33] | $46,980 | ||||
Places by population, race, and income
| Places by population and race | ||||||||
|---|---|---|---|---|---|---|---|---|
| Place | Type[34] | Population[26] | White[26] | Other[26] [note 3] |
Asian[26] | Black or African American[26] |
Native American[26] [note 4] |
Hispanic or Latino (of any race)[30] |
| Burnt Ranch | CDP | 293 | 92.8% | 6.1% | 0.0% | 0.0% | 1.0% | 2.0% |
| Coffee Creek | CDP | 219 | 96.3% | 3.7% | 0.0% | 0.0% | 0.0% | 3.7% |
| Douglas City | CDP | 647 | 87.6% | 10.7% | 1.4% | 0.0% | 0.3% | 5.6% |
| Hayfork | CDP | 2,063 | 83.9% | 10.9% | 3.6% | 0.0% | 1.6% | 7.7% |
| Hyampom | CDP | 190 | 71.1% | 28.9% | 0.0% | 0.0% | 0.0% | 0.0% |
| Junction City | CDP | 955 | 96.1% | 3.4% | 0.0% | 0.0% | 0.5% | 5.1% |
| Lewiston | CDP | 1,391 | 89.1% | 6.8% | 0.0% | 0.0% | 4.1% | 5.6% |
| Mad River | CDP | 391 | 90.8% | 2.3% | 0.0% | 0.0% | 6.9% | 1.8% |
| Ruth | CDP | 144 | 100.0% | 0.0% | 0.0% | 0.0% | 0.0% | 0.0% |
| Trinity Center | CDP | 173 | 100.0% | 0.0% | 0.0% | 0.0% | 0.0% | 0.0% |
| Trinity Village | CDP | 163 | 100.0% | 0.0% | 0.0% | 0.0% | 0.0% | 0.0% |
| Weaverville | CDP | 3,703 | 92.1% | 6.3% | 0.0% | 0.5% | 1.1% | 11.4% |
| Places by population and income | |||||
|---|---|---|---|---|---|
| Place | Type[34] | Population[35] | Per capita income[31] | Median household income[32] | Median family income[33] |
| Burnt Ranch | CDP | 293 | $35,310 | $28,929 | $52,188 |
| Coffee Creek | CDP | 219 | $27,940 | $55,714 | $36,607 |
| Douglas City | CDP | 647 | $32,114 | $41,042 | $51,667 |
| Hayfork | CDP | 2,063 | $18,017 | $37,333 | $52,976 |
| Hyampom | CDP | 190 | $13,598 | $25,729 | $27,000 |
| Junction City | CDP | 955 | $17,128 | $36,250 | $41,250 |
| Lewiston | CDP | 1,391 | $23,990 | $44,375 | $50,250 |
| Mad River | CDP | 391 | $13,773 | $23,813 | $52,589 |
| Ruth | CDP | 144 | $24,099 | $51,250 | $73,000 |
| Trinity Center | CDP | 173 | $24,619 | $26,563 | $28,125 |
| Trinity Village | CDP | 163 | $15,528 | $23,315 | $23,438 |
| Weaverville | CDP | 3,703 | $24,714 | $42,337 | $47,135 |
2010
The 2010 United States Census reported that Trinity County had a population of 13,786. The racial makeup of Trinity County was 12,033 (87.3%) White, 59 (0.4%) African American, 655 (4.8%) Native American, 94 (0.7%) Asian, 16 (0.1%) Pacific Islander, 217 (1.6%) from other races, and 712 (5.2%) from two or more races. Hispanic or Latino of any race were 959 persons (7.0%).[36]
| Population reported at 2010 United States Census | |||||||||
|---|---|---|---|---|---|---|---|---|---|
The County | Total Population | White | African American | Native American | Asian | Pacific Islander | other races | two or more races | Hispanic or Latino (of any race) |
| Trinity County | 13,786 | 12,033 | 59 | 655 | 94 | 16 | 217 | 712 | 959 |
Census-designated places | Total Population | White | African American | Native American | Asian | Pacific Islander | other races | two or more races | Hispanic or Latino (of any race) |
| Burnt Ranch | 281 | 241 | 0 | 15 | 4 | 0 | 1 | 20 | 19 |
| Coffee Creek | 217 | 198 | 0 | 5 | 5 | 0 | 3 | 6 | 16 |
| Douglas City | 713 | 639 | 0 | 22 | 8 | 2 | 13 | 29 | 47 |
| Hayfork | 2,368 | 1,999 | 4 | 162 | 8 | 2 | 38 | 155 | 189 |
| Hyampom | 241 | 199 | 0 | 20 | 0 | 0 | 7 | 15 | 19 |
| Junction City | 680 | 597 | 1 | 29 | 2 | 0 | 20 | 31 | 49 |
| Lewiston | 1,193 | 1,074 | 8 | 37 | 6 | 5 | 21 | 42 | 78 |
| Mad River | 420 | 383 | 1 | 11 | 1 | 0 | 7 | 17 | 21 |
| Ruth | 195 | 170 | 0 | 9 | 1 | 0 | 1 | 14 | 2 |
| Trinity Center | 267 | 249 | 0 | 7 | 1 | 3 | 2 | 5 | 11 |
| Trinity Village | 297 | 269 | 1 | 18 | 0 | 0 | 0 | 9 | 4 |
| Weaverville | 3,600 | 3,162 | 11 | 152 | 41 | 1 | 38 | 195 | 255 |
Other unincorporated areas | Total Population | White | African American | Native American | Asian | Pacific Islander | other races | two or more races | Hispanic or Latino (of any race) |
| All others not CDPs (combined) | 3,314 | 2,853 | 33 | 168 | 17 | 3 | 66 | 174 | 249 |
2000
| Historical population | |||
|---|---|---|---|
| Census | Pop. | %± | |
| 1850 | 1,635 | — | |
| 1860 | 5,125 | 213.5% | |
| 1870 | 3,213 | −37.3% | |
| 1880 | 4,999 | 55.6% | |
| 1890 | 3,719 | −25.6% | |
| 1900 | 4,383 | 17.9% | |
| 1910 | 3,301 | −24.7% | |
| 1920 | 2,551 | −22.7% | |
| 1930 | 2,809 | 10.1% | |
| 1940 | 3,970 | 41.3% | |
| 1950 | 5,087 | 28.1% | |
| 1960 | 9,706 | 90.8% | |
| 1970 | 7,615 | −21.5% | |
| 1980 | 11,858 | 55.7% | |
| 1990 | 13,063 | 10.2% | |
| 2000 | 13,022 | −0.3% | |
| 2010 | 13,786 | 5.9% | |
| 2020 | 16,112 | 16.9% | |
| U.S. Decennial Census[37] 1790-1960[38] 1900-1990[39] 1990-2000[40] 2010-2020[5] | |||
This section needs to be updated. The reason given is: Newer information is available from the 2010 and 2020 Census reports. (December 2021) |
As of the census[41] of 2000, there were 13,022 people, 5,587 households, and 3,625 families residing in the county. The population density was 4 people per square mile (2/km2). There were 7,980 housing units at an average density of 2 per square mile (1/km2). The racial makeup of the county was 88.9% White, 0.5% Black or African American, 4.9% Native American, 0.5% Asian, 0.1% Pacific Islander, 0.9% from other races, and 4.4% from two or more races. 4.0% of the population were Hispanic or Latino of any race. 16.1% were of German, 13.4% English, 12.1% Irish and 9.5% American ancestry according to Census 2000. 97.3% spoke English and 1.8% Spanish as their first language.
There were 5,587 households, out of which 25.4% had children under the age of 18 living with them, 50.5% were married couples living together, 10.1% had a female householder with no husband present, and 35.1% were non-families. 29.5% of all households were made up of individuals, and 11.1% had someone living alone who was 65 years of age or older. The average household size was 2.29 and the average family size was 2.80.
In the county, the population was spread out, with 22.8% under the age of 18, 5.1% from 18 to 24, 22.7% from 25 to 44, 32.1% from 45 to 64, and 17.2% who were 65 years of age or older. The median age was 45 years. For every 100 females there were 104.2 males. For every 100 females age 18 and over, there were 102.6 males.
The median income for a household in the county was $27,711, and the median income for a family was $34,343. Males had a median income of $31,131 versus $24,271 for females. The per capita income for the county was $16,868. About 14.1% of families and 18.7% of the population were below the poverty line, including 26.2% of those under age 18 and 7.2% of those age 65 or over.
Communities
Census-designated places
- Burnt Ranch is a small, rural community on Highway 299 in the Downriver area of the county. It lies above Burnt Ranch Gorge, a famed whitewater stretch of the Trinity River. The area around it is steep and forested, but there are many agricultural flats in the community proper. There is a volunteer fire department and an elementary school, and there is possibly a store, although it may be closed. The name either comes from a settler's ranch that was burned by Indians or an Indian camp that was burned by settlers.
- Coffee Creek is a small resort community on Highway 3 north of Trinity Lake. It sits where Coffee Creek meets the Trinity River. The community takes most of its economy from tourism, since it serves as the base camp for a popular trailhead into the Trinity Alps Wilderness. There are several guest ranches and resorts surrounding the community as well. It is home to a store, a pizza place, a campground and RV park, a church, and a fire department, as well as many guest accommodations in the surrounding area.
- Douglas City is a medium-sized community centered on Highway 299 and the Trinity River south of Weaverville. The homes are clustered around the river, although there are many elsewhere. The businesses in the town include a store, a fire department, and an elementary school. There are resorts and guest accommodations scattered along the river throughout the area.
- Hayfork is the second largest community in the county. It lies in the Hayfork Valley, the largest agricultural region in the county, and derives a significant part of the economy from ranching. It used to be a mill town as well until the closing of the Sierra Pacific mill in the 1990s due to reduced timber stocks, consolidation, and environmental regulations. There are many businesses in the town, but some significant ones include the Hayfork Hotel, Ernie's Drugstore, Wiley's Supermarket, Hayfork Garage, and Nor'el'pom Natural Foods.
- Hyampom is the only CDP along the South Fork Trinity River. It lies in the Hyampom Valley, one of the largest agricultural areas in the county, and one of the main economic drivers is vineyards. It sits at the foot of South Fork Mountain at the confluence of Hayfork Creek and the South Fork. The South Fork is one of the largest undammed watersheds in California, and provides critical habitat for salmon and steelhead, although the populations were decimated by the 1964 floods and are still slowly recovering. The businesses in the valley are a bar, a bar and grill, a general store, a vineyard, a community center, and an elementary school that runs off and on.
- Junction City is the most populous and uppermost community in the Downriver area. It is marked by a large flat along the Trinity River covered in gravel from gold mining in the 19th century. It is located where Canyon Creek meets the river, and 15 miles up the creek lies the Canyon Creek Trailhead, the most popular trailhead into the Trinity Alps. The community's institutions consist of an elementary school, a store, a cafe, and a fire department.
- Lewiston is the third-largest community in the county. Prior to the Trinity River Project that built Trinity and Lewiston Dams, Lewiston was a small country crossroads, but during construction, a large community was built to house the workers and it stands to this day as the center of Trinity River recreation, including fly fishing, swimming, boating, rafting, and more.
- Mad River is one of two CDPs in the county not in the Trinity River watershed, the other being Ruth. It lies along the Mad River where Highway 36 crosses it. Unlike the north part of the county, Mad River is surrounded by rolling hills and mixed oak woodlands and Douglas fir forests. The businesses in the community include a burger joint, a church, a fire department, an elementary school, and a high school, one of three in the county.
- Post Mountain is on the north side of Highway 36, mainly in the valley of Post Creek. It is a new CDP delineated for the 2020 census.
- Ruth is the second CDP outside of the Trinity River basin, and the smallest in the county. It lies in the Ruth Valley south of Ruth Lake. The economy centers on Ruth Lake and the tourism attracted by it. Businesses include a church, a cafe, and many resorts and campgrounds.
- Salyer is on the western edge of Trinity County, along the Trinity River where it is joined by the South Fork. It is a new CDP delineated for the 2020 census.
- Trinity Center is the largest community on Trinity Lake, which brings in tourism and sustains the economy of the town. It used to lie at the bottom of a valley that was flooded by Trinity Lake in the 1950s, when it was moved to its current location along with several historic buildings. It is home to the busiest airport in the county.
- Trinity Village locally known as Hawkins Bar, is a community in the Downriver area. The only non-accommodation business is a bar and grill. Its economy is based on recreation on the Trinity River.
- Weaverville is the county seat and by far the largest community in the county. It is nestled along Weaver Creek in the Weaver Basin along Highway 299. It got its beginnings as a Gold Rush town, and there are still many historic buildings, including several of the oldest brick buildings in the state and the oldest county courthouse. There was a thriving Chinese community at the height of the Gold Rush, and a state park today houses the oldest Taoist temple in the state, the Joss House.
Unincorporated communities
Former cities/towns/communities
| City | Year
incorporated |
Year
dissolved |
Fate |
|---|---|---|---|
| Helena, California | 1851 | 1950s | Became private property |
| Canon City, California | 1851 | 1891 | Nothing remains of the former town but a historical marker. |
| Dedrick, California | 1890 | 1941 | Nothing remains of the former town but a historical marker. |
| Deadwood, Trinity County, California | 1881 | 1915 | Nothing remains of the former town. |
Education
K-12 school districts include:[42]
Unified:
- Klamath-Trinity Joint Unified School District
- Mountain Valley Unified School District
- Southern Trinity Joint Unified School District
- Trinity Alps Unified School District - Serves some areas for PK-12 and others only for grades 9-12
Elementary:
- Burnt Ranch Elementary School District
- Coffee Creek Elementary School District
- Douglas City Elementary School District
- Junction City Elementary School District
- Lewiston Elementary School District
- Trinity Center Elementary School District
Population ranking
The population ranking of the following table is based on the 2020 census of Trinity County.
† county seat
| Rank | City/Town/etc. | Municipal type | Population (2020 Census) |
|---|---|---|---|
| 1 | † Weaverville | CDP | 3,667 |
| 2 | Post Mountain | CDP | 3,032 |
| 3 | Hayfork | CDP | 2,324 |
| 4 | Lewiston | CDP | 1,222 |
| 5 | Douglas City | CDP | 868 |
| 6 | Junction City | CDP | 658 |
| 7 | Round Valley Reservation[43] (partially in Mendocino County) | AIAN | 454 |
| 8 | Salyer | CDP | 389 |
| 9 | Mad River | CDP | 361 |
| 10 | Trinity Village | CDP | 278 |
| 11 | Ruth | CDP | 254 |
| 12 | Burnt Ranch | CDP | 250 |
| 13 | Hyampom | CDP | 241 |
| 14 | Trinity Center | CDP | 198 |
| 15 | Coffee Creek | CDP | 152 |
See also
- Hiking trails in Trinity County
- National Register of Historic Places listings in Trinity County, California
- Trinity Lakes American Viticultural Area
- Willow Creek American Viticultural Area
Notes
- Percentage of registered voters with respect to total population. Percentages of party members with respect to registered voters follow.
- Only larceny-theft cases involving property over $400 in value are reported as property crimes.
- Other = Some other race + Two or more races
- Native American = Native Hawaiian or other Pacific Islander + American Indian or Alaska Native
References
- "Chronology". California State Association of Counties. Retrieved February 6, 2015.
- "Board of Supervisors | Trinity County".
- "Board of Supervisors | Trinity County".
- Mount Eddy
- "State & County QuickFacts". United States Census Bureau. Retrieved November 14, 2021.
- California State Association of Counties. "Cities Within Each County", ""California State Association of Counties"", Retrieved on 4 June 2018.
- "Find a County". National Association of Counties. Retrieved June 7, 2011.
- Tsnungwe Place Names, by Tsnungwe Tribal Elders, 1994
- "US Gazetteer files: 2010, 2000, and 1990". United States Census Bureau. February 12, 2011. Retrieved April 23, 2011.
- "Census profile: Census Tract 1.01, Trinity, CA". Census Reporter. Retrieved September 25, 2020.
- "Census Tract, Census Tract 1.02, Trinity County, California". www.usboundary.com. Retrieved September 25, 2020.
- "Trinity County | Place Rankings | Data Commons". datacommons.org. Retrieved September 25, 2020.
- "Shasta-Trinity National Forest - Home". Fs.usda.gov. August 22, 2018. Retrieved August 29, 2018.
- "Six Rivers National Forest - Home". Fs.usda.gov. August 24, 2018. Retrieved August 29, 2018.
- "Mendocino National Forest - Home". Fs.usda.gov. Retrieved August 29, 2018.
- "Shasta-Trinity National Forest - About the Forest". Fs.usda.gov. Retrieved August 29, 2018.
- "Shasta-Trinity National Forest - Trinity Alps Wilderness". Fs.usda.gov. Retrieved August 29, 2018.
- "Mendocino National Forest - Yolla Bolly-Middle Eel Wilderness". Fs.usda.gov. Retrieved August 29, 2018.
- "Weaverville - NWS Eureka NOAA Online Weather Data". Retrieved February 13, 2021.
- Leip, David. "Dave Leip's Atlas of U.S. Presidential Elections". uselectionatlas.org.
- "California's 2nd Congressional District - Representatives & District Map". Civic Impulse, LLC. Retrieved March 1, 2013.
- "Senators". State of California. Retrieved March 10, 2013.
- "Members Assembly". State of California. Retrieved March 2, 2013.
- "CA Prop 64 state and county votes". Los Angeles Times. Retrieved April 27, 2017.
- "Ballotpedia California Prop 64 (2016)". Ballotpedia. Ballotpedia.com. Retrieved April 27, 2017.
- U.S. Census Bureau. American Community Survey, 2011 American Community Survey 5-Year Estimates, Table B02001. U.S. Census website. Retrieved 2013-10-26.
- California Secretary of State. February 10, 2013 - Report of Registration Archived July 27, 2013, at the Wayback Machine. Retrieved 2013-10-31.
- Caltrans, State of California. "QuickMap". quickmap.dot.ca.gov.
- Office of the Attorney General, Department of Justice, State of California. Table 11: Crimes – 2009 Archived December 2, 2013, at the Wayback Machine. Retrieved 2013-11-14.
- U.S. Census Bureau. American Community Survey, 2011 American Community Survey 5-Year Estimates, Table B03003. U.S. Census website. Retrieved 2013-10-26.
- U.S. Census Bureau. American Community Survey, 2011 American Community Survey 5-Year Estimates, Table B19301. U.S. Census website. Retrieved 2013-10-21.
- U.S. Census Bureau. American Community Survey, 2011 American Community Survey 5-Year Estimates, Table B19013. U.S. Census website. Retrieved 2013-10-21.
- U.S. Census Bureau. American Community Survey, 2011 American Community Survey 5-Year Estimates, Table B19113. U.S. Census website. Retrieved 2013-10-21.
- U.S. Census Bureau. American Community Survey, 2011 American Community Survey 5-Year Estimates. U.S. Census website. Retrieved 2013-10-21.
- U.S. Census Bureau. American Community Survey, 2011 American Community Survey 5-Year Estimates, Table B01003. U.S. Census website. Retrieved 2013-10-21.
- "2010 Census P.L. 94-171 Summary File Data". United States Census Bureau.
- "U.S. Decennial Census". United States Census Bureau. Retrieved May 31, 2014.
- "Historical Census Browser". University of Virginia Library. Retrieved May 31, 2014.
- "Population of Counties by Decennial Census: 1900 to 1990". United States Census Bureau. Retrieved May 31, 2014.
- "Census 2000 PHC-T-4. Ranking Tables for Counties: 1990 and 2000" (PDF). United States Census Bureau. Retrieved May 31, 2014.
- "U.S. Census website". United States Census Bureau. Retrieved May 14, 2011.
- "2020 CENSUS - SCHOOL DISTRICT REFERENCE MAP: Trinity County, CA" (PDF). U.S. Census Bureau. Retrieved July 25, 2022. - Text list
- Staff, Website Services & Coordination. "U.S. Census Bureau 2020 Census". www.census.gov.
External links
- Official website

- VisitTrinity: Visitors Bureau
- Trinity County Chamber Of Commerce
- Tsnungwe Official Website
Places adjacent to Trinity County, California | ||||||||||||||||
|---|---|---|---|---|---|---|---|---|---|---|---|---|---|---|---|---|
| ||||||||||||||||
Municipalities and communities of Trinity County, California, United States | ||
|---|---|---|
County seat: Weaverville | ||
| CDPs | 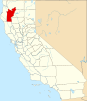 | |
| Unincorporated communities | ||
| Indian reservation |
| |
| Ghost towns | ||
| ||
State of California | |
|---|---|
Sacramento (capital) | |
| Topics |
|
| Regions |
|
| Metro regions |
|
| Counties |
|
| Most populous cities | |
Authority control | |
|---|---|
| General | |
| National libraries | |
| Other |
|
На других языках
[de] Trinity County (Kalifornien)
Das Trinity County[1] ist ein County im US-Bundesstaat Kalifornien. Der Verwaltungssitz (County Seat) ist Weaverville.- [en] Trinity County, California
[es] Condado de Trinity (California)
El condado de Trinity o condado de Trinidad[1][2] (en inglés: Trinity County), fundado en 1850, es uno de 58 condados del estado estadounidense de California. En el año 2000, el condado tenía una población de 13 022 habitantes y una densidad poblacional de 1.9 personas por km². La sede del condado es Weaverville.[3][ru] Тринити (округ, Калифорния)
Три́нити[1] — округ, расположенный в северо-западной части штата Калифорния, вдоль реки Тринити и горы Клемет. Окружной центр — город Уивервилл, с населением 3500 человек.Другой контент может иметь иную лицензию. Перед использованием материалов сайта WikiSort.org внимательно изучите правила лицензирования конкретных элементов наполнения сайта.
WikiSort.org - проект по пересортировке и дополнению контента Википедии