world.wikisort.org - USA
San Benito County (/ˌsæn bəˈniːtoʊ/ (![]() listen); San Benito, Spanish for "St. Benedict"), officially the County of San Benito, is a county located in the Coast Range Mountains of the U.S. state of California. As of the 2020 census, the population was 64,209.[3] The county seat is Hollister.[4]
listen); San Benito, Spanish for "St. Benedict"), officially the County of San Benito, is a county located in the Coast Range Mountains of the U.S. state of California. As of the 2020 census, the population was 64,209.[3] The county seat is Hollister.[4]
San Benito County | |
|---|---|
County | |
| County of San Benito | |
 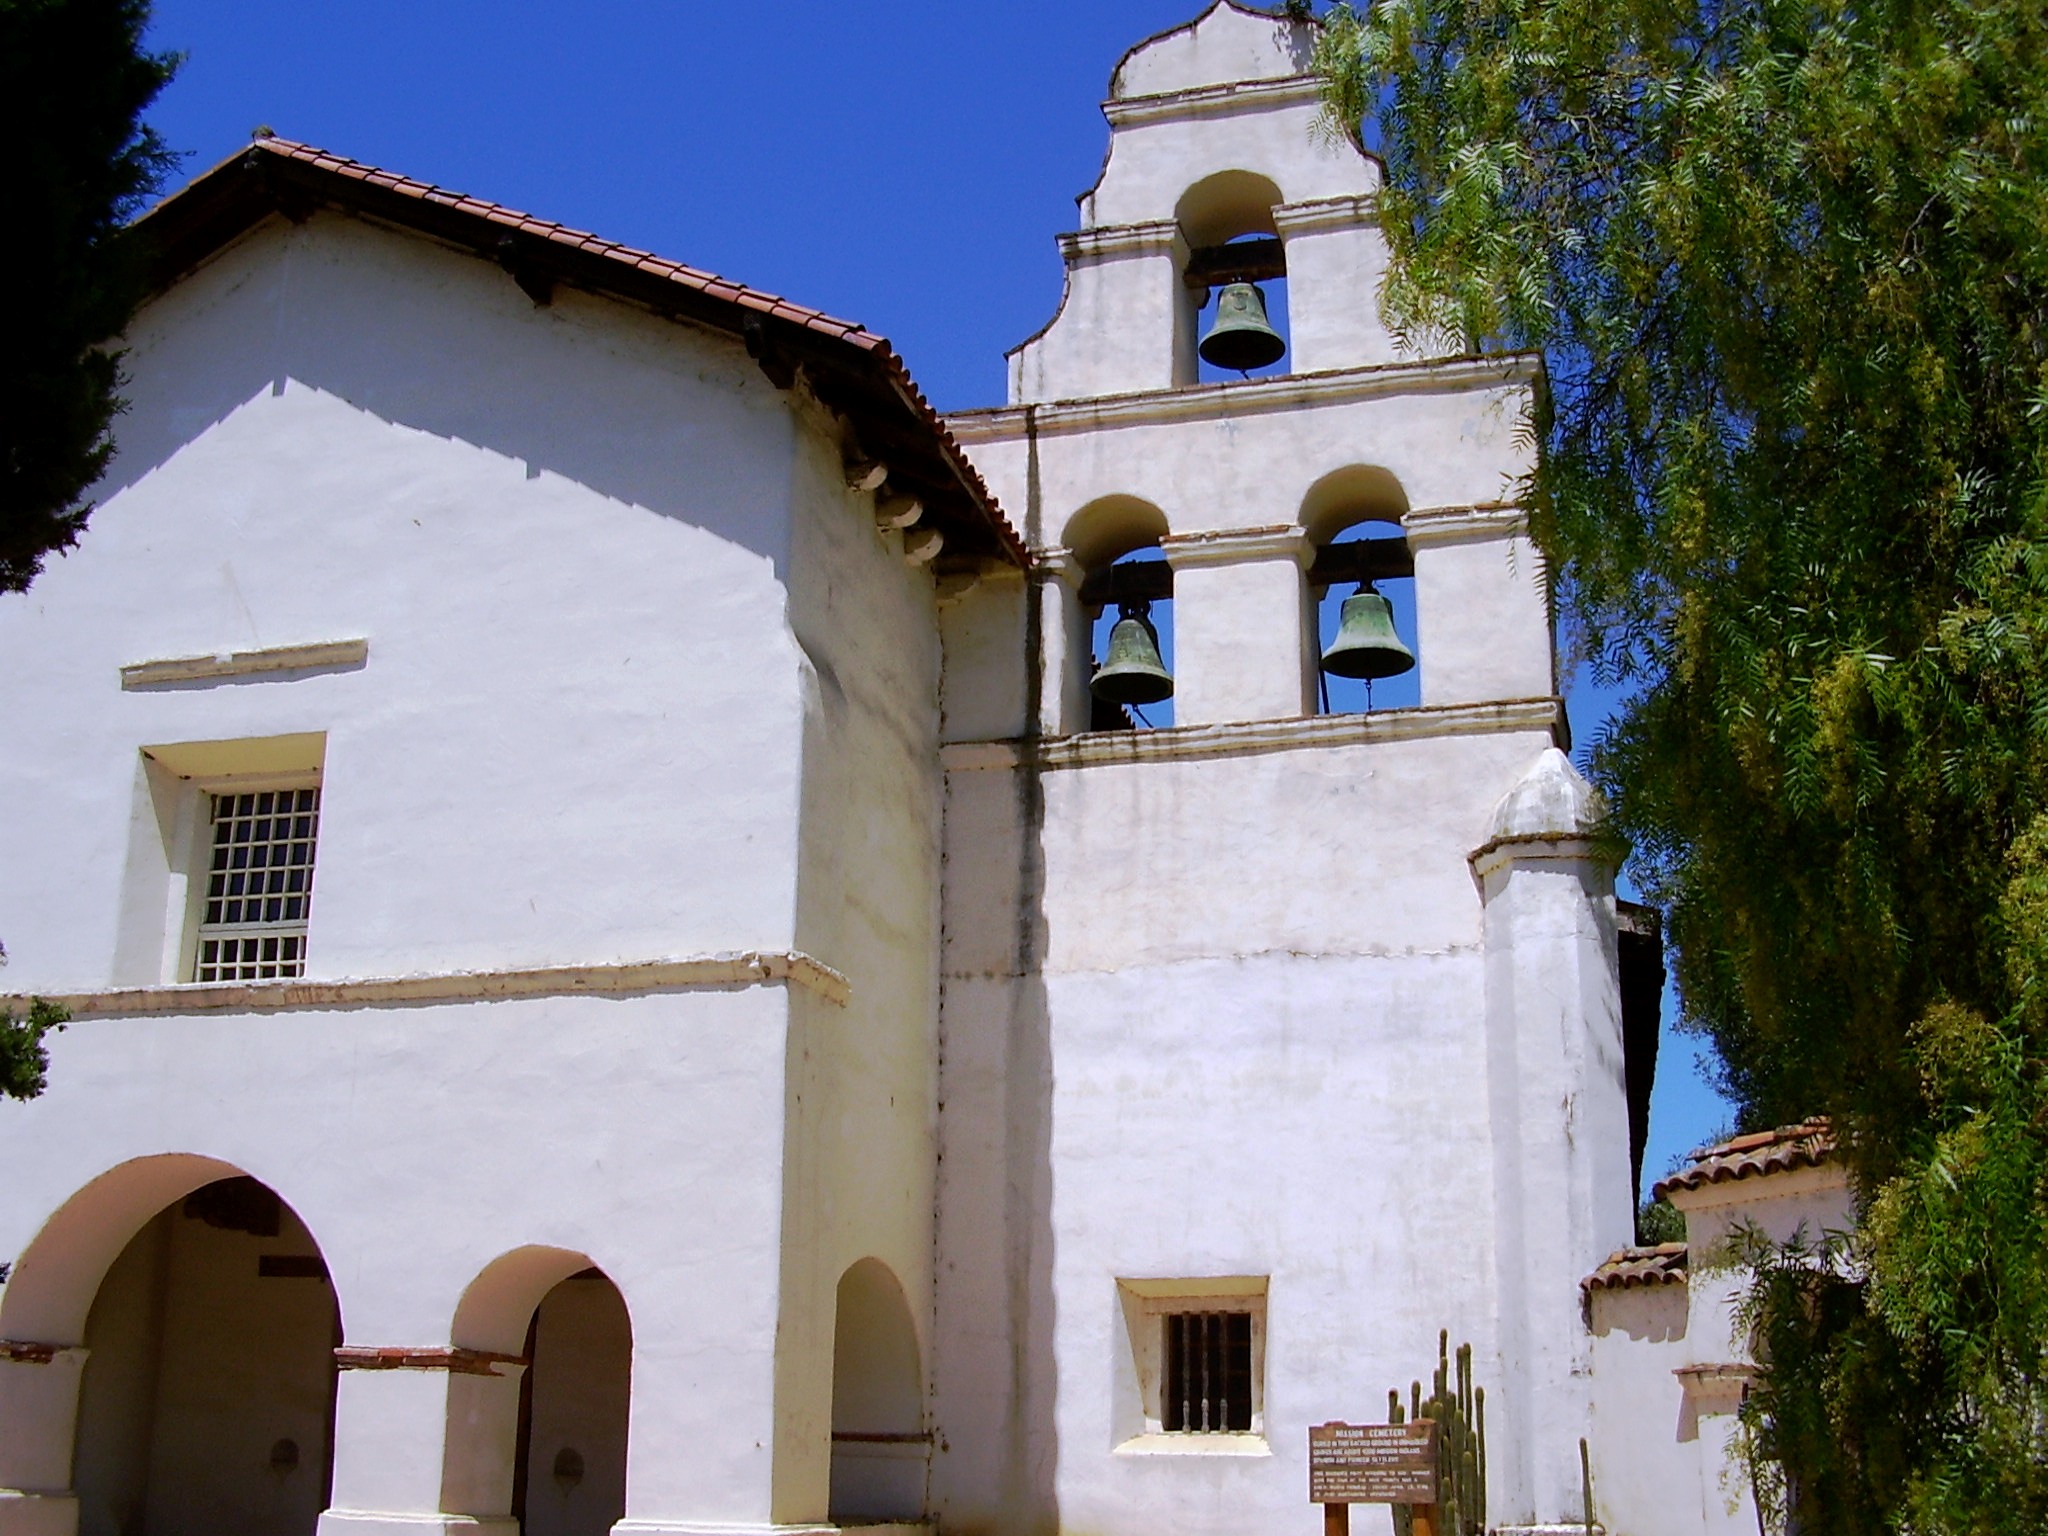  Images, from top down, left to right: San Benito County Courthouse, Mission San Juan Bautista, New Idria grounds | |
 Flag  Seal | |
 Interactive map of San Benito County | |
 Location in the state of California | |
| Country | United States |
| State | California
|
| Region | Central Coast |
| CSA | San Jose-San Francisco-Oakland |
| Metro | San Jose-Sunnyvale-Santa Clara |
| Incorporated | February 12, 1874 |
| Named for | San Benito River |
| County seat | Hollister |
| Largest city | Hollister |
| Government | |
| • Type | Council–CEO |
| • Body | Board of Supervisors |
| • Chair | Peter Hernandez |
| • Vice Chair | Kollin Kosmicki |
| • Board of Supervisors[1] | Supervisors
|
| • County Administrative Officer | Ray Espinosa |
| Area | |
| • Total | 1,390 sq mi (3,600 km2) |
| • Land | 1,389 sq mi (3,600 km2) |
| • Water | 1.8 sq mi (5 km2) |
| Highest elevation | 5,245 ft (1,599 m) |
| Population (2020) | |
| • Total | 64,209 |
| • Density | 46/sq mi (18/km2) |
| Time zone | UTC−8 (Pacific Time Zone) |
| • Summer (DST) | UTC−7 (Pacific Daylight Time) |
| Area code | 831 |
| FIPS code | 06-069 |
| GNIS feature ID | 277299 |
| Website | www |
San Benito County is included in the San Jose-Sunnyvale-Santa Clara, CA Metropolitan Statistical Area, which is also included in the San Jose-San Francisco-Oakland, CA Combined Statistical Area.
El Camino Real passes through the county and includes one mission in San Juan Bautista.
History
Before the arrival of the first European settlers, the San Benito County area was inhabited by the Mutsun sub-group of the Ohlone Native Americans. In 1772 Father Juan Crespí conducted a brief expedition into the area and named a small river which he found in honor of San Benito de Nursia (Saint Benedict), the patron saint of monasticism. The county was later named after the San Benito Valley, the valley surrounding this river. Thus it was from the Spanish version of the saint's name that the county eventually took its name.
In 1797 Spanish missionaries founded the first European settlement in the county as the San Juan Bautista mission. In 1848 the United States government gained control over what would soon become the state of California, which included the area now known as San Benito county. The town of New Idria was the next town to develop in the area and was founded ca. 1857. New Idria was centered around the New Idria Mercury Mine. When the mine played out fairly recently in 1972, New Idria was abandoned, and the town is now one of California's many ghost-towns.
The town of Hollister was next founded on November 19, 1868, by William Welles Hollister on the grounds of the former Mexican land-grant Rancho San Justo. In 1874 the California legislature formed San Benito county from a section of Monterey County while naming Hollister as the new county seat. Sections of Merced and Fresno Counties were also later reassigned to San Benito county in 1887 as a result of the growth of the New Idria community. Other towns in the county which were founded early in the county's history include Tres Pinos and Paicines.
Geography

According to the U.S. Census Bureau, the county has a total area of 1,390 square miles (3,600 km2), of which 1,389 square miles (3,600 km2) is land and 1.8 square miles (4.7 km2) is water (0.1%).[5]
Sharing a border with Santa Clara County, San Benito County lies adjacent to the San Francisco Bay Area and is sometimes considered a part of that region. Frequently, the county is associated with the Monterey Bay Area through governmental organizations such as the Association of Monterey Bay Area Governments as well as the Pajaro River, which flows from northern San Benito County into the Monterey Bay. However, the United States Census Bureau includes the county in the San Jose-Sunnyvale-Santa Clara MSA and the San Jose-San Francisco-Oakland CSA, which the Census uses as a statistical definition of the San Francisco Bay Area.
The county also borders Merced County and Fresno County on the east, which lead into California's San Joaquin Valley. It borders Santa Cruz County on the west and Monterey County on the southwest border.
The county is also the location of the Mount Harlan and San Benito American Viticultural Areas. The latter contains the Cienega Valley, Lime Kiln Valley, and Paicines AVAs.
Fauna and flora
There are a number of plant communities that occur in San Benito County including grasslands and chaparral; however, one of the more unusual is the Sargent cypress forest.[6] Benitoite, the official gem of the State of California, was discovered in San Benito County.[7] The county is also home to the San Benito evening primrose (Camissonia benitensis);[8] and Illacme plenipes, a millipede having more legs than any other millipede species, discovered in the county in 1926.[9] The plant genus Benitoa was named for San Benito County.[10]
National protected area
In October 2019, the Bureau of Land Management ended a five-year moratorium on leasing federal land in California to fossil fuel companies, opening 725,000 acres (1100 sq. miles; 29,000 ha) to drilling in San Benito County, Monterey County and Fresno County.[11]
Demographics
| Historical population | |||
|---|---|---|---|
| Census | Pop. | %± | |
| 1880 | 5,584 | — | |
| 1890 | 6,412 | 14.8% | |
| 1900 | 6,633 | 3.4% | |
| 1910 | 8,041 | 21.2% | |
| 1920 | 8,995 | 11.9% | |
| 1930 | 11,311 | 25.7% | |
| 1940 | 11,392 | 0.7% | |
| 1950 | 14,370 | 26.1% | |
| 1960 | 15,396 | 7.1% | |
| 1970 | 18,226 | 18.4% | |
| 1980 | 25,005 | 37.2% | |
| 1990 | 36,697 | 46.8% | |
| 2000 | 53,234 | 45.1% | |
| 2010 | 55,269 | 3.8% | |
| 2020 | 64,209 | 16.2% | |
| U.S. Decennial Census[12] 1790–1960[13] 1900–1990[14] 1990–2000[15] 2010[16] 2020[17] | |||
2020 census
| Race / Ethnicity | Pop 2010[16] | Pop 2020[17] | % 2010 | % 2020 |
|---|---|---|---|---|
| White alone (NH) | 21,154 | 19,785 | 38.27% | 30.81% |
| Black or African American alone (NH) | 355 | 479 | 0.64% | 0.75% |
| Native American or Alaska Native alone (NH) | 231 | 221 | 0.42% | 0.34% |
| Asian alone (NH) | 1,298 | 2,189 | 2.35% | 3.41% |
| Pacific Islander alone (NH) | 65 | 127 | 0.12% | 0.20% |
| Some Other Race alone (NH) | 67 | 332 | 0.12% | 0.52% |
| Mixed Race/Multi-Racial (NH) | 913 | 1,835 | 1.65% | 2.86% |
| Hispanic or Latino (any race) | 31,186 | 39,241 | 56.43% | 61.11% |
| Total | 55,269 | 64,209 | 100.00% | 100.00% |
Note: the US Census treats Hispanic/Latino as an ethnic category. This table excludes Latinos from the racial categories and assigns them to a separate category. Hispanics/Latinos can be of any race.
2011
| Population, race, and income | |||||
|---|---|---|---|---|---|
| Total population[18] | 54,873 | ||||
| White[18] | 41,820 | 76.2% | |||
| Black or African American[18] | 728 | 1.3% | |||
| American Indian or Alaska Native[18] | 693 | 1.3% | |||
| Asian[18] | 1,336 | 2.4% | |||
| Native Hawaiian or other Pacific Islander[18] | 0 | 0.0% | |||
| Some other race[18] | 7,903 | 14.4% | |||
| Two or more races[18] | 2,393 | 4.4% | |||
| Hispanic or Latino (of any race)[19] | 30,497 | 55.6% | |||
| Per capita income[20] | $26,300 | ||||
| Median household income[21] | $65,570 | ||||
| Median family income[22] | $73,150 | ||||
Places by population, race, and income
| Place | Type[23] | Population[18] | White[18] | Other[18] [note 1] |
Asian[18] | Black or African American[18] |
Native American[18] [note 2] |
Hispanic or Latino (of any race)[19] |
|---|---|---|---|---|---|---|---|---|
| Aromas ‡ | CDP | 1,175 | 77.9% | 19.1% | 0.0% | 0.0% | 3.0% | 18.6% |
| Hollister | City | 34,733 | 71.2% | 23.2% | 2.7% | 1.6% | 1.4% | 65.7% |
| Ridgemark | CDP | 3,370 | 86.3% | 7.9% | 2.8% | 2.2% | 0.8% | 21.5% |
| San Juan Bautista | City | 1,619 | 83.8% | 6.4% | 4.1% | 4.4% | 1.4% | 37.6% |
| Tres Pinos | CDP | 313 | 97.8% | 2.2% | 0.0% | 0.0% | 0.0% | 32.6% |
| ‡ Data for San Benito County area of this CDP | ||||||||
| Place | Type[23] | Population[24] | Per capita income[20] | Median household income[21] | Median family income[22] |
|---|---|---|---|---|---|
| Aromas ‡ | CDP | 1,175 | $49,556 | $121,964 | $163,906 |
| Hollister | City | 34,733 | $22,433 | $62,570 | $64,123 |
| Ridgemark | CDP | 3,370 | $38,800 | $90,833 | $101,776 |
| San Juan Bautista | City | 1,619 | $24,527 | $56,897 | $65,526 |
| Tres Pinos | CDP | 313 | $41,294 | $83,500 | $88,929 |
| ‡ Data for San Benito County area of this CDP | |||||
2010
The 2010 United States Census reported that San Benito County had a population of 55,269. The racial makeup of San Benito County was 35,181 (63.7%) White, 483 (0.9%) African American, 895 (1.6%) Native American, 1,443 (2.6%) Asian, 94 (0.2%) Pacific Islander, 14,471 (26.2%) from other races, and 2,702 (4.9%) from two or more races. Hispanic or Latino of any race were 31,186 persons (56.4%).[25]
| Population reported at 2010 United States Census | |||||||||
|---|---|---|---|---|---|---|---|---|---|
The County | Total Population | White | African American | Native American | Asian | Pacific Islander | other races | two or more races | Hispanic or Latino (of any race) |
| San Benito County | 55,269 | 35,181 | 483 | 895 | 1443 | 94 | 14,471 | 2,702 | 31,186 |
Incorporated cities | Total Population | White | African American | Native American | Asian | Pacific Islander | other races | two or more races | Hispanic or Latino (of any race) |
| Hollister | 34,928 | 20,761 | 341 | 617 | 929 | 63 | 10,437 | 1,780 | 22,965 |
| San Juan Bautista | 1,862 | 1,125 | 12 | 58 | 52 | 2 | 494 | 119 | 907 |
Census-designated places | Total Population | White | African American | Native American | Asian | Pacific Islander | other races | two or more races | Hispanic or Latino (of any race) |
| Aromas ‡ | 1,292 | 961 | 9 | 13 | 14 | 3 | 207 | 85 | 413 |
| Ridgemark | 3,016 | 2,520 | 23 | 14 | 105 | 3 | 248 | 103 | 623 |
| Tres Pinos | 476 | 390 | 3 | 8 | 6 | 0 | 57 | 12 | 112 |
Other unincorporated areas | Total Population | White | African American | Native American | Asian | Pacific Islander | other races | two or more races | Hispanic or Latino (of any race) |
| All others not CDPs (combined) | 13,695 | 9,424 | 95 | 185 | 337 | 23 | 3,028 | 603 | 6,166 |
| ‡ Note: these numbers reflect only the portion of this CDP in San Benito County | |||||||||
2000
As of the census[26] of 2000, there were 53,234 people, 15,885 households, and 12,898 families residing in the county. The population density was 38 people per square mile (15/km2). There were 16,499 housing units at an average density of 12 per square mile (5/km2). The racial makeup of the county in 2010 was 38.3% non-Hispanic White, 0.6% non-Hispanic Black or African American, 0.4% Native American, 2.3% Asian, 0.1% Pacific Islander, 0.1% from other races, and 1.7% from two or more races. 56.4% of the population were Hispanic or Latino of any race. 7.6% were of German, 6.3% Irish and 5.4% Italian ancestry according to Census 2000. 62.8% spoke English and 35.3% Spanish as their first language. As of the 2010 United States Census, San Benito County was the only county in the greater San Francisco Bay Area with a Hispanic majority and where a minority race formed the largest race composition.
There were 15,885 households, out of which 46.3% had children under the age of 18 living with them, 65.7% were married couples living together, 10.5% had a female householder with no husband present, and 18.8% were non-families. 14.1% of all households were made up of individuals, and 5.4% had someone living alone who was 65 years of age or older. The average household size was 3.32 and the average family size was 3.64.
In the county, the population was spread out, with 32.2% under the age of 18, 8.8% from 18 to 24, 31.5% from 25 to 44, 19.3% from 45 to 64, and 8.1% who were 65 years of age or older. The median age was 31 years. For every 100 females there were 102.5 males. For every 100 females age 18 and over, there were 99.6 males.
The median income for a household in the county was $57,469, and the median income for a family was $60,665. Males had a median income of $44,158 versus $29,524 for females. The per capita income for the county was $20,932. About 6.7% of families and 10.0% of the population were below the poverty line, including 11.4% of those under age 18 and 8.5% of those age 65 or over.
Government and policing

County government is overseen by a five-member elected Board of Supervisors, who serve four-year terms of office. Other elected county leaders include:
- Assessor
- Clerk-Auditor-Recorder
- District Attorney
- Sheriff-Coroner
- Treasurer-Tax Collector-Public Administrator
San Benito County had the last elected Marshal in California until 2010 when the office closed. Shasta and Trinity Counties still have appointed Marshals.
State and federal representation
In the United States House of Representatives, San Benito County is part of California's 20th congressional district, represented by Democrat Jimmy Panetta.[27]
In the California State Legislature, San Benito County is in the 12th Senate District, represented by Democrat Anna Caballero, and in the 30th Assembly District, represented by Democrat Robert Rivas.[28]
Policing
The San Benito County Sheriff provides court protection, jail management, and coroner service for the entire county. It provides patrol and detective services for the unincorporated areas of the county. Hollister (the County Seat) has a municipal police department.
Politics
San Benito is a Democratic-leaning county in Presidential and congressional elections. The last Republican to win a majority in the county was George H. W. Bush in 1988. San Benito is also considered a bellwether county for California in presidential elections; since 1904 the solitary candidate to carry the state without winning this county has been Harry S. Truman in 1948.[29] Before 1904, however, it was a solidly Democratic county whilst the state leaned Republican, voting Democratic in every election from its creation in 1876 up to and including 1900, although California only voted Democratic in 1880 and 1892.[29]
| Year | Republican | Democratic | Third party | |||
|---|---|---|---|---|---|---|
| No. | % | No. | % | No. | % | |
| 2020 | 10,590 | 36.73% | 17,628 | 61.14% | 612 | 2.12% |
| 2016 | 7,841 | 35.44% | 12,521 | 56.60% | 1,760 | 7.96% |
| 2012 | 7,343 | 38.48% | 11,276 | 59.10% | 462 | 2.42% |
| 2008 | 7,425 | 37.52% | 11,917 | 60.22% | 446 | 2.25% |
| 2004 | 8,698 | 46.45% | 9,851 | 52.61% | 176 | 0.94% |
| 2000 | 7,015 | 41.68% | 9,131 | 54.25% | 685 | 4.07% |
| 1996 | 5,384 | 38.72% | 7,030 | 50.55% | 1,492 | 10.73% |
| 1992 | 4,112 | 32.28% | 5,354 | 42.03% | 3,273 | 25.69% |
| 1988 | 5,578 | 54.11% | 4,559 | 44.23% | 171 | 1.66% |
| 1984 | 5,695 | 60.71% | 3,554 | 37.89% | 131 | 1.40% |
| 1980 | 4,054 | 53.33% | 2,749 | 36.16% | 799 | 10.51% |
| 1976 | 3,398 | 50.87% | 3,122 | 46.74% | 160 | 2.40% |
| 1972 | 3,961 | 57.56% | 2,582 | 37.52% | 338 | 4.91% |
| 1968 | 2,961 | 47.54% | 2,809 | 45.10% | 459 | 7.37% |
| 1964 | 2,444 | 39.19% | 3,779 | 60.59% | 14 | 0.22% |
| 1960 | 3,056 | 51.40% | 2,876 | 48.38% | 13 | 0.22% |
| 1956 | 3,252 | 59.53% | 2,201 | 40.29% | 10 | 0.18% |
| 1952 | 3,733 | 65.23% | 1,968 | 34.39% | 22 | 0.38% |
| 1948 | 2,775 | 55.64% | 2,096 | 42.03% | 116 | 2.33% |
| 1944 | 2,253 | 52.80% | 1,998 | 46.82% | 16 | 0.37% |
| 1940 | 2,407 | 49.29% | 2,441 | 49.99% | 35 | 0.72% |
| 1936 | 1,515 | 36.58% | 2,565 | 61.93% | 62 | 1.50% |
| 1932 | 1,269 | 33.89% | 2,283 | 60.98% | 192 | 5.13% |
| 1928 | 1,971 | 58.87% | 1,366 | 40.80% | 11 | 0.33% |
| 1924 | 1,443 | 53.54% | 361 | 13.40% | 891 | 33.06% |
| 1920 | 1,965 | 65.00% | 900 | 29.77% | 158 | 5.23% |
| 1916 | 1,440 | 44.19% | 1,688 | 51.80% | 131 | 4.02% |
| 1912 | 13 | 0.51% | 1,253 | 48.70% | 1,307 | 50.80% |
| 1908 | 937 | 53.57% | 684 | 39.11% | 128 | 7.32% |
| 1904 | 888 | 54.51% | 645 | 39.59% | 96 | 5.89% |
| 1900 | 724 | 46.71% | 786 | 50.71% | 40 | 2.58% |
| 1896 | 729 | 42.48% | 956 | 55.71% | 31 | 1.81% |
| 1892 | 616 | 36.97% | 759 | 45.56% | 291 | 17.47% |
As of May, 2010, the California Secretary of State reports that San Benito County has 34,562 eligible voters.[citation needed] Of those 24,736 (71.57%) are registered voters. Of those, 11,959 (48.35%) are registered Democratic, 7,477 (30.23%) are registered Republican, 565 (2.28%)are registered American Independent, and 116 (0.47%) are Green Party. The two incorporated municipalities of Hollister and San Juan Bautista have Democratic majorities on their voter rolls, whereas the unincorporated areas of San Benito County have a small Republican plurality in voter registration.
Voter registration
| Population and registered voters | ||
|---|---|---|
| Total population[18] | 54,873 | |
| Registered voters[31][note 3] | 26,694 | 48.6% |
| Democratic[31] | 12,643 | 47.4% |
| Republican[31] | 7,847 | 29.4% |
| Democratic–Republican spread[31] | +4,796 | +18.0% |
| Independent[31] | 679 | 2.5% |
| Green[31] | 144 | 0.5% |
| Libertarian[31] | 143 | 0.5% |
| Peace and Freedom[31] | 73 | 0.3% |
| Americans Elect[31] | 1 | 0.0% |
| Other[31] | 46 | 0.2% |
| No party preference[31] | 5,118 | 19.2% |
Cities by population and voter registration
| Cities by population and voter registration | |||||||
|---|---|---|---|---|---|---|---|
| City | Population[18] | Registered voters[31] [note 3] |
Democratic[31] | Republican[31] | D–R spread[31] | Other[31] | No party preference[31] |
| Hollister | 34,733 | 43.8% | 53.6% | 23.2% | +30.4% | 6.3% | 19.4% |
| San Juan Bautista | 1,619 | 59.8% | 50.8% | 23.0% | +27.8% | 9.8% | 20.4% |
Crime
The following table includes the number of incidents reported and the rate per 1,000 persons for each type of offense.
| Population and crime rates | ||
|---|---|---|
| Population[18] | 54,873 | |
| Violent crime[32] | 246 | 4.48 |
| Homicide[32] | 0 | 0.00 |
| Forcible rape[32] | 9 | 0.16 |
| Robbery[32] | 54 | 0.98 |
| Aggravated assault[32] | 183 | 3.33 |
| Property crime[32] | 748 | 13.63 |
| Burglary[32] | 445 | 8.11 |
| Larceny-theft[32][33] | 535 | 9.75 |
| Motor vehicle theft[32] | 129 | 2.35 |
| Arson[32] | 8 | 0.15 |
Cities by population and crime ratable
| Cities by population and crime rates | ||||||||
|---|---|---|---|---|---|---|---|---|
| City | Population[34] | Violent crimes[34] | Violent crime rate per 1,000 persons |
Property crimes[34] | Property crime rate per 1,000 persons | |||
| Hollister | 35,766 | 162 | 4.53 | 724 | 20.24 | |||
Economy
The economy is statistically included in metro San Jose, though the dominant activity is agriculture. Agritourism is growing as the county has destination wineries, organic farms and quaint inns with views of cattle grazing. With concerns about how oil and gas operations could impact this sector of the economy and agriculture in general, the county voters approved a measure in 2014 that bans well stimulation techniques such as fracking, acidizing and steam injection, along with conventional drilling in some areas. In the 1950s, the oil drilling industry had many wells and the county is over the Monterey Shale formation but there is very little activity now.[35]
Top employers
According to the San Benito County Chamber of Commerce,[36] the top employers in the county are:
| # | Employer | # of Employees |
|---|---|---|
| 1 | Earthbound Farm | 1,000+ |
| 2 | Hazel Hawkins Memorial Hospital | 250–499 |
| 3 | Milgard | 250–499 |
| 4 | Pacific Scientific | 250–499 |
| 5 | San Benito High School | 250–499 |
| 6 | True Leaf Farms | 250–499 |
| 7 | Nob Hill Foods | 100–249 |
| 8 | Target | 100–249 |
| 9 | Trical | 100–249 |
| 10 | Corbin | 100–249 |
| 11 | West Marine | 100–249 |
| 12 | Ridgemark | 100–249 |
| 13 | Casa de Fruta | 100–249 |
| 14 | Cedar Valley Shingle Systems | 100–249 |
| 15 | Tanimura & Antle | 100–249 |
| 16 | 100–249 | |
| 17 | LifeSparc | 100–249 |
| 18 | MC Electronics | 100–249 |
| 19 | San Benito Foods | 100–249 |
Media
San Benito County receives media in Monterey County, including the major Monterey County TV and radio stations.
The county also has several media outlets that serve the local community:
Television
CMAP TV - Community Media Access Partnership, based in Gilroy, operates Channels 17, 18, 19 & 20 on Charter/Spectrum Cable as well as streaming online, offering public access and educational programming to Gilroy and San Benito County as well as offering live civic meetings, including county government.
Radio
- KMPG, at 1520 AM daytime, plays regional Mexican music;
- KQKE, at 97.5 FM, "The Quake" San Benito County Community Radio provides a low power signal.
- KHRI, at 90.7 FM, is an affiliate of Air 1 playing contemporary Christian music;
- KXSM, at 93.1 FM, broadcasts a regional Mexican format.
- K206BQ, at 89.1 FM, rebroadcasts KLVM.
- K265DG, at 100.9 FM, rebroadcasts KPRC-FM.
- The Hollister Free Lance, founded in 1873, is published weekly on Thursdays. The Freelance is now owned by New SV Media, Inc.and its main office is in Gilroy. New SV Media owns Good Times, Metro Silicon Valley, Pajaroan, Gilroy Dispatch, SantaCruz.com, King City Rustler and California Wheelin'.
- Mission Village Voice is a monthly paper based in San Juan Bautista. It is oriented toward arts, culture and community-wide events.
Online
- BenitoLink is a nonprofit news website covering San Benito County, run by local and regional residents.
- San Benito Live is a local news website, primarily focused on culture-related media.
Transportation
Major highways
 U.S. Route 101 to San Francisco
 State Route 25
 State Route 129 to Santa Cruz
 State Route 146
 State Route 156
Public transportation
San Benito County Express provides fixed route service in the city of Hollister, and intercity service in the northern portion of the county. Service operates as far north as Gilroy, in Santa Clara County.
Airports

Hollister Municipal Airport is a general aviation airport located just north of Hollister.
Communities
Cities
- Hollister (county seat)
- San Juan Bautista
Census-designated places
Unincorporated communities
- Bitterwater
- Dunneville
- Hudner
- Paicines
- Panoche
- River Oaks
- San Benito
- Tres Pinos
Ghost town
- New Idria
Population ranking
The population ranking of the following table is based on the 2010 census of San Benito County.[38]
† county seat
| Rank | City/Town/etc. | Municipal type | Population (2010 Census) |
|---|---|---|---|
| 1 | † Hollister | City | 34,928 |
| 2 | Ridgemark | CDP | 3,016 |
| 3 | Aromas (partially in Monterey County) | CDP | 2,650 |
| 4 | San Juan Bautista | City | 1,862 |
| 5 | Tres Pinos | CDP | 476 |
See also
- List of museums in the California Central Coast
- National Register of Historic Places listings in San Benito County, California
- George H. Moore, San Benito County district attorney
Notes
- Other = Some other race + Two or more races
- Native American = Native Hawaiian or other Pacific Islander + American Indian or Alaska Native
- Percentage of registered voters with respect to total population. Percentages of party members with respect to registered voters follow.
References
- "County of San Benito Board of Supervisors (BOS) | San Benito County, CA".
- "San Benito Mountain". Peakbagger.com. Retrieved April 11, 2015.
- "San Benito County, California". United States Census Bureau. Retrieved January 30, 2022.
- "Find a County". National Association of Counties. Retrieved June 7, 2011.
- "2010 Census Gazetteer Files". United States Census Bureau. August 22, 2012. Retrieved October 4, 2015.
- C. Michael Hogan. 2010. Leather Oak, Quercus durata. Encyclopedia of Earth. National Council for Science and Environment. Wash.DC
- Louderback, George Davis. 1907. "Benitoite, A New California Gem Mineral." Bulletin of the Department of Geology, Vol. 5, No. 9. University of California Publications.
- Hickman, James C. (editor). 1993. The Jepson Manual: Higher Plants of California. University of California Press.
- Sara Goudarzi (June 7, 2006). "666-Legged Creature Rediscovered". LiveScience.
- Flora of North America: Benitoa
- Jake Johnson (October 5, 2019), "Merging 'Loyalty to the Oil Industry' and 'Grudge Against California,' Trump Opens 725,000 Acres to Fossil Fuel Drilling", Common Dreams, retrieved October 5, 2019
- "Census of Population and Housing from 1790-2000". US Census Bureau. Retrieved January 24, 2022.
- "Historical Census Browser". University of Virginia Library. Retrieved October 4, 2015.
- Forstall, Richard L., ed. (March 27, 1995). "Population of Counties by Decennial Census: 1900 to 1990". United States Census Bureau. Retrieved October 4, 2015.
- "Census 2000 PHC-T-4. Ranking Tables for Counties: 1990 and 2000" (PDF). United States Census Bureau. April 2, 2001. Retrieved October 4, 2015.
- "P2 HISPANIC OR LATINO, AND NOT HISPANIC OR LATINO BY RACE - 2010: DEC Redistricting Data (PL 94-171) - San Benito County, California". United States Census Bureau.
- "P2 HISPANIC OR LATINO, AND NOT HISPANIC OR LATINO BY RACE - 2020: DEC Redistricting Data (PL 94-171) - San Benito County, California". United States Census Bureau.
- U.S. Census Bureau. American Community Survey, 2011 American Community Survey 5-Year Estimates, Table B02001. U.S. Census website. Retrieved 2013-10-26.
- U.S. Census Bureau. American Community Survey, 2011 American Community Survey 5-Year Estimates, Table B03003. U.S. Census website. Retrieved 2013-10-26.
- U.S. Census Bureau. American Community Survey, 2011 American Community Survey 5-Year Estimates, Table B19301. U.S. Census website. Retrieved 2013-10-21.
- U.S. Census Bureau. American Community Survey, 2011 American Community Survey 5-Year Estimates, Table B19013. U.S. Census website. Retrieved 2013-10-21.
- U.S. Census Bureau. American Community Survey, 2011 American Community Survey 5-Year Estimates, Table B19113. U.S. Census website. Retrieved 2013-10-21.
- U.S. Census Bureau. American Community Survey, 2011 American Community Survey 5-Year Estimates. U.S. Census website. Retrieved 2013-10-21.
- U.S. Census Bureau. American Community Survey, 2011 American Community Survey 5-Year Estimates, Table B01003. U.S. Census website. Retrieved 2013-10-21.
- "2010 Census P.L. 94-171 Summary File Data". United States Census Bureau.
- "U.S. Census website". United States Census Bureau. Retrieved May 14, 2011.
- "California's 20th Congressional District - Representatives & District Map". Civic Impulse, LLC. Retrieved September 24, 2014.
- "Statewide Database". UC Regents. Retrieved November 30, 2014.
- Menendez, Albert J.; The Geography of Presidential Elections in the United States, 1868-2004, pp. 152-155 ISBN 0786422173
- Leip, David. "Dave Leip's Atlas of U.S. Presidential Elections". uselectionatlas.org. Retrieved September 1, 2018.
- California Secretary of State. February 10, 2013 - Report of Registration Archived July 27, 2013, at the Wayback Machine. Retrieved 2013-10-31.
- Office of the Attorney General, Department of Justice, State of California. Table 11: Crimes – 2009 Archived December 2, 2013, at the Wayback Machine. Retrieved 2013-11-14.
- Only larceny-theft cases involving property over $400 in value are reported as property crimes.
- United States Department of Justice, Federal Bureau of Investigation. Crime in the United States, 2012, Table 8 (California). Retrieved 2013-11-14.
- Cart, Julie (November 29, 2014). "Election win puts rural San Benito County on anti-fracking map". Los Angeles Times.
- "San Benito County Chamber of Commerce-Economic Development". sanbenitocountychamber.com.
- Color Spot Buys El Modeno Assets. Greenhouse Grower.
- CNMP, US Census Bureau. "This site has been redesigned and relocated. - U.S. Census Bureau". www.census.gov.
External links
Places adjacent to San Benito County, California | ||||||||||||||||
|---|---|---|---|---|---|---|---|---|---|---|---|---|---|---|---|---|
| ||||||||||||||||
Municipalities and communities of San Benito County, California, United States | ||
|---|---|---|
County seat: Hollister | ||
| Cities |  | |
| CDPs | ||
| Unincorporated communities |
| |
| Ghost town |
| |
| Footnotes | ‡This populated place also has portions in an adjacent county or counties | |
| ||
Sacramento (capital) | |
| Topics |
|
| Regions |
|
| Metro regions |
|
| Counties |
|
| Most populous cities | |
Authority control | |
|---|---|
| General | |
| National libraries | |
| Other | |
На других языках
[de] San Benito County
Das San Benito County[1] ist ein County im Bundesstaat Kalifornien der Vereinigten Staaten. Der Sitz der Countyverwaltung (County Seat) ist in Hollister.- [en] San Benito County, California
[es] Condado de San Benito
El condado de San Benito (en inglés: San Benito County) es uno de los 58 condados del estado de California, en Estados Unidos. La sede del condado y mayor ciudad es Hollister. El condado posee un área de 3602 km² (de los cuales 4 km² están cubiertos de agua), una población de 53 234 habitantes, y la densidad de población es de 15 hab./km² (según el censo nacional de 2000). Este condado fue fundado en 1874.[ru] Сан-Бенито (округ)
Сан-Бени́то[1] (англ. San Benito) — округ, расположенный в штате Калифорния. Население округа, по данным переписи 2000 года, составляет 53 234 человека.[2] Окружной центр — город Холлистер.Другой контент может иметь иную лицензию. Перед использованием материалов сайта WikiSort.org внимательно изучите правила лицензирования конкретных элементов наполнения сайта.
WikiSort.org - проект по пересортировке и дополнению контента Википедии