world.wikisort.org - USA
East Carroll Parish (French: Paroisse de Carroll Est) is a parish located in the Mississippi Delta in northeastern Louisiana. As of the 2010 census, the population was 7,759.[1] The parish seat is Lake Providence.[2] An area of cotton plantations in the antebellum era, the parish in the early 21st century has about 74% of its land devoted to agriculture.
East Carroll Parish | |
|---|---|
Parish | |
 East Carroll Parish Courthouse in Lake Providence | |
 Location within the U.S. state of Louisiana | |
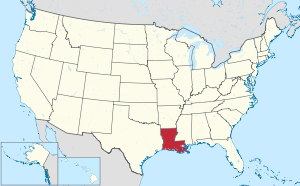 Louisiana's location within the U.S. | |
| Coordinates: 32°44′N 91°14′W | |
| Country | |
| State | |
| Founded | March 26, 1877 |
| Named for | Charles Carroll of Carrollton |
| Seat | Lake Providence |
| Largest town | Lake Providence |
| Area | |
| • Total | 442 sq mi (1,140 km2) |
| • Land | 421 sq mi (1,090 km2) |
| • Water | 22 sq mi (60 km2) 4.9% |
| Population (2010) | |
| • Total | 7,759 |
| • Estimate (2018) | 7,037 |
| • Density | 18/sq mi (6.8/km2) |
| Time zone | UTC−6 (Central) |
| • Summer (DST) | UTC−5 (CDT) |
| Congressional district | 5th |
History
This area is part of the delta along the western edge of the Mississippi River, long subject to the seasonal flooding that gave the area fertile soils. It was occupied by indigenous peoples for thousands of years. European explorers encountered the historic tribes of the Caddo and Choctaw in this area, as well as the Natchez on the east side of the Mississippi River.
In the 1830s, the United States forced out most of the people of the Five Civilized Tribes from the Southeast to west of the Mississippi River in Indian Territory to make way for development by European Americans. Areas along the river were cleared and developed for cultivation of cotton, the major commodity crop in the Deep South before the Civil War. The cotton was cultivated and processed on plantations by large groups of enslaved African-American laborers.
Prior to 1814, all of the territory covered by the current East Carroll Parish was part of the now defunct Warren Parish. The original Carroll Parish, before it was divided into "East" and "West" segments after Reconstruction, was named for Charles Carroll of Carrollton,[3] Maryland, the only Roman Catholic signer of the Declaration of Independence. This and other nearby parishes along the Mississippi River were called the Natchez District, referring to the major port on the Mississippi side of the river. Both areas were developed for cotton plantations.
Given the dependence of plantation agriculture on enslaved workers, the population of this area was majority African American well before the American Civil War. Carroll Parish had 11,000 slaves in 1860, more than three times the white population of the total parish.[4] Most were located on the plantations in the floodplain along the Mississippi River. During the war, many slaves joined Union lines and served in the United States Colored Troops; Louisiana had more former slaves enlisted in the USCT than six other southern states combined.[5]
Carroll Parish covered a large area and the parish was split by the state legislature in 1877, following the Reconstruction era.[6] West Carroll Parish, with territory west of the Bayou Macon, was majority-white and voted Democratic.
After the war, this area continued to be dominated by agriculture and was largely rural. Numerous black Union veterans settled in East Carroll Parish and some owned their own land, especially in an area called Soldiers' Rest, site of a former Union camp. They developed an independent community. With blacks outnumbering whites in Carroll Parish by a seven-to-one margin, and with combat experience, they resisted efforts in the 1870s to suppress their population. Voters in the larger Carroll Parrish elected blacks to the positions of sheriff, state representative, clerk of the court, and several justices of the peace, and hired black constables, giving blacks a voice at the local level.[7]
But white conservative Democrats formed groups noted as Bulldozers, conducting violence against black voters, teachers, and supporters to suppress their activities.[8] White conservatives succeeded in regaining control of the state legislature by the end of Reconstruction. By creating West Carroll Parish in 1877, they had an additional jurisdiction dominated by white Democrats.
Two decades later, at the end of the 19th century, the state legislature passed a new constitution in 1898 that raised barriers to voter registration, with rules applied against African Americans. They were effectively disenfranchised well into the 1960s. The legislature passed segregation and Jim Crow laws of increasing severity into the early 20th century.[9]
In 1907 U.S. President Theodore Roosevelt came to East Carroll Parish near Lake Providence for a black bear hunt. When a particular bear managed to elude the hunters, the president's camp was moved to Bear Lake in Madison Parish near Tallulah. The 21-year-old Arthur Spencer of Richland Parish took a photograph of Roosevelt with the heavily armed hunting party. Among the hunters was John M. Parker, future governor of Louisiana and the vice-presidential choice of the Bull Moose Party ticket in the 1912 presidential election.[10]
Law and government
From 1922 to 1962, African Americans were prohibited from registering to vote in East Carroll Parish through a combination of laws and practices such as literacy tests.[11] The first African Americans were registered after the ruling in U.S. v. Manning (1962) found that the prohibition of voter registration for Black people violated the Civil Rights Act of 1960. It was not, however, until the Voting Rights Act of 1965 became law that large numbers of African Americans became registered to vote, and they continued to vote at high levels. They have tended to support Democratic Party candidates, as the national party had supported the civil rights movement. As East Carroll Parish is majority black, its voters still favor Democratic Party candidates. Most conservative whites have shifted since the late 20th century to the Republican Party, which candidates dominate elections in majority-white areas of the state.
In 1988, Governor Michael S. Dukakis of Massachusetts carried East Carroll Parish over then Vice President George Herbert Walker Bush, 1,809 votes (52.3 percent) to 1,536 (44.4 percent).[12] In the 2004 presidential race, East Carroll gave the Democrat John Kerry - John Edwards slate 1,980 ballots (58 percent) to 1,357 votes (40 percent) for the George W. Bush - Richard B. Cheney slate.[13]
In 2012, U.S. President Barack H. Obama swept the parish with 2,478 votes (61.8 percent) to Republican Mitt Romney's 1,508 (37.6 percent).[14] In 2008, Obama had handily defeated John McCain in East Carroll Parish, 2,267 (63.7 percent) to 1,254 (35.2 percent).[15]
Geography
According to the U.S. Census Bureau, the parish has a total area of 442 square miles (1,140 km2), of which 421 square miles (1,090 km2) is land and 22 square miles (57 km2) (4.9%) is water.[16]
Major highways
 U.S. Highway 65
 Louisiana Highway 2
Adjacent counties and parishes
- Chicot County, Arkansas (north)
- Issaquena County, Mississippi (east)
- Warren County, Mississippi (southeast)
- Madison Parish (south)
- Richland Parish (southwest)
- West Carroll Parish (west)
Demographics
| Historical population | |||
|---|---|---|---|
| Census | Pop. | %± | |
| 1880 | 12,134 | — | |
| 1890 | 12,362 | 1.9% | |
| 1900 | 11,373 | −8.0% | |
| 1910 | 11,637 | 2.3% | |
| 1920 | 11,231 | −3.5% | |
| 1930 | 15,815 | 40.8% | |
| 1940 | 19,023 | 20.3% | |
| 1950 | 16,302 | −14.3% | |
| 1960 | 14,433 | −11.5% | |
| 1970 | 12,884 | −10.7% | |
| 1980 | 11,772 | −8.6% | |
| 1990 | 9,709 | −17.5% | |
| 2000 | 9,421 | −3.0% | |
| 2010 | 7,759 | −17.6% | |
| 2018 (est.) | 7,037 | [17] | −9.3% |
| U.S. Decennial Census[18] 1790-1960[19] 1900-1990[20] 1990-2000[21] 2010-2013[1] | |||
2020
| Race | Num. | Perc. |
|---|---|---|
| White (non-Hispanic) | 2,034 | 27.27% |
| Black or African American (non-Hispanic) | 5,164 | 69.23% |
| Native American | 2 | 0.03% |
| Asian | 17 | 0.23% |
| Other/Mixed | 127 | 1.7% |
| Hispanic or Latino | 115 | 1.54% |
As of the 2020 United States census, there were 7,459 people, 2,037 households, and 1,193 families residing in the parish.
2010
The 2010 U.S. Census reported the following breakdown of parish population: Black: 69.0%; White: 28.9%, Native American: 0.2%; Asian: 0.6%; Native Hawaiian or Pacific Islander: 0.0%; Two or more races: 0.7%; and Hispanic or Latino (of any race): 1.6%.
2000
As of the census[23] of 2000, there were 9,421 people, 2,969 households, and 2,140 families residing in the parish. The population density was 22 people per square mile (9/km2). There were 3,303 housing units at an average density of 8 per square mile (3/km2). The racial makeup of the parish was 67.29% Black or African American, 31.60% White, 0.18% Native American, 0.33% Asian, 0.25% from other races, and 0.35% from two or more races. 1.19% of the population were Hispanic or Latino of any race.
There were 2,969 households, out of which 36.50% had children under the age of 18 living with them, 40.00% were married couples living together, 27.70% had a female householder with no husband present, and 27.90% were non-families. 25.60% of all households were made up of individuals, and 11.30% had someone living alone who was 65 years of age or older. The average household size was 2.82 and the average family size was 3.40.
In the parish the population was spread out, with 30.30% under the age of 18, 11.50% from 18 to 24, 27.20% from 25 to 44, 18.50% from 45 to 64, and 12.50% who were 65 years of age or older. The median age was 31 years. For every 100 females there were 104.60 males. For every 100 females age 18 and over, there were 106.90 males.
The median income for a household in the parish was $20,723, and the median income for a family was $24,554. Males had a median income of $22,099 versus $18,672 for females. The per capita income for the parish was $9,629. About 32.60% of families and 40.50% of the population were below the poverty line, including 56.80% of those under age 18 and 32.70% of those age 65 or over. The county's per-capita income makes it one of the poorest counties in the United States.
Economy and poverty data
East Carroll Parish is still largely agricultural, with 74% of its land devoted to crops. As farm labor needs have been reduced by mechanization and farms have been consolidated into larger units, jobs in the area have been reduced. Agriculture may take the form of aquaculture, and row crops.
Of 3,197 counties ranked by the U.S. Census Bureau in 2011 for "estimated percent of people of all ages in poverty", East Carroll Parish was fifth. It was estimated that 44 percent of the rural county's residents lived in poverty.[24]
Education
Public schools in East Carroll Parish are operated by the East Carroll Parish School Board. In an infographic released by Graphiq, East Carroll Parish is ranked as the least educated parish in Louisiana with 32.29% of 25 year-olds without a high school diploma and 9.4% of 25 year-olds with a bachelor's degree or higher.[25]
Communities

Towns
- Lake Providence (parish seat and only municipality)
Unincorporated communities
Notable people
- Buddy Caldwell, District Attorney of the Sixth Judicial District in East Carroll, elected in 2007 as the attorney general of Louisiana, serving into 2016
- Vail M. Delony, state representative, 1950–1967; Speaker of the Louisiana House, 1964–1967
- John Martin Hamley, state representative, 1912–1924; clerk of the state House, 1924–1931; elected parish tax assessor, 1933`
- William J. Jefferson, former U.S. representative from Louisiana's 2nd congressional district, was born in Lake Providence. He was convicted of corruption in 2012; in 2017, seven of 10 charges against him were dropped and he was released from prison.
- James E. Paxton, district attorney for Louisiana 6th Judicial District (East Carroll, Madison, and Tensas parishes) since 2008[26]
- Francis Xavier Ransdell, state 6th Judicial District judge from 1900 to 1936
- Joseph Ransdell, a Democrat who served in Congress from 1913 to 1931. Ransdell was born in Alexandria but resided for many years in Lake Providence.
- John Henry Scott, born and lived in this parish, worked on civil rights for voting rights of African Americans in the state[27]
- David Voelker, entrepreneur and philanthropist in New Orleans; born in Lake Providence
- Frank Voelker Jr., attorney in Lake Providence and New Orleans; former chairman of the Louisiana Sovereignty Commission; candidate for governor of Louisiana in 1963
- Frank Voelker Sr., judge of the 6th Judicial District, 1937–1963; son-in-law of Judge Francis Ransdell
- Charles L. Vining Jr., state representative from East and West Carroll parishes, 1968–1972
- Norris C. Williamson, state senator from 1916 to 1932; advocate of cotton planter interest and worked to gain state funding to eradicate the cattle tick
- John D. Winters, historian at Louisiana Tech University, author of The Civil War in Louisiana (1963), was reared in Lake Providence.
- Aaron "Rudy" Threats, the longest serving Chief of Police in the history of Lake Providence, the parish seat of East Carroll Parish.
- General Trass, served as Mayor of Lake Providence and Principal of public school in Lake Providence from 1954 until 1991. The high school was renamed for him after his death.
Gallery
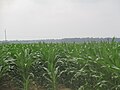 Beginning corn crop (2013) surrounds both sides of the Louisiana State Cotton Museum in Lake Providence
 The city of Lake Providence is named for the oxbow lake
 A dock on Lake Providence
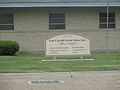 The East Carroll Parish Police Jury office complex in Lake Providence
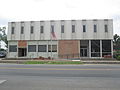 Delta Bank in downtown Lake Providence


Politics
Unlike neighbouring West Carroll Parish, and Louisiana generally, East Carroll Parish is a Democratic stronghold, owing primarily to its majority African-American population. It was one of just two parishes (the other being Orleans Parish, home to New Orleans) to support the Democratic candidate in the 1999 Louisiana gubernatorial election.[28] Furthermore, in presidential elections, it has not supported a Republican since 1972, when Republican incumbent Richard Nixon carried 63 of the state's 64 parishes, and East Carroll was still Nixon's fourth weakest parish in the state. East Carroll rejected Ronald Reagan in both 1980 and 1984. The last Democratic candidate to win less than 60% of the parish's vote in a presidential was John Kerry, who ran against President George W. Bush of neighboring Texas. Four years prior, in 2000, it had been Al Gore's fourth best parish statewide. However, East Carroll was previously known to support third-party segregationists. In 1948, it gave Strom Thurmond over 60% of the vote (Republican candidate Thomas Dewey won less than a fifth as many votes as Thurmond). In 1960, it gave a plurality to George Wallace of Alabama. And in 1964, the parish gave 85% of its vote to Republican Barry Goldwater, who lost in a landslide to Lyndon Johnson nationally, compared to just 15% for Lyndon Johnson. Before 1964, like most of the south, East Carroll was powerfully Democratic, giving just 3 votes to Republican Charles Evans Hughes, and even giving 77% of its vote to Al Smith, who performed considerably worse in the south than past Democratic candidates, losing traditionally Democratic strongholds including Texas, Florida and North Carolina. More recently, East Carroll has trended further and further Democratic. In fact, in 2012 Barack Obama won more votes than Bill Clinton in 1996, and in 2016 Hillary Clinton won more votes than her husband, Bill Clinton, had won in 1992 (albeit by a very thin margin of three votes).[29]
| Year | Republican | Democratic | Third parties |
|---|---|---|---|
| 2020 | 35.6% 1,080 | 62.6% 1,900 | 1.9% 56 |
| 2016 | 36.0% 1,059 | 62.5% 1,838 | 1.4% 42 |
| 2012 | 37.6% 1,508 | 61.8% 2,478 | 0.6% 22 |
| 2008 | 35.2% 1,254 | 63.7% 2,267 | 1.1% 38 |
| 2004 | 40.0% 1,357 | 58.3% 1,980 | 1.7% 58 |
| 2000 | 39.5% 1,280 | 57.8% 1,876 | 2.7% 89 |
| 1996 | 29.6% 1,008 | 63.0% 2,149 | 7.4% 254 |
| 1992 | 33.8% 1,142 | 54.4% 1,835 | 11.8% 398 |
| 1988 | 44.4% 1,536 | 52.3% 1,809 | 3.3% 115 |
| 1984 | 47.8% 1,974 | 50.6% 2,089 | 1.7% 69 |
| 1980 | 44.1% 1,867 | 54.0% 2,283 | 1.9% 81 |
| 1976 | 40.4% 1,681 | 56.9% 2,367 | 2.7% 110 |
| 1972 | 48.4% 1,736 | 46.3% 1,661 | 5.3% 190 |
| 1968 | 13.9% 586 | 45.7% 1,926 | 40.5% 1,706 |
| 1964 | 85.0% 1,486 | 15.0% 263 | |
| 1960 | 29.4% 448 | 23.9% 364 | 46.7% 712 |
| 1956 | 30.8% 415 | 40.5% 545 | 28.7% 387 |
| 1952 | 45.2% 757 | 54.8% 918 | |
| 1948 | 10.5% 116 | 29.3% 323 | 60.2% 665 |
| 1944 | 27.9% 357 | 72.2% 925 | |
| 1940 | 20.9% 270 | 79.2% 1,025 | |
| 1936 | 10.5% 95 | 89.5% 811 | |
| 1932 | 3.1% 24 | 96.9% 751 | |
| 1928 | 23.0% 130 | 77.0% 436 | |
| 1924 | 20.4% 71 | 79.6% 277 | |
| 1920 | 3.1% 8 | 96.9% 247 | |
| 1916 | 1.4% 3 | 98.7% 219 | |
| 1912 | 2.1% 4 | 86.1% 161 | 11.8% 22 |
See also
- National Register of Historic Places listings in East Carroll Parish, Louisiana
References
- "State & County QuickFacts". United States Census Bureau. Archived from the original on June 6, 2011. Retrieved August 9, 2013.
- "Find a County". National Association of Counties. Archived from the original on July 12, 2012. Retrieved June 7, 2011.
- Gannett, Henry (1905). The Origin of Certain Place Names in the United States. Govt. Print. Off. pp. 112.
- Scott (2003), p. 17
- Scott (2003), p. 18
- "East Carroll Parish". Center for Cultural and Eco-tourism. Retrieved September 4, 2014.
- Scott (2003), p. 19
- Scott (2003), p. 20
- Adam Fairclough, Race & Democracy: The Civil Rights Struggle in Louisiana, 1915-1972, University of Georgia Press, 1999
- "East Carroll Parish Genealogy". eastcarrollparishlouisianagenealogy.blogspot.com. Retrieved June 10, 2013.
- John H. Scott with Cleo Scott Brown, Witness to the Truth, University of South Carolina Press, 2003
- "East Carroll Parish presidential election returns, November 8, 1988". staticresults.sos.la.gov. Retrieved November 20, 2012.
- "East Carroll Parish presidential election returns, November 2, 2004". staticresults.sos.la.gov. Retrieved November 20, 2012.
- "Louisiana general election returns, November 6, 2012". staticresults.sos.la.gov. Retrieved November 11, 2012.
- "East Carroll Parish presidential election returns, November 4, 2008". staticresults.sos.la.gov. Retrieved November 20, 2012.
- "2010 Census Gazetteer Files". United States Census Bureau. August 22, 2012. Archived from the original on September 28, 2013. Retrieved August 20, 2014.
- "Population and Housing Unit Estimates". Retrieved October 29, 2019.
- "U.S. Decennial Census". United States Census Bureau. Retrieved August 20, 2014.
- "Historical Census Browser". University of Virginia Library. Retrieved August 20, 2014.
- "Population of Counties by Decennial Census: 1900 to 1990". United States Census Bureau. Retrieved August 20, 2014.
- "Census 2000 PHC-T-4. Ranking Tables for Counties: 1990 and 2000" (PDF). United States Census Bureau. Retrieved August 20, 2014.
- "Explore Census Data". data.census.gov. Retrieved December 19, 2021.
- "U.S. Census website". United States Census Bureau. Retrieved January 31, 2008.
- "Table 1: 2011 Poverty and Median Income Estimates - Counties". Small Area Income and Poverty Estimates. U.S. Census Bureau. 2011. Archived from the original on October 10, 2013.
- "The least educated place in every state". www.msn.com. Archived from the original on January 4, 2017. Retrieved January 3, 2017.
- "James E. Paxton". sixthda.com. Archived from the original on October 5, 2013. Retrieved October 4, 2013.
- John Henry Scott, Cleo Scott Brown. Witness to the Truth: My Struggle for Human Rights in Louisiana, Univ of South Carolina Press, 2003
- "1999 Gubernatorial General Election Results". uselectionsatlas.org.
- Leip, David. "Dave Leip's Atlas of U.S. Presidential Elections".
- Leip, David. "Dave Leip's Atlas of U.S. Presidential Elections". uselectionatlas.org. Retrieved March 7, 2018.
External links
Further reading
- Sutter, John D. "The most unequal place in America." CNN. October 29, 2013.
Places adjacent to East Carroll Parish, Louisiana | ||||||||||||||||
|---|---|---|---|---|---|---|---|---|---|---|---|---|---|---|---|---|
| ||||||||||||||||
Municipalities and communities of East Carroll Parish, Louisiana, United States | ||
|---|---|---|
Parish seat: Lake Providence | ||
| Town |  | |
| Unincorporated communities | ||
| ||
Authority control | |
|---|---|
| General | |
| National libraries | |
| Other | |
На других языках
[de] East Carroll Parish
Das East Carroll Parish[1] (französisch Paroisse de Carroll Est) ist ein Parish im Bundesstaat Louisiana der Vereinigten Staaten. Im Jahr 2010 hatte das Parish 7759 Einwohner und eine Bevölkerungsdichte von 7,1 Einwohner pro Quadratkilometer. Der Verwaltungssitz (Parish Seat) ist Lake Providence.- [en] East Carroll Parish, Louisiana
[ru] Ист-Карролл
Прихо́д Восто́чный Ка́ролл (англ. East Carroll Parish, фр. Paroisse de Carroll Est) — один из приходов штата Луизиана, США. Официально образован в 1877 году. По состоянию на 2010 год, численность населения составляла 7759 человек.Другой контент может иметь иную лицензию. Перед использованием материалов сайта WikiSort.org внимательно изучите правила лицензирования конкретных элементов наполнения сайта.
WikiSort.org - проект по пересортировке и дополнению контента Википедии