world.wikisort.org - Canada
Scarborough—Guildwood is a federal electoral district in Toronto, Ontario, Canada, that has been represented in the House of Commons of Canada since 2004.
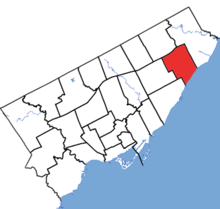 Scarborough—Guildwood in relation to the other Toronto ridings (2013 boundaries) | |||
| Coordinates: | 43.763°N 79.207°W | ||
| Federal electoral district | |||
| Legislature | House of Commons | ||
| MP |
Liberal | ||
| District created | 2003 | ||
| First contested | 2004 | ||
| Last contested | 2021 | ||
| District webpage | profile, map | ||
| Demographics | |||
| Population (2021)[1] | 103,449 | ||
| Electors (2015) | 63,296 | ||
| Area (km²)[2] | 27 | ||
| Pop. density (per km²) | 3,831.4 | ||
| Census division(s) | Toronto | ||
| Census subdivision(s) | Toronto | ||

It was created in 2003 from parts of Scarborough East, Scarborough Southwest and Scarborough Centre.
This riding lost territory to Scarborough—Rouge Park and Scarborough Southwest, and gained territory from Scarborough Centre during the 2012 electoral redistribution.
Geography
It is centred on the Guildwood neighbourhood. It consists of the part of the City of Toronto bounded by a line drawn from Lake Ontario north along Markham Road, west along Eglinton Avenue, north along Bellamy Road South, west along Lawrence Avenue, north along McCowan Road, east along Highway 401, south along Morningside Avenue back to Lake Ontario.
Presently, it contains the neighbourhoods of Guildwood, West Hill (west of Morningside Avenue), Morningside, Woburn, and Scarborough Village (east of Markham Road).
Demographics
- According to the Canada 2011 Census
Ethnic groups: 33.3% White, 30.6% South Asian, 14.7% Black, 7.4% Filipino, 2.8% Chinese, 2.4% West Asian, 1.9% Latin American, 1.2% Southeast Asian
Languages: 57.8% English, 7.5% Tamil, 5.7% Gujarati, 3.8% Tagalog, 3.1% Urdu, 2.2% Chinese, 1.9% Persian, 1.8% Bengali, 1.4% French, 1.3% Spanish
Religions: 54.0% Christian (24.3% Catholic, 3.9% Anglican, 3.1% Pentecostal, 3.0% United Church, 2.9% Christian Orthodox, 2.1% Baptist, 1.8% Presbyterian), 15.5% Hindu, 14.5% Muslim, 13.7% No religion
Median income (2005): $21,092
Members of Parliament
This riding has elected the following members of the House of Commons of Canada:
| Parliament | Years | Member | Party | |
|---|---|---|---|---|
| Scarborough—Guildwood Riding created from Scarborough East, Scarborough Southwest and Scarborough Centre |
||||
| 38th | 2004–2006 | John McKay | Liberal | |
| 39th | 2006–2008 | |||
| 40th | 2008–2011 | |||
| 41st | 2011–2015 | |||
| 42nd | 2015–2019 | |||
| 43rd | 2019–2021 | |||
| 44th | 2021–present | |||
Election results
| 2021 Canadian federal election | ||||||||
|---|---|---|---|---|---|---|---|---|
| Party | Candidate | Votes | % | ±% | ||||
| Liberal | John McKay | 22,944 | 61.1 | ±0.0 | ||||
| Conservative | Carmen Wilson | 7,998 | 21.3 | -1.1 | ||||
| New Democratic | Michelle Spencer | 5,091 | 13.6 | +2.4 | ||||
| People's | James Bountrogiannis | 1,096 | 2.9 | +1.4 | ||||
| Independent | Kevin Clarke | 155 | 0.4 | +0.1 | ||||
| Centrist | Aslam Khan | 129 | 0.3 | N/A | ||||
| Independent | Opa Day | 85 | 0.2 | N/A | ||||
| Canadian Nationalist | Gus Stefanis | 52 | 0.1 | -0.1 | ||||
| Total valid votes | 37,550 | 98.6 | ||||||
| Total rejected ballots | 548 | 1.4 | ||||||
| Turnout | 38,098 | 58.0 | ||||||
| Eligible voters | 65,711 | |||||||
| Liberal hold | Swing | +0.6 | ||||||
| Source: Elections Canada[3] | ||||||||
| 2019 Canadian federal election | ||||||||
|---|---|---|---|---|---|---|---|---|
| Party | Candidate | Votes | % | ±% | Expenditures | |||
| Liberal | John McKay | 26,123 | 61.12 | +1.08 | $79,793.87 | |||
| Conservative | Quintus Thuraisingham | 9,553 | 22.35 | -4.15 | $57,402.46 | |||
| New Democratic | Michelle Spencer | 4,806 | 11.24 | -0.02 | none listed | |||
| Green | Tara McMahon | 1,220 | 2.85 | +1.41 | none listed | |||
| People's | Jigna Jani | 648 | 1.52 | - | none listed | |||
| Independent | Kevin Clarke | 112 | 0.26 | -0.16 | none listed | |||
| Canadian Nationalist | Gus Stefanis | 85 | 0.20 | – | none listed | |||
| Independent | Stephen Abara | 70 | 0.16 | - | none listed | |||
| Independent | Kathleen Marie Holding | 70 | 0.16 | - | none listed | |||
| Canada's Fourth Front | Farhan Alvi | 55 | 0.13 | - | $791.00 | |||
| Total valid votes/expense limit | 42,742 | 98.66 | ||||||
| Total rejected ballots | 580 | 1.34 | +0.87 | |||||
| Turnout | 43,322 | 62.89 | -1.69 | |||||
| Eligible voters | 68,886 | |||||||
| Liberal hold | Swing | +2.61 | ||||||
| Source: Elections Canada[4][5] | ||||||||
| 2015 Canadian federal election | ||||||||
|---|---|---|---|---|---|---|---|---|
| Party | Candidate | Votes | % | ±% | Expenditures | |||
| Liberal | John McKay | 25,167 | 60.04 | +24.25 | $77,572.69 | |||
| Conservative | Chuck Konkel | 11,108 | 26.50 | -8.19 | $80,342.41 | |||
| New Democratic | Laura Casselman | 4,720 | 11.26 | -15.44 | $14,956.71 | |||
| Green | Kathleen Holding | 606 | 1.45 | -0.78 | – | |||
| Independent | Kevin Clarke | 175 | 0.42 | – | – | |||
| Marijuana | Paul Coulbeck | 141 | 0.34 | -0.26 | – | |||
| Total valid votes/Expense limit | 41,917 | 99.53 | $198,726.79 | |||||
| Total rejected ballots | 198 | 0.47 | ||||||
| Turnout | 42,115 | 64.58 | ||||||
| Eligible voters | 65,217 | |||||||
| Liberal hold | Swing | +16.22 | ||||||
| Source: Elections Canada[6][7] | ||||||||
| 2011 federal election redistributed results[8] | |||
|---|---|---|---|
| Party | Vote | % | |
| Liberal | 12,380 | 35.79 | |
| Conservative | 11,999 | 34.69 | |
| New Democratic | 9,237 | 26.70 | |
| Green | 769 | 2.22 | |
| Others | 206 | 0.60 | |
| 2011 Canadian federal election | ||||||||
|---|---|---|---|---|---|---|---|---|
| Party | Candidate | Votes | % | ±% | Expenditures | |||
| Liberal | John McKay | 13,849 | 36.20 | -13.97 | ||||
| Conservative | Chuck Konkel | 13,158 | 34.39 | +4.23 | ||||
| New Democratic | Danielle Ouellette | 10,145 | 26.52 | +12.15 | ||||
| Green | Alonzo Bartley | 848 | 2.22 | -3.09 | ||||
| Independent | Paul Coulbeck | 259 | 0.68 | – | ||||
| Total valid votes/Expense limit | 38,259 | 100.00 | ||||||
| Total rejected ballots | 186 | 0.48 | -0.03 | |||||
| Turnout | 38,445 | 57.59 | +3.57 | |||||
| Eligible voters | 66,756 | – | – | |||||
| Liberal hold | Swing | -9.10 | ||||||
| 2008 Canadian federal election | ||||||||
|---|---|---|---|---|---|---|---|---|
| Party | Candidate | Votes | % | ±% | Expenditures | |||
| Liberal | John McKay | 18,098 | 50.16 | -3.09 | $47,878 | |||
| Conservative | Chuck Konkel | 10,881 | 30.16 | +1.46 | $71,234 | |||
| New Democratic | Sania Khan | 5,183 | 14.36 | +0.13 | $15,238 | |||
| Green | Alonzo Bartley | 1,913 | 5.30 | +2.30 | ||||
| Total valid votes/Expense limit | 36,075 | 100.00 | $80,466 | |||||
| Total rejected ballots | 186 | 0.51 | -0.16 | |||||
| Turnout | 36,261 | 54.02 | -8.36 | |||||
| Eligible voters | 67,124 | – | – | |||||
| Liberal hold | Swing | -2.28 | ||||||
| 2006 Canadian federal election | ||||||||
|---|---|---|---|---|---|---|---|---|
| Party | Candidate | Votes | % | ±% | ||||
| Liberal | John McKay | 21,875 | 53.25 | -4.28 | ||||
| Conservative | Pauline Browes | 11,790 | 28.70 | +5.97 | ||||
| New Democratic | Peter Campbell | 5,847 | 14.23 | -1.93 | ||||
| Green | Mike Flanagan | 1,235 | 3.00 | -0.04 | ||||
| Independent | Farooq Khan | 150 | 0.36 | |||||
| Canadian Action | Brenda Thompson | 98 | 0.23 | -0.32 | ||||
| Independent | Andrew Thomas | 82 | 0.19 | |||||
| Total valid votes | 41,077 | 100.00 | ||||||
| Total rejected ballots | 276 | 0.67 | ||||||
| Turnout | 41,355 | 62.38 | ||||||
| Liberal hold | Swing | -5.13 | ||||||
| 2004 Canadian federal election | ||||||||
|---|---|---|---|---|---|---|---|---|
| Party | Candidate | Votes | % | |||||
| Liberal | John McKay | 20,950 | 57.53 | |||||
| Conservative | Tom Varesh | 8,277 | 22.73 | |||||
| New Democratic | Sheila White | 5,885 | 16.16 | |||||
| Green | Paul Charbonneau | 1,106 | 3.04 | |||||
| Canadian Action | Brenda Thompson | 200 | 0.55 | |||||
| Total valid votes | 36,418 | 100.00 | ||||||
See also
- List of Canadian federal electoral districts
- Past Canadian electoral districts
References
- "(Code 35082) Census Profile". 2011 census. Statistics Canada. 2012. Retrieved March 3, 2011.
- Riding history from the Library of Parliament
- 2011 results from Elections Canada
- Campaign expense data from Elections Canada
Notes
- "Census Profile, 2021 Census". Ottawa: Statistics Canada. 2022. Retrieved February 9, 2022.
- Statistics Canada: 2011
- "List of confirmed candidates – September 20, 2021 Federal Election". Elections Canada. Retrieved September 2, 2021.
- "List of confirmed candidates". Elections Canada. Retrieved October 4, 2019.
- "Official Voting Results". Elections Canada. Retrieved August 7, 2021.
- Elections Canada – Confirmed candidates for Scarborough—Guildwood, 30 September 2015
- Elections Canada – Preliminary Election Expenses Limits for Candidates
- Pundits' Guide to Canadian Elections
Federal ridings in Suburban Toronto | ||
|---|---|---|
| Liberal | ||
Другой контент может иметь иную лицензию. Перед использованием материалов сайта WikiSort.org внимательно изучите правила лицензирования конкретных элементов наполнения сайта.
WikiSort.org - проект по пересортировке и дополнению контента Википедии