Etobicoke—Lakeshore (formerly known as Lakeshore and Toronto—Lakeshore) is a federal electoral district in Ontario, Canada, that has been represented in the House of Commons of Canada since 1968.
Federal electoral district in Ontario, Canada
For the provincial and municipal electoral divisions, see Etobicoke—Lakeshore (provincial electoral district) and Ward 3 Etobicoke—Lakeshore.
For the defunct district, see Lakeshore (provincial electoral district).
Etobicoke—Lakeshore
Ontario electoral district
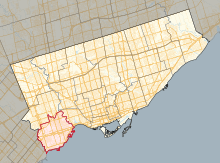
Etobicoke—Lakeshore in relation to other electoral districts in Toronto (2015 boundaries)
It covers the southern part of the Etobicoke portion of Toronto on the shore of Lake Ontario including the former 'Lakeshore Municipalities' of Mimico, New Toronto and Long Branch.
This riding has been a destination for Slavic immigrants. The percentage of native speakers of Slavic languages in this riding (primarily Polish, Ukrainian, Russian, Serbian, and Croatian) is 15.0%, the highest in Canada.[3]
Demographics
According to the Canada 2011 Census
Ethnic groups: 75.3% White, 4.6% South Asian, 4.2% Black, 3.3% Filipino, 2.8% Chinese, 2.2% Latin American, 1.8% Korean, 1.3% Southeast Asian Languages: 60.6% English, 5.5% Polish, 3.4% Ukrainian, 2.7% Italian, 2.3% Spanish, 2.2% Portuguese, 2.1% Russian, 2.1% Chinese, 2.0% French, 1.8% Tagalog, 1.7% Serbian, 1.5% Korean Religions: 70.7% Christian (40.8% Catholic, 5.9% Christian Orthodox, 5.3% United Church, 4.8% Anglican, 1.9% Presbyterian, 1.2% Baptist), 3.7% Muslim, 1.7% Hindu, 1.1% Buddhist, 21.6 No religion Median income (2005): $30,419
Geography
Consisting of that part of the City of Toronto described as follows: commencing at the intersection of the Humber River with Dundas Street West; thence southwesterly along said street to the Canadian Pacific Railway; thence southerly along said railway to Mimico Creek; thence generally westerly along said creek to Kipling Avenue; thence southerly along said avenue to Burnhamthorpe Road; thence westerly along said road to Highway 427; thence southerly along said highway to Dundas Street West; thence westerly along said street to the westerly limit of said city; thence generally southerly and northeasterly along the westerly and southerly limits of said city to the southeasterly production of the Humber River; thence generally northwesterly along said production and the Humber River to the point of commencement.
History
The riding was created in 1966 as "Lakeshore" from part of York—Humber, the same year the 'Lakeshore municipalities', Mimico, New Toronto, Long Branch were annexed to the new Borough of Etobicoke. In 1971, it was renamed "Toronto—Lakeshore". In 1976, it was abolished, and replaced by "Etobicoke—Lakeshore".
The riding was represented by federal Liberal Party and official Opposition leader Michael Ignatieff, who was first elected in 2006, until he was unseated in the 2011 General Election by Conservative Bernard Trottier. Trottier lost to James Maloney of the Liberals in 2015, and Maloney still holds the seat. It was previously represented by Jean Augustine. Provincially, it was represented by Peter Milczyn from 2014 to 2018, and is now represented by Christine Hogarth. On Toronto City Council, the riding is represented by Mark Grimes.
In the 1988 federal election, there was no Liberal candidate on the ballot because two days after nominations were due, the Liberal candidate, Emmanuel Feuerwerker, withdrew citing heart problems after the news media reported that Mr. Feuerwerker's campaign literature claimed university degrees that he did not, in fact, possess.[4]
This riding lost territory to Etobicoke Centre during the 2012 electoral redistribution.
Former boundaries
1966 to 1976
1976 to 1987
1987 to 1996
1996 to 2004
2004 to 2015
Members of Parliament
This riding has elected the following Members of Parliament:
Другой контент может иметь иную лицензию. Перед использованием материалов сайта WikiSort.org внимательно изучите правила лицензирования конкретных элементов наполнения сайта.
2019-2026 WikiSort.org - проект по пересортировке и дополнению контента Википедии

 1966 to 1976
 1976 to 1987
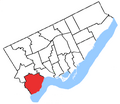 1987 to 1996
 1996 to 2004
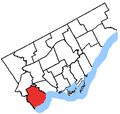 2004 to 2015


