world.wikisort.org - Canada
Haldimand—Norfolk is a federal electoral district in Ontario, Canada, that has been represented in the House of Commons of Canada from 1979 to 1997, and since 2004. The current Member of Parliament (MP) is Conservative Leslyn Lewis.
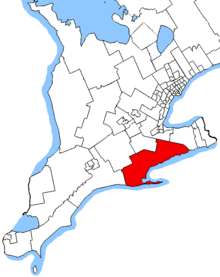 Haldimand—Norfolk in relation to other southern Ontario electoral districts | |||
| Federal electoral district | |||
| Legislature | House of Commons | ||
| MP |
Conservative | ||
| District created | 2003 | ||
| First contested | 2004 | ||
| Last contested | 2021 | ||
| District webpage | profile, map | ||
| Demographics | |||
| Population (2011)[1] | 108,051 | ||
| Electors (2015) | 81,773 | ||
| Area (km²)[2] | 3,061 | ||
| Pop. density (per km²) | 35.3 | ||
| Census division(s) | Haldimand, Norfolk | ||
| Census subdivision(s) | Haldimand, Norfolk | ||
Geography
This riding is located in rural Southern Ontario, and comprises Haldimand and Norfolk Counties, except for parts of the Six Nations and New Credit Indian reserves. The total area is 3,073 km2. There are 205 polling divisions. Neighbouring districts include Ancaster—Dundas—Flamborough—Westdale, Brant, Elgin—Middlesex—London, Niagara West—Glanbrook, Oxford, and Welland.
Demographics
- According to the Canada 2011 Census; 2013 representation[3]
Ethnic groups: 95.0% White, 3.2% Aboriginal
Languages: 89.5% English, 3.5% German, 1.4% Dutch, 1.2% French
Religions: 73.6% Christian (22.8% Catholic, 13.6% United Church, 8.6% Anglican, 6.1% Baptist, 3.6% Presbyterian, 1.9% Lutheran, 1.5% Pentecostal, 15.4% Other), 25.6% No religion
Median income (2010): $29,580
Average income (2010): $36,839
History
Haldimand—Norfolk has existed as a federal electoral district twice. It was first created in 1976 from the riding of Norfolk—Haldimand. Haldimand—Norfolk was later abolished in 1996, and was mostly replaced by Haldimand—Norfolk—Brant. It was recreated in 2003 from 12.0% of Erie—Lincoln and 88.0% of Haldimand—Norfolk—Brant.
From its first election in 1979 to 1988, Haldimand—Norfolk was represented by the Progressive Conservative Bud Bradley. In 1988, Liberal Bob Speller defeated Bradley. Speller went on to serve as Minister of Agriculture. In 2004, Haldimand—Norfolk elected Conservative candidate Diane Finley, who was re-elected in 2008 and 2011. After being re-elected in the 2006 election, Finley was appointed to the cabinet as Minister of Human Resources and Skills Development. She was shuffled from the Human Resources and Skills Development Canada to the Citizenship and Immigration Canada portfolio on January 4, 2007. After her 2008 election victory she resumed her former post as Minister of Human Resources and Skills Development in the Conservative minority government, a post she continued to hold until 2013.
This riding was left unchanged after the 2012 electoral redistribution.
Members of Parliament
This riding has elected the following Members of Parliament:
| Parliament | Years | Member | Party | |
|---|---|---|---|---|
| Haldimand—Norfolk Riding created from Norfolk—Haldimand |
||||
| 31st | 1979–1980 | Bud Bradley | Progressive Conservative | |
| 32nd | 1980–1984 | |||
| 33rd | 1984–1988 | |||
| 34th | 1988–1993 | Bob Speller | Liberal | |
| 35th | 1993–1997 | |||
| Riding dissolved into Haldimand—Norfolk—Brant | ||||
| Riding re-created from Haldimand—Norfolk—Brant and Erie—Lincoln | ||||
| 38th | 2004–2006 | Diane Finley | Conservative | |
| 39th | 2006–2008 | |||
| 40th | 2008–2011 | |||
| 41st | 2011–2015 | |||
| 42nd | 2015–2019 | |||
| 43rd | 2019–2021 | |||
| 44th | 2021–present | Leslyn Lewis | ||
Election results
2003–present
| 2021 Canadian federal election | ||||||||
|---|---|---|---|---|---|---|---|---|
| Party | Candidate | Votes | % | ±% | Expenditures | |||
| Conservative | Leslyn Lewis | 29,664 | 47.39 | +0.64 | ||||
| Liberal | Karen Matthews | 17,224 | 27.52 | +2.98 | ||||
| New Democratic | Meghan Piironen | 8,320 | 13.29 | -2.05 | ||||
| People's | Ken Gilpin | 6,570 | 10.50 | +8.44 | ||||
| Christian Heritage | Charles Lugosi | 559 | 0.89 | -0.47 | ||||
| Veterans Coalition | George McMorrow | 255 | 0.41 | -1.40 | ||||
| Total valid votes | 62,505 | |||||||
| Total rejected ballots | 425 | |||||||
| Turnout | 63,017 | 67.18 | +1.25 | |||||
| Eligible voters | 93,802 | |||||||
| Source: Elections Canada[4] | ||||||||
| Conservative hold | Swing | -2.34 | ||||||
| 2019 Canadian federal election | ||||||||
|---|---|---|---|---|---|---|---|---|
| Party | Candidate | Votes | % | ±% | Expenditures | |||
| Conservative | Diane Finley | 28,018 | 46.75 | +2.7 | $71,248.92 | |||
| Liberal | Kim Huffman | 14,704 | 24.54 | -12.1 | $47,529.88 | |||
| New Democratic | Adrienne Roberts | 9,192 | 15.34 | +1.7 | $2,660.65 | |||
| Green | Brooke Martin | 4,878 | 8.14 | +4.8 | none listed | |||
| People's | Bob Forbes | 1,234 | 2.06 | - | $2,959.97 | |||
| Veterans Coalition | Harold Stewart | 1,083 | 1.81 | - | none listed | |||
| Christian Heritage | Lily Eggink | 817 | 1.36 | -0.2 | none listed | |||
| Total valid votes/expense limit | 59,926 | 99.28 | ||||||
| Total rejected ballots | 436 | 0.72 | ||||||
| Turnout | 60,362 | 65.93 | ||||||
| Eligible voters | 91,557 | |||||||
| Conservative hold | Swing | +7.4 | ||||||
| Source: Elections Canada[5][6] | ||||||||
| 2015 Canadian federal election | ||||||||
|---|---|---|---|---|---|---|---|---|
| Party | Candidate | Votes | % | ±% | Expenditures | |||
| Conservative | Diane Finley | 24,714 | 44.14 | -6.80 | $127,788.19 | |||
| Liberal | Joan Mouland | 20,487 | 36.59 | +11.67 | $72,346.01 | |||
| New Democratic | John Harris | 7,625 | 13.62 | -6.36 | $3,656.59 | |||
| Green | Wayne Ettinger | 1,857 | 3.32 | +0.01 | $12,277.23 | |||
| Christian Heritage | David Bylsma | 884 | 1.58 | +0.72 | $7,252.58 | |||
| Independent | Dustin Wakeford | 272 | 0.49 | – | $12,267.19 | |||
| Independent | Leslie Bory | 151 | 0.27 | – | $1,616.53 | |||
| Total valid votes/expense limit | 55,990 | 100.00 | $219,180.63 | |||||
| Total rejected ballots | 312 | 0.55 | ||||||
| Turnout | 56,302 | 68.14 | ||||||
| Eligible voters | 82,621 | |||||||
| Conservative hold | Swing | -9.24 | ||||||
| Source: Elections Canada[7][8] | ||||||||
| 2011 Canadian federal election | ||||||||
|---|---|---|---|---|---|---|---|---|
| Party | Candidate | Votes | % | ±% | Expenditures | |||
| Conservative | Diane Finley | 25,655 | 50.94 | +10.11 | – | |||
| Liberal | Bob Speller | 12,549 | 24.92 | -7.43 | – | |||
| New Democratic | Ian Nichols | 10,062 | 19.98 | +8.45 | – | |||
| Green | Anne Faulkner | 1,665 | 3.31 | -0.93 | – | |||
| Christian Heritage | Steven Elgersma | 435 | 0.86 | -0.18 | – | |||
| Total valid votes/expense limit | 50,366 | 100.0 | 4.1 | |||||
| Total rejected ballots | 256 | 0.51 | – | |||||
| Turnout | 50,622 | 63.49 | ||||||
| Eligible voters | 79,729 | – | – | |||||
| 2008 Canadian federal election | ||||||||
|---|---|---|---|---|---|---|---|---|
| Party | Candidate | Votes | % | ±% | Expenditures | |||
| Conservative | Diane Finley | 19,657 | 40.83 | -7.5 | $67,583 | |||
| Liberal | Eric Hoskins | 15,577 | 32.35 | -1.9 | $72,913 | |||
| New Democratic | Ian Nichols | 5,549 | 11.53 | -1.3 | $5,509 | |||
| Independent | Gary McHale | 4,821 | 10.01 | – | $22,798 | |||
| Green | Stephana Johnston | 2,041 | 4.24 | +0.7 | $2,581 | |||
| Christian Heritage | Steven Elgersma | 501 | 1.04 | 0.0 | ||||
| Total valid votes/expense limit | 48,146 | 100 | $85,391 | |||||
| Majority | 4,080 | 8.48 | ||||||
| Total rejected ballots | 248 | 0.51 | ||||||
| Turnout | 48,394 | |||||||
| 2006 Canadian federal election | ||||||||
|---|---|---|---|---|---|---|---|---|
| Party | Candidate | Votes | % | ±% | ||||
| Conservative | Diane Finley | 25,885 | 48.33 | +6.1 | ||||
| Liberal | Bob Speller | 18,363 | 34.29 | -4.5 | ||||
| New Democratic | Valya Roberts | 6,858 | 12.80 | -1.6 | ||||
| Green | Carolyn Van Nort | 1,894 | 3.54 | +0.1 | ||||
| Christian Heritage | Steven Elgersma | 559 | 1.04 | -0.2 | ||||
| Turnout | 53,559 | |||||||
| Conservative hold | Swing | +5.3 | ||||||
| 2004 Canadian federal election | ||||||||
|---|---|---|---|---|---|---|---|---|
| Party | Candidate | Votes | % | ±% | ||||
| Conservative | Diane Finley | 20,981 | 42.2 | -6.2 | ||||
| Liberal | Bob Speller | 19,336 | 38.8 | -7.2 | ||||
| New Democratic | Carrie Sinkowski | 7,143 | 14.4 | +9.8 | ||||
| Green | Colin Jones | 1,703 | 3.4 | |||||
| Christian Heritage | Steven Elgersma | 617 | 1.2 | |||||
| Majority | 1,645 | 3.3 | ||||||
| Turnout | 49,780 | 63.3 | ||||||
| Conservative gain from Liberal | Swing | +1.0 | ||||||
Change from 2000 is based on redistributed results. Conservative Party change is based on the combination of Canadian Alliance and Progressive Conservative Party totals.
From 1996 until 2003, Haldimand—Norfolk did not exist as a federal riding, and was mostly represented by Haldimand—Norfolk—Brant. Results for 1997 and 2000 can be found on that page.
1976–1996
| 1993 Canadian federal election | ||||||||
|---|---|---|---|---|---|---|---|---|
| Party | Candidate | Votes | % | ±% | ||||
| Liberal | Bob Speller | 24,100 | 53.6 | +15.6 | ||||
| Reform | Ken Gilpen | 10,563 | 23.5 | |||||
| Progressive Conservative | Jack Cronkwright | 7,273 | 16.2 | -21.4 | ||||
| New Democratic | Herman Plas | 1,667 | 3.7 | -11.4 | ||||
| National | Ross Bateman | 1,340 | 3.0 | |||||
| Total | 44,943 | 100.0 | ||||||
| 1988 Canadian federal election | ||||||||
|---|---|---|---|---|---|---|---|---|
| Party | Candidate | Votes | % | ±% | ||||
| Liberal | Bob Speller | 16,921 | 38.0 | +11.7 | ||||
| Progressive Conservative | Bud Bradley | 16,712 | 37.6 | -21.5 | ||||
| New Democratic | Eric Butt | 6,736 | 15.1 | +1.9 | ||||
| Christian Heritage | Gary Sytsma | 3,969 | 8.9 | |||||
| Libertarian | David Yaki | 162 | 0.4 | |||||
| Total | 44,500 | 100.0 | ||||||
| 1984 Canadian federal election | ||||||||
|---|---|---|---|---|---|---|---|---|
| Party | Candidate | Votes | % | ±% | ||||
| Progressive Conservative | Bud Bradley | 27,296 | 59.0 | +17.0 | ||||
| Liberal | Edith Fuller | 12,161 | 26.3 | -15.4 | ||||
| New Democratic | Bill Jefferies | 6,138 | 13.3 | -2.4 | ||||
| Independent | Martin J. Weber | 656 | 1.4 | |||||
| Total valid votes | 46,251 | 100.0 | ||||||
| 1980 Canadian federal election | ||||||||
|---|---|---|---|---|---|---|---|---|
| Party | Candidate | Votes | % | ±% | ||||
| Progressive Conservative | Bud Bradley | 18,600 | 42.0 | -7.6 | ||||
| Liberal | Art Renn | 18,461 | 41.7 | +6.7 | ||||
| New Democratic | Norm, Walpole | 6,937 | 15.7 | +0.9 | ||||
| Social Credit | Charley Harris | 284 | 0.6 | 0.0 | ||||
| Total valid votes | 44,282 | 100.0 | ||||||
| 1979 Canadian federal election | ||||||||
|---|---|---|---|---|---|---|---|---|
| Party | Candidate | Votes | % | |||||
| Progressive Conservative | Bud Bradley | 22,655 | 49.6 | |||||
| Liberal | Art Renn | 15,990 | 35.0 | |||||
| New Democratic | Joe Clark | 6,762 | 14.8 | |||||
| Social Credit | William Triska | 309 | 0.7 | |||||
| Total valid votes | 45,716 | 100.0 | ||||||
See also
- List of Canadian federal electoral districts
- Past Canadian electoral districts
References
- "(Code 35028) Census Profile". 2011 census. Statistics Canada. 2012. Retrieved March 3, 2011.
Notes
- Statistics Canada: 2012
- Statistics Canada: 2012
- "2011 National Household Survey Profile - Federal electoral district (2013 Representation Order)". May 8, 2013.
- "September 20, 2021 General Election Election Results". Elections Canada. Retrieved September 22, 2021.
- "List of confirmed candidates". Elections Canada. Retrieved October 4, 2019.
- "Official Voting Results". Elections Canada. Retrieved September 22, 2021.
- Elections Canada – Confirmed candidates for Haldimand—Norfolk, 30 September 2015
- Elections Canada – Preliminary Election Expenses Limits for Candidates
External links
Federal riding history from the Library of Parliament:
- (1976 - 1996)
- (2003 - 2008)
- 2011 Results from Elections Canada
- Website of the Parliament of Canada
- Campaign expense data from Elections Canada
Другой контент может иметь иную лицензию. Перед использованием материалов сайта WikiSort.org внимательно изучите правила лицензирования конкретных элементов наполнения сайта.
WikiSort.org - проект по пересортировке и дополнению контента Википедии