world.wikisort.org - Canada
The Regional Municipality of Halton, or Halton Region, is a regional municipality in Ontario, Canada, located in the Golden Horseshoe of Southern Ontario. It comprises the city of Burlington and the towns of Oakville, Milton, and Halton Hills. Policing in the Region is provided by the Halton Regional Police Service. The regional council's headquarters are located in Oakville. Burlington and Oakville are largely urban and suburban, while the towns of Milton and Halton Hills are more rural.
Halton Region | |
|---|---|
Regional municipality (upper-tier) | |
| Regional Municipality of Halton | |
Clockwise from top left: Georgetown, Hilton Falls, Bronte Harbour, Royal Botanical Gardens, Oakville, Brant Street Pier, | |
 Coat of arms | |
| Motto: Absque labore nihil (Latin for: Nothing without effort) | |
 Halton Region's location within Ontario. | |
| Coordinates: 43°30′30″N 79°53′16″W[1] | |
| Country | Canada |
| Province | Ontario |
| Established (county) | 1854 |
| Established (regional municipality) | 1974 |
| Seat | Oakville |
| Government | |
| • Regional Chair | Gary Carr |
| Area | |
| • Land | 964.01 km2 (372.21 sq mi) |
| Population (2016)[3] | |
| • Total | 548,435 |
| • Density | 520.4/km2 (1,348/sq mi) |
| Time zone | UTC−05:00 (EST) |
| • Summer (DST) | UTC−04:00 (EDT) |
| Website | www.halton.ca |


Halton is part of the Greater Toronto Area (GTA), although it is the only regional municipality in the GTA that is not situated directly adjacent to Toronto’s city proper. However, the region is split between the census metropolitan areas (CMAs) of Toronto and Hamilton. Burlington is part of the Hamilton CMA, while the rest of the region is part of the Toronto CMA.
Halton experienced a growth rate of 17.1% between 2001 and 2006, and 14.2% between 2006 and 2011, giving it one of the highest growth rates in the country. Despite the unprecedented growth in residential development, agriculture and protected lands along the Niagara Escarpment are still the predominant land uses in the region. Halton has been ranked by Maclean's national crime ranking report as being the "safest place to live" in the GTA and one of the top five in Canada.[4]
History
The Regional Municipality of Halton was established on 1 January 1974 as the successor to the former Halton County by the Regional Municipality of Halton Act, 1973.[5] From 1 January 2003, it has been governed by the Municipal Act, 2001.[6]
Until the 2000 municipal elections, the chairperson of the regional council had been appointed by the Ontario government. From that date, it has been an elective position. Joyce Savoline was the last appointed chairperson, and was elected and reelected until her retirement from the position in 2006. The current regional chairperson is Gary Carr.
By 2018, the region reported a population of over 580,000 residents and its population estimate for 2041 exceeded one million. The unemployment rate was 5.3% during the year. The average household income was very high, at $139,000.[7]
Regional council
The council consists of the elected chairperson, the mayors of the local municipalities, and regional councillors elected by wards from the local municipalities (who also sit on their respective municipal councils).
The current membership of the council is as follows:
| Chairperson | Municipality | Mayor | Regional councillors |
| Gary Carr | City of Burlington | Marianne Meed Ward | Kelvin Galbraith Lisa Kearns Rory Nisan Shawna Stolte Paul Sharman Angelo Bentivegna |
| Town of Oakville | Rob Burton | Sean O'Meara Cathy Duddeck Dave Gittings Allan Elgar Jeff Knoll Tom Adams Pavan Parmar | |
| Town of Milton | Gordon Krantz | Colin Best Rick Malboeuf Mike Cluett Zeeshan Hamid | |
| Town of Halton Hills | Rick Bonnette | Jane Fogal Clark Somerville |
Regional services
Halton Region provides the following services to its communities:[8]
- Economic development
- Emergency planning
- Regional planning and growth management
- Recycling and waste
- Regional roads
- Sewage (wastewater) collection systems and treatment plants
- Water purification plants and distribution systems
- Housing supports and services
- Children and parenting
- Employment and financial assistance
- Ontario Works (social services)
- Services for seniors
- Paramedic services
- Public health
- Immunizations and preventable diseases
- Food safety
- Halton Regional Police Service
In 2018, the Region had 27 emergency vehicles and 254 paramedics; the latter answered 53,094 paramedic calls. The Police service had 721 police officers; its 911 call centre received 121,971 reports of emergency.[9]
Demographics
As a census division in the 2021 Census of Population conducted by Statistics Canada, the Regional Municipality of Halton had a population of 596,637 living in 208,601 of its 214,322 total private dwellings, a change of 8.8% from its 2016 population of 548,435. With a land area of 965.71 km2 (372.86 sq mi), it had a population density of 617.8/km2 (1,600.2/sq mi) in 2021.[10]
| 2021 | 2016 | 2011 | |
|---|---|---|---|
| Population | 596,637 (+8.8% from 2016) | 548,435 (+9.3% from 2011) | 501,669 (14.2% from 2006) |
| Land area | 965.71 km2 (372.86 sq mi) | 964.05 km2 (372.22 sq mi) | 964.01 km2 (372.21 sq mi) |
| Population density | 617.8/km2 (1,600/sq mi) | 568.9/km2 (1,473/sq mi) | 520.4/km2 (1,348/sq mi) |
| Median age | 40.8 (M: 40, F: 42) | 40.5 (M: 39.6, F: 41.3) | |
| Total private dwellings | 208,600 | 192,980 | 182,304 |
| Median household income | $103,009 |
| Canada 2016 Census | Population | % of Total Population | |
|---|---|---|---|
| Panethnicity group Source:[16] |
European | 372,150 | 68.8% |
| South Asian | 50,075 | 9.3% | |
| East Asian | 26,545 | 4.9% | |
| Middle Eastern | 16,695 | 3.1% | |
| Black | 15,230 | 2.8% | |
| Southeast Asian | 14,040 | 2.6% | |
| Latin American | 13,650 | 2.5% | |
| Aboriginal | 9,590 | 1.8% | |
| Other | 7,470 | 1.4% | |
| Total population | 540,975 | 100% | |
Economy
Labour force
| 2011 | 2006 | 2001 | 1996 | |
|---|---|---|---|---|
| Participation rate | 71.9% | 72.1% | 76.8% | |
| Employment rate | 68.5% | 69.3% | 72.8% | |
| Unemployment rate | 4.7% | 4.0% | 5.1% |
| 2011 | 2006 | 2001 | 1996 | |
|---|---|---|---|---|
| Agriculture and resources | 4,180 | 3,935 | 2,870 | |
| Construction | 12,060 | 41,540 | 8,085 | |
| Manufacturing | 31,635 | 33,235 | ||
| Wholesale trade | 18,915 | 38,440 | 14,760 | |
| Retail trade | 27,245 | 22,175 | ||
| Financial and real estate | 23,030 | 19,550 | 16,150 | |
| Health care and social services | 19,535 | 29,935 | 15,870 | |
| Educational services | 17,060 | 13,250 | ||
| Business services | 53,975 | 45,120 | 31,045 | |
| Other services | 39,565 | 32,935 | 31,490 | |
| Total | 247,200 | 211,455 | 188,930 |
Agriculture
| Type | 2011 | 2006 | 2001 | ||||||||||
|---|---|---|---|---|---|---|---|---|---|---|---|---|---|
| Halton Hills | Milton | Burlington | Oakville | Total | % change | Halton Hills | Milton | Burlington | Oakville | Total[17] | % change | Total | |
| Number of farms | 169 | 209 | 70 | 21 | 469 | 206 | 260 | 79 | 21 | 566 | 619 | ||
| Total area of farms (in hectares) | 15,436 | 11,289 | 3,259 | 2,216 | 32,200 | 16,747 | 12,592 | 4,306 | 2,331 | 35,976 | 39,966 | ||
| Area of land in crops | 12,507 | 8,288 | 2,106 | 2,057 | 24,958 | 13,353 | 8,741 | 3,084 | 2,133 | 27,311 | 30,469 | ||
| Gross farm receipts ($ millions) | 39.99 | 57.36 | 23.24 | 3.35 | 123.94 | 57.75 | 40.52 | 30.61 | 3.16 | 132.04 | 141.47 | ||
| Total cattle and calves | 2,672 | 1,854 | x | x | 4,907 | 3,571 | 2,725 | 3,919 | 0 | 10,215 | 11,581 | ||
| Total pigs | x | x | x | x | x | N/A | x | x | x | x | 3,508 | 6,254 | |
x = suppressed for reasons of confidentiality
Halton's agricultural sector is supported by regional infrastructure such as the Port of Hamilton which is a growing agri-food hub for the import of agricultural inputs and the export of local crops.
2018 economic report
The 2018 budget document contains additional specifics and updates as to the Region's finances. In that year, gross revenues were $1.2 billion while operating expenses totaled $821.5 million for a net revenue of $350.2 million, an increase of 1.2% over the previous year. The increase was mostly due to increases in grants and taxes. The Region included over 13,200 companies and employed over 229,000 persons. The credit rating of AAA was confirmed by S&P Global Ratings and Moody's Investors Service.[18]
Geography

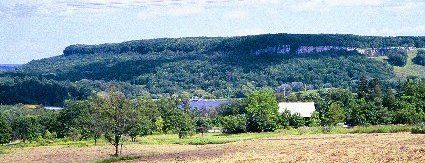
While the urban areas of Burlington, Oakville and Milton are experiencing rapid growth, there is still a significant proportion of the Region that is still rural, most of which is protected as part of the provincial Greenbelt or as part of the Niagara Escarpment Plan.
Halton is somewhat unusual, in that it has three distinct climate zones within its relatively small area,[19] which are as follows:
- Zone 5a - Halton Hills lying to the north of the Niagara Escarpment, together with the Town of Milton within the Grand River watershed
- Zone 5b - the remainder of Halton Hills, Milton north of Derry Road, and that part of Burlington lying north of the Niagara Escarpment
- Zone 6a - the southern remainder of the Region
Climate charts
| GEORGETOWN WWTP | ||||||||||||||||||||||||||||||||||||||||||||||||||||||||||||
|---|---|---|---|---|---|---|---|---|---|---|---|---|---|---|---|---|---|---|---|---|---|---|---|---|---|---|---|---|---|---|---|---|---|---|---|---|---|---|---|---|---|---|---|---|---|---|---|---|---|---|---|---|---|---|---|---|---|---|---|---|
| Climate chart (explanation) | ||||||||||||||||||||||||||||||||||||||||||||||||||||||||||||
| ||||||||||||||||||||||||||||||||||||||||||||||||||||||||||||
| ||||||||||||||||||||||||||||||||||||||||||||||||||||||||||||
| BURLINGTON TS | ||||||||||||||||||||||||||||||||||||||||||||||||||||||||||||
|---|---|---|---|---|---|---|---|---|---|---|---|---|---|---|---|---|---|---|---|---|---|---|---|---|---|---|---|---|---|---|---|---|---|---|---|---|---|---|---|---|---|---|---|---|---|---|---|---|---|---|---|---|---|---|---|---|---|---|---|---|
| Climate chart (explanation) | ||||||||||||||||||||||||||||||||||||||||||||||||||||||||||||
| ||||||||||||||||||||||||||||||||||||||||||||||||||||||||||||
| ||||||||||||||||||||||||||||||||||||||||||||||||||||||||||||
| OAKVILLE SE WPCP | ||||||||||||||||||||||||||||||||||||||||||||||||||||||||||||
|---|---|---|---|---|---|---|---|---|---|---|---|---|---|---|---|---|---|---|---|---|---|---|---|---|---|---|---|---|---|---|---|---|---|---|---|---|---|---|---|---|---|---|---|---|---|---|---|---|---|---|---|---|---|---|---|---|---|---|---|---|
| Climate chart (explanation) | ||||||||||||||||||||||||||||||||||||||||||||||||||||||||||||
| ||||||||||||||||||||||||||||||||||||||||||||||||||||||||||||
| ||||||||||||||||||||||||||||||||||||||||||||||||||||||||||||
| Climate data for Burlington TS Climate ID: 6151064; coordinates 43°20′N 79°50′W, elevation: 99.1 m (325 ft); 1981–2010 normals, extremes 1866–present[note 1] | |||||||||||||
|---|---|---|---|---|---|---|---|---|---|---|---|---|---|
| Month | Jan | Feb | Mar | Apr | May | Jun | Jul | Aug | Sep | Oct | Nov | Dec | Year |
| Record high °C (°F) | 18.4 (65.1) |
17.9 (64.2) |
27.2 (81.0) |
32.0 (89.6) |
36.1 (97.0) |
38.9 (102.0) |
41.1 (106.0) |
38.3 (100.9) |
37.8 (100.0) |
31.1 (88.0) |
26.7 (80.1) |
22.0 (71.6) |
41.1 (106.0) |
| Average high °C (°F) | −0.6 (30.9) |
0.8 (33.4) |
5.2 (41.4) |
12.4 (54.3) |
19.4 (66.9) |
25.0 (77.0) |
28.0 (82.4) |
26.7 (80.1) |
21.8 (71.2) |
15.1 (59.2) |
8.0 (46.4) |
2.4 (36.3) |
13.7 (56.7) |
| Daily mean °C (°F) | −4.4 (24.1) |
−3.2 (26.2) |
1.0 (33.8) |
7.5 (45.5) |
13.9 (57.0) |
19.4 (66.9) |
22.5 (72.5) |
21.4 (70.5) |
16.9 (62.4) |
10.4 (50.7) |
4.4 (39.9) |
−1 (30) |
9.1 (48.4) |
| Average low °C (°F) | −8.1 (17.4) |
−7.1 (19.2) |
−3.3 (26.1) |
2.6 (36.7) |
8.3 (46.9) |
13.8 (56.8) |
16.9 (62.4) |
16.1 (61.0) |
11.9 (53.4) |
5.7 (42.3) |
0.7 (33.3) |
−4.3 (24.3) |
4.4 (39.9) |
| Record low °C (°F) | −30.6 (−23.1) |
−29.4 (−20.9) |
−27.2 (−17.0) |
−14.4 (6.1) |
−7.2 (19.0) |
0.0 (32.0) |
1.1 (34.0) |
1.7 (35.1) |
−3.9 (25.0) |
−11.1 (12.0) |
−22.8 (−9.0) |
−27.8 (−18.0) |
−30.6 (−23.1) |
| Average precipitation mm (inches) | 66.0 (2.60) |
54.5 (2.15) |
61.6 (2.43) |
70.6 (2.78) |
81.0 (3.19) |
69.1 (2.72) |
75.3 (2.96) |
82.0 (3.23) |
83.1 (3.27) |
71.9 (2.83) |
84.9 (3.34) |
63.0 (2.48) |
863.1 (33.98) |
| Average rainfall mm (inches) | 31.8 (1.25) |
33.0 (1.30) |
44.7 (1.76) |
68.2 (2.69) |
81.0 (3.19) |
69.1 (2.72) |
75.3 (2.96) |
82.0 (3.23) |
83.1 (3.27) |
71.9 (2.83) |
79.7 (3.14) |
43.5 (1.71) |
763.3 (30.05) |
| Average snowfall cm (inches) | 34.2 (13.5) |
21.5 (8.5) |
16.9 (6.7) |
2.4 (0.9) |
0.0 (0.0) |
0.0 (0.0) |
0.0 (0.0) |
0.0 (0.0) |
0.0 (0.0) |
0.0 (0.0) |
5.3 (2.1) |
19.5 (7.7) |
99.9 (39.3) |
| Average precipitation days (≥ 0.2 mm) | 12.4 | 9.6 | 11.0 | 12.5 | 11.8 | 10.9 | 10.1 | 10.2 | 10.9 | 10.7 | 13.9 | 11.9 | 135.8 |
| Average rainy days (≥ 0.2 mm) | 4.9 | 4.5 | 8.0 | 11.7 | 11.8 | 10.9 | 10.1 | 10.2 | 10.9 | 10.7 | 12.7 | 7.7 | 113.9 |
| Average snowy days (≥ 0.2 cm) | 8.1 | 6.0 | 3.6 | 0.84 | 0.0 | 0.0 | 0.0 | 0.0 | 0.0 | 0.0 | 1.6 | 5.4 | 25.5 |
| Source: Environment Canada[23][24] | |||||||||||||
| Climate data for Georgetown WWTP (Halton Hills) Climate ID: 6152695; coordinates 43°28′34″N 79°52′45″W; elevation: 221 m (725 ft); 1981–2010 normals | |||||||||||||
|---|---|---|---|---|---|---|---|---|---|---|---|---|---|
| Month | Jan | Feb | Mar | Apr | May | Jun | Jul | Aug | Sep | Oct | Nov | Dec | Year |
| Record high °C (°F) | 17.0 (62.6) |
15.5 (59.9) |
25.0 (77.0) |
31.5 (88.7) |
34.5 (94.1) |
36.0 (96.8) |
37.0 (98.6) |
36.5 (97.7) |
35.5 (95.9) |
29.5 (85.1) |
22.0 (71.6) |
20.5 (68.9) |
37.0 (98.6) |
| Average high °C (°F) | −1.7 (28.9) |
−0.2 (31.6) |
4.6 (40.3) |
12.1 (53.8) |
19.1 (66.4) |
24.4 (75.9) |
26.9 (80.4) |
25.8 (78.4) |
21.4 (70.5) |
14.3 (57.7) |
7.3 (45.1) |
1.1 (34.0) |
12.9 (55.2) |
| Daily mean °C (°F) | −6.3 (20.7) |
−5.2 (22.6) |
−0.9 (30.4) |
6.0 (42.8) |
12.3 (54.1) |
17.4 (63.3) |
20.0 (68.0) |
19.0 (66.2) |
14.8 (58.6) |
8.4 (47.1) |
2.8 (37.0) |
−2.9 (26.8) |
7.1 (44.8) |
| Average low °C (°F) | −10.9 (12.4) |
−10.2 (13.6) |
−6.4 (20.5) |
−0.2 (31.6) |
5.3 (41.5) |
10.4 (50.7) |
13.0 (55.4) |
12.1 (53.8) |
8.1 (46.6) |
2.4 (36.3) |
−1.7 (28.9) |
−6.9 (19.6) |
1.3 (34.3) |
| Record low °C (°F) | −33.0 (−27.4) |
−31.5 (−24.7) |
−28.0 (−18.4) |
−13.0 (8.6) |
−5.0 (23.0) |
−0.5 (31.1) |
3.0 (37.4) |
0.0 (32.0) |
−4.0 (24.8) |
−8.5 (16.7) |
−15.5 (4.1) |
−29.5 (−21.1) |
−33.0 (−27.4) |
| Average precipitation mm (inches) | 67.8 (2.67) |
60.0 (2.36) |
57.2 (2.25) |
76.5 (3.01) |
79.3 (3.12) |
74.8 (2.94) |
73.5 (2.89) |
79.3 (3.12) |
86.2 (3.39) |
68.3 (2.69) |
88.5 (3.48) |
65.9 (2.59) |
877.4 (34.54) |
| Average rainfall mm (inches) | 29.7 (1.17) |
28.4 (1.12) |
35.2 (1.39) |
71.3 (2.81) |
79.0 (3.11) |
74.8 (2.94) |
73.5 (2.89) |
79.3 (3.12) |
86.2 (3.39) |
67.8 (2.67) |
79.9 (3.15) |
36.4 (1.43) |
741.5 (29.19) |
| Average snowfall cm (inches) | 38.1 (15.0) |
31.7 (12.5) |
22.1 (8.7) |
5.2 (2.0) |
0.3 (0.1) |
0.0 (0.0) |
0.0 (0.0) |
0.0 (0.0) |
0.0 (0.0) |
0.5 (0.2) |
8.6 (3.4) |
29.5 (11.6) |
135.9 (53.5) |
| Average precipitation days (≥ 0.2 mm) | 12.6 | 9.4 | 10.6 | 12.4 | 11.9 | 11.2 | 10.6 | 10.6 | 11.7 | 12.3 | 13.3 | 12.3 | 138.9 |
| Average rainy days (≥ 0.2 mm) | 4.1 | 4.1 | 6.4 | 11.6 | 11.8 | 11.2 | 10.6 | 10.6 | 11.7 | 12.2 | 11.4 | 6.5 | 112.1 |
| Average snowy days (≥ 0.2 cm) | 9.4 | 6.2 | 4.8 | 1.4 | 0.04 | 0.0 | 0.0 | 0.0 | 0.0 | 0.27 | 2.5 | 6.9 | 31.5 |
| Source: Environment Canada[25] | |||||||||||||
| Climate data for Oakville Southeast WPCP Climate ID: 615N745; coordinates 43°29′N 79°38′W; elevation: 86.9 m (285 ft); 1981–2010 normals | |||||||||||||
|---|---|---|---|---|---|---|---|---|---|---|---|---|---|
| Month | Jan | Feb | Mar | Apr | May | Jun | Jul | Aug | Sep | Oct | Nov | Dec | Year |
| Record high °C (°F) | 13.9 (57.0) |
15.6 (60.1) |
27.5 (81.5) |
32.0 (89.6) |
33.0 (91.4) |
38.0 (100.4) |
37.0 (98.6) |
37.5 (99.5) |
35.0 (95.0) |
28.9 (84.0) |
23.3 (73.9) |
22.0 (71.6) |
38.0 (100.4) |
| Average high °C (°F) | −0.4 (31.3) |
0.6 (33.1) |
4.7 (40.5) |
11.3 (52.3) |
17.9 (64.2) |
23.2 (73.8) |
26.3 (79.3) |
25.2 (77.4) |
20.9 (69.6) |
14.3 (57.7) |
8.3 (46.9) |
2.8 (37.0) |
12.9 (55.2) |
| Daily mean °C (°F) | −4.7 (23.5) |
−3.9 (25.0) |
0.1 (32.2) |
6.4 (43.5) |
12.3 (54.1) |
17.7 (63.9) |
20.9 (69.6) |
20.1 (68.2) |
15.6 (60.1) |
9.3 (48.7) |
4.0 (39.2) |
−1.3 (29.7) |
8.1 (46.6) |
| Average low °C (°F) | −8.9 (16.0) |
−8.3 (17.1) |
−4.5 (23.9) |
1.5 (34.7) |
6.8 (44.2) |
12.1 (53.8) |
15.4 (59.7) |
15.0 (59.0) |
10.2 (50.4) |
4.3 (39.7) |
−0.2 (31.6) |
−5.5 (22.1) |
3.2 (37.8) |
| Record low °C (°F) | −30.0 (−22.0) |
−25.0 (−13.0) |
−22.0 (−7.6) |
−14.4 (6.1) |
−3.3 (26.1) |
1.1 (34.0) |
7.0 (44.6) |
3.0 (37.4) |
−1.7 (28.9) |
−7.0 (19.4) |
−14.0 (6.8) |
−27.0 (−16.6) |
−30.0 (−22.0) |
| Average precipitation mm (inches) | 59.8 (2.35) |
46.7 (1.84) |
54.4 (2.14) |
65.2 (2.57) |
73.9 (2.91) |
71.0 (2.80) |
75.8 (2.98) |
78.3 (3.08) |
73.5 (2.89) |
70.0 (2.76) |
79.3 (3.12) |
58.8 (2.31) |
806.7 (31.76) |
| Average rainfall mm (inches) | 31.5 (1.24) |
30.7 (1.21) |
37.2 (1.46) |
63.1 (2.48) |
73.9 (2.91) |
71.0 (2.80) |
75.8 (2.98) |
78.3 (3.08) |
73.5 (2.89) |
70.0 (2.76) |
76.8 (3.02) |
43.9 (1.73) |
725.6 (28.57) |
| Average snowfall cm (inches) | 28.3 (11.1) |
16.1 (6.3) |
17.2 (6.8) |
2.1 (0.8) |
0.0 (0.0) |
0.0 (0.0) |
0.0 (0.0) |
0.0 (0.0) |
0.0 (0.0) |
0.0 (0.0) |
2.5 (1.0) |
14.9 (5.9) |
81.0 (31.9) |
| Average precipitation days (≥ 0.2 mm) | 9.6 | 7.2 | 9.0 | 11.1 | 10.4 | 10.3 | 8.8 | 9.8 | 10.2 | 10.4 | 11.1 | 9.7 | 117.6 |
| Average rainy days (≥ 0.2 mm) | 4.4 | 3.8 | 6.4 | 10.6 | 10.4 | 10.3 | 8.8 | 9.8 | 10.2 | 10.4 | 10.6 | 6.8 | 102.4 |
| Average snowy days (≥ 0.2 cm) | 5.6 | 3.7 | 3.2 | 0.7 | 0.0 | 0.0 | 0.0 | 0.0 | 0.0 | 0.0 | 1.0 | 3.4 | 17.6 |
| Source: Environment Canada[26] | |||||||||||||
See also
- List of municipalities in Ontario
- Halton Region Conservation Authority
- Halton District School Board
- Halton Catholic District School Board
- List of numbered roads in Halton Region
- List of secondary schools in Ontario#Regional Municipality of Halton
Notes
- Long term records have been recorded at various climate stations in or nearby Burlington since 1866
References
- "Regional Municipality of Halton". Geographical Names Data Base. Natural Resources Canada.
- "Regional Municipality of Halton". Geographical Names Data Base. Natural Resources Canada.
- "Halton Regional municipality census profile". 2011 Census of Population. Statistics Canada. Retrieved 2012-03-26.
- Halton Region Ranked Safest Place to Live in GTA, Top 5 in Canada
- Regional Municipality of Halton Act, 1973, S.O. 1973, c. 70
- Municipal Act, 2001, S.O. 2001, c. 25
- "Annual Fincncial Report 2018". Halton Region. 27 March 2019. Retrieved 13 November 2019.
- "Halton. Regional Municipality of Halton - Halton Regional Centre". Health Line. 15 July 2017. Retrieved 13 November 2019.
- "Annual Fincncial Report 2018". Halton Region. 27 March 2019. Retrieved 13 November 2019.
- "Population and dwelling counts: Canada and census divisions". Statistics Canada. February 9, 2022. Retrieved April 2, 2022.
- "2021 Community Profiles". 2021 Canadian Census. Statistics Canada. February 4, 2022. Retrieved 2022-04-27.
- "2016 Community Profiles". 2016 Canadian Census. Statistics Canada. August 12, 2021. Retrieved 2020-11-05.
- "2011 Community Profiles". 2011 Canadian Census. Statistics Canada. March 21, 2019. Retrieved 2012-02-08.
- "2006 Community Profiles". 2006 Canadian Census. Statistics Canada. August 20, 2019.
- "2001 Community Profiles". 2001 Canadian Census. Statistics Canada. July 18, 2021.
- "Census Profile, 2016 Census Halton, Regional municipality [Census division], Ontario and Ontario [Province]". Statistics Canada.
- "2006 Agricultural community profile". Retrieved 2012-02-15.[permanent dead link]
- "Annual Financial Report 2018". Halton Region. 27 March 2019. Retrieved 13 November 2019.
- "Plant Hardiness Zones of Canada". Archived from the original on 2009-07-17. Retrieved 2009-07-17.
- "Canadian Climate Normals 1971-2000". Environment Canada. Retrieved February 15, 2012.
- "Canadian Climate Normals 1971-2000". Environment Canada. Retrieved February 15, 2012.
- "Canadian Climate Normals 1971-2000". Environment Canada. Retrieved February 15, 2012.
- "Burlington TS". Canadian Climate Normals 1981–2010. Environment Canada. Retrieved 2021-10-22.
- "Long Term Climate Extremes for Burlington Area (Virutal Station ID: VSON95V)". Daily climate records (LTCE). Environment Canada. Archived from the original on November 10, 2021. Retrieved November 10, 2021.
- "Georgetown WWTP". Canadian Climate Normals 1981–2010. Environment Canada. Retrieved 2021-10-19.
- "Oakville Southeast WPCP". Canadian Climate Normals 1981–2010. Environment Canada. Retrieved 2013-10-12.
External links
Places adjacent to Regional Municipality of Halton | ||||||||||||||||
|---|---|---|---|---|---|---|---|---|---|---|---|---|---|---|---|---|
| ||||||||||||||||
Greater Toronto Area | ||
|---|---|---|
Largest city: Toronto | ||
| Regions |  | |
| Cities |
| |
| Towns | ||
| Townships |
| |
| Municipalities |
| |
Subdivisions of Ontario | |
|---|---|
| Counties |
|
| Districts |
|
| Regional municipalities | |
| Single-tier municipalities |
|
| Separated municipalities |
|
| Regions |
|
| |
| Authority control |
|
|---|
Другой контент может иметь иную лицензию. Перед использованием материалов сайта WikiSort.org внимательно изучите правила лицензирования конкретных элементов наполнения сайта.
WikiSort.org - проект по пересортировке и дополнению контента Википедии