world.wikisort.org - CanadaBrantford—Brant is a federal electoral district in Ontario, Canada, that has been represented in the House of Commons of Canada from 1904 to 1949 and since 1968.
Federal electoral district in Ontario, Canada
For the provincial electoral district, see Brantford—Brant (provincial electoral district).
Brantford—Brant Ontario electoral district Ontario electoral district |
|---|
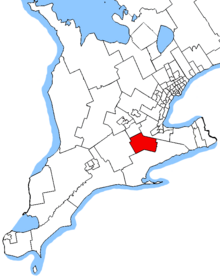 Brantford—Brant in relation to other Ontario electoral districts (2015 boundaries) |
|
| Legislature | House of Commons |
|---|
| MP | Larry Brock
Conservative |
|---|
| District created | 1903 |
|---|
| First contested | 1904 |
|---|
| Last contested | 2021 |
|---|
| District webpage | profile, map |
|---|
|
| Population (2016)[1] | 130,296 |
|---|
| Electors (2015) | 95,616 |
|---|
| Area (km²)[2] | 828.81 |
|---|
| Pop. density (per km²) | 157.2 |
|---|
| Census division(s) | Brant, Haldimand |
|---|
| Census subdivision(s) | Brantford, Brant, New Credit 40A, Six Nations 40 |
|---|
Prior to the 2015 election, the riding was known as Brant.[3]
History
The federal riding was first created in 1903 from parts of Brant South riding. It consisted of the County of Brant, excluding parts included in the Brantford riding.
In 1924, it was defined as consisting of the townships of Burford, South Dumfries, Onondaga, Tuscarora the part of the township of Brantford lying east of the Grand River, and the part of the city of Brantford not included in the electoral district of Brantford City. In 1933, it was expanded to include the town of Paris.
The federal electoral district was abolished in 1947 when it was redistributed between Brant—Wentworth and Brantford ridings.
The federal riding was recreated in 1966 from parts of Brant—Haldimand, Brantford and Haldimand—Norfolk—Brant ridings. It consisted initially of the County of Brant, and the Six Nations and New Credit Indian reserves.
In 1976, it was defined as consisting of the County of Brant. In 1987, it was defined as consisting of the City of Brantford, the Town of Paris, and the townships of Brantford and South Dumfries. In 2003, it was redefined as using the 1966 definition.
Brant was largely incorporated into the new riding of Brantford—Brant, with small territories going to Oxford and Cambridge during the 2012 electoral redistribution.
Demographics
- According to the Canada 2016 Census;
Ethnic groups: 78.3% European, 13.7% Indigenous, 2.6% South Asian, 1.7% Black
Languages: 89.7% English, 1.3% Polish, 1.2% French, 1.0% Italian
Religions: 64.8% Christian (23.4% Catholic, 10.2% United Church, 9.0% Anglican, 5.1% Baptist, 3.3% Presbyterian, 2.5% Pentecostal, 1.1% Lutheran, 10.1% Other), 2.% Traditional Aboriginal Spirituality, 30.3% No religion
Median income (2010): $28,981
Average income (2010): $37,101
Members of Parliament
This riding has elected the following Members of Parliament:
| Parliament |
Years |
Member |
Party |
Brant
Riding created from Brant South |
| 10th |
1904–1908 | | William Paterson | Liberal |
| 11th |
1908–1911 |
| 12th |
1911–1917 | | John Henry Fisher | Conservative |
| 13th |
1917–1921 | | John Harold | Government (Unionist) |
| 14th |
1921–1925 | | William Charles Good | Progressive |
| 15th |
1925–1926 | | Franklin Smoke | Conservative |
| 16th |
1926–1930 |
| 17th |
1930–1935 |
| 18th |
1935–1940 | | George Wood | Liberal |
| 19th |
1940–1945 |
| 20th |
1945–1949 | | John A. Charlton | Progressive Conservative |
| Riding dissolved into Brant—Wentworth and Brantford |
Brant
Riding re-created from Brant—Haldimand and Brantford |
| 28th |
1968–1971 | | James Elisha Brown | Liberal |
| 1971–1972 | | Derek Blackburn | New Democratic |
| 29th |
1972–1974 |
| 30th |
1974–1979 |
| 31st |
1979–1980 |
| 32nd |
1980–1984 |
| 33rd |
1984–1988 |
| 34th |
1988–1993 |
| 35th |
1993–1997 | | Jane Stewart | Liberal |
| 36th |
1997–2000 |
| 37th |
2000–2004 |
| 38th |
2004–2006 | Lloyd St. Amand |
| 39th |
2006–2008 |
| 40th |
2008–2011 | | Phil McColeman | Conservative |
| 41st |
2011–2015 |
| Brantford—Brant |
| 42nd |
2015–2019 | | Phil McColeman | Conservative |
| 43rd |
2019–2021 |
| 44th |
2021–present | Larry Brock |
Election results
Brantford—Brant, 2015–present
Graph of election results in Brantford—Brant (2011-, minor parties that never received 2% of the vote or did not run consistently are omitted)
| 2021 Canadian federal election |
| ** Preliminary results — Not yet official ** |
| Party |
Candidate |
Votes | % | | Expenditures |
|
Conservative | Larry Brock | 26,668 | 40.3 | +0.03 | |
|
Liberal | Alison Macdonald | 18,784 | 28.4 | -2.28 | |
|
New Democratic | Adrienne Roberts | 12,950 | 19.6 | -0.10 | |
|
People's | Cole Squire | 5,634 | 8.5 | +6.52 | |
|
Green | Karleigh Csordas | 1,760 | 2.7 | -3.69 | |
|
Independent | Leslie Bory | 162 | 0.2 | +0.03 | |
|
Independent | John Turmel | 138 | 0.2 | -0.02 | |
| Total valid votes |
66,096 | 100 |
| Total rejected ballots |
0 | 0 | -0.74 |
| Turnout |
66,096 | 59.52 | -2.32 |
| Eligible voters |
111,048 |
|
Conservative hold |
Swing |
+1.16 |
| Source: Elections Canada[4] |
| 2019 Canadian federal election |
| Party |
Candidate |
Votes | % | | Expenditures |
|
Conservative | Phil McColeman | 26,849 | 40.27 | -0.62 | $85,964.44 |
|
Liberal | Danielle Takacs | 20,454 | 30.68 | -0.01 | $112,425.11 |
|
New Democratic | Sabrina Sawyer | 13,131 | 19.70 | -5.14 | $10,388.48 |
|
Green | Bob Jonkman | 4,257 | 6.39 | +3.89 | none listed |
|
People's | Dave Wrobel | 1,320 | 1.98 | – | none listed |
|
Veterans Coalition | Jeffrey Gallagher | 394 | 0.59 | – | none listed |
|
Independent | John Turmel | 146 | 0.22 | -0.04 | $0.00 |
|
Independent | Leslie Bory | 115 | 0.17 | – | $2,115.19 |
| Total valid votes/expense limit |
66,666 | 99.26 |
| Total rejected ballots |
497 | 0.74 | +0.31 |
| Turnout |
67,163 | 61.84 | -3.39 |
| Eligible voters |
108,602 |
|
Conservative hold |
Swing |
-0.30 |
| Source: Elections Canada[5][6] |
| 2015 Canadian federal election |
| Party |
Candidate |
Votes | % | | Expenditures |
|
Conservative | Phil McColeman | 25,874 | 40.89 | -7.52 | $141,798.50 |
|
Liberal | Danielle Takacs | 19,422 | 30.70 | +11.80 | $76,160.00 |
|
New Democratic | Marc Laferriere | 15,715 | 24.84 | -4.11 | $65,824.80 |
|
Green | Kevin Brandt | 1,582 | 2.50 | -0.70 | $6,475.96 |
|
Libertarian | Rob Ferguson | 515 | 0.81 | – | – |
|
Independent | John C. Turmel | 164 | 0.26 | – | – |
| Total valid votes/expense limit |
63,272 | 99.57 | | $241,022.79 |
| Total rejected ballots |
272 | 0.43 | – |
| Turnout |
63,544 | 65.23 | – |
| Eligible voters |
97,409 |
|
Conservative hold |
Swing |
-9.66 |
| Source: Elections Canada[7][8] |
| 2011 federal election redistributed results[9] |
| Party |
Vote |
% |
| |
Conservative | 26,668 | 48.41 |
| |
New Democratic | 15,946 | 28.95 |
| |
Liberal | 10,411 | 18.90 |
| |
Green | 1,756 | 3.20 |
| |
Others | 295 | 0.54 |
Brant, 1968–2015
Graph of election results in Brant (1968-2011, minor parties that never got 2% of the vote or didn't run consistently are omitted)
| 2011 Canadian federal election |
| Party |
Candidate |
Votes | % | | Expenditures |
|
Conservative | Phil McColeman | 28,045 | 48.9 | +7.0 | – |
|
New Democratic | Marc Laferriere | 16,351 | 28.5 | +11.3 | – |
|
Liberal | Lloyd St. Amand | 10,780 | 18.8 | -14.2 | – |
|
Green | Nora Fueten | 1,858 | 3.2 | -3.8 | – |
|
Independent | Leslie Bory | 174 | 0.3 | – | – |
|
Independent | Martin Sitko | 138 | 0.2 | – | – |
| Total valid votes |
57,346 | 100.0 | – |
| Total rejected ballots |
243 | 0.4 | – |
| Turnout |
57,589 | 60.1 | – |
| Eligible voters |
94,485 | – | – |
| 2006 Canadian federal election |
| Party |
Candidate |
Votes | % | |
|
Liberal | Lloyd St. Amand | 22,077 | 36.9 | -1.1 |
|
Conservative | Phil McColeman | 21,495 | 36.0 | +2.9 |
|
New Democratic | Lynn Bowering | 12,713 | 21.3 | -0.7 |
|
Green | Adam King | 2,729 | 4.6 | -0.5 |
|
Christian Heritage | John H. Wubs | 526 | 0.9 | -0.2 |
|
Independent | John Turmel | 213 | 0.4 | -0.3 |
| Total valid votes |
59,753 | 100.0 |
| 2006 Canadian federal election: Brant |
| Party |
Candidate |
Votes | % | | Expenditures |
|
Liberal | Lloyd St. Amand | 22,077 | 36.95 | −1.10 | $73,699 |
|
Conservative | Phil McColeman | 21,495 | 35.97 | +2.87 | $84,866 |
|
New Democratic | Lynn Bowering | 12,713 | 21.28 | −0.72 | $30,536 |
|
Green | Adam King | 2,729 | 4.57 | −0.52 | $4,293 |
|
Christian Heritage | John H. Wubs | 526 | 0.88 | −0.18 | |
|
Independent | John Turmel | 213 | 0.36 | −0.33 | |
| Total valid votes/expense limit |
59,753 | 100.00 | – | $86,871 |
| Total rejected ballots |
236 |
| Turnout |
59,989 | 65.30 | +5.02 |
| Electors on the lists |
91,872 |
| Sources: Official Results, Elections Canada and Financial Returns, Elections Canada. |
| 2004 Canadian federal election: Brant |
| Party |
Candidate |
Votes | % | | Expenditures |
|
Liberal | Lloyd St. Amand | 20,455 | 38.05 | −17.44 | $70,476 |
|
Conservative | Greg Martin | 17,792 | 33.10 | −2.14 | $51,935 |
|
New Democratic | Lynn Bowering | 11,826 | 22.00 | +14.80 | $19,055 |
|
Green | Helen-Anne Embry | 2,738 | 5.09 | +4.05 | $1,800 |
|
Christian Heritage | Barra L. Gots | 570 | 1.06 | | $759 |
|
Independent | John Turmel | 373 | 0.69 | | none listed |
| Total valid votes |
53,754 | 100.00 |
| Total rejected ballots |
303 |
| Turnout |
54,057 | 60.28 | +4.70 |
| Electors on the lists |
89,675 |
| Percentage change figures are factored for redistribution. Conservative Party percentages are contrasted with the combined Canadian Alliance and Progressive Conservative percentages from 2000. |
| Sources: Official Results, Elections Canada and Financial Returns, Elections Canada. |
| 2000 Canadian federal election: Brant |
| Party |
Candidate |
Votes | % | | Expenditures |
|
Liberal | Jane Stewart | 24,068 | 56.42 | – | $46,551 |
|
Alliance | Chris Cattle | 10,955 | 25.68 | | $43,139 |
|
Progressive Conservative | Stephen Kun | 3,580 | 8.39 | | $6,405 |
|
New Democratic | Dee Chisholm | 3,126 | 7.33 | | $9,266 |
|
Green | Graeme Dunn | 484 | 1.13 | | $156 |
|
Canadian Action | Mike Clancy | 447 | 1.05 | | $8,881 |
| Total valid votes/Expense Limit |
42,660 |
100.00 |
|
|
| Total rejected ballots |
262 |
| Turnout |
42,922 | 56.28 |
| Electors on the lists |
76,270 |
| Sources: Official Results, Elections Canada and Financial Returns, Elections Canada. |
| 1997 Canadian federal election |
| Party |
Candidate |
Votes | % | |
|
Liberal | Jane Stewart | 24,125 | 53.0 | +1.5 |
|
Reform | Dan Houssar | 10,436 | 22.9 | -1.8 |
|
Progressive Conservative | Stephen W. Kun | 5,781 | 12.7 | +0.5 |
|
New Democratic | Pat Franklin | 5,201 | 11.4 | +4.5 |
| Total valid votes |
45,543 | 100.0 |
| 1993 Canadian federal election: Brant |
| Party |
Candidate |
Votes | % | | Expenditures |
|
Liberal | Jane Stewart | 24,686 | 51.46 | – | $39,023 |
|
Reform | Ken Edmison | 11,863 | 24.73 | | $36,354 |
|
Progressive Conservative | Mabel E. Dougherty | 5,831 | 12.16 | | $25,624 |
|
New Democratic | Michael C. Smith | 3,317 | 6.92 | | $37,911 |
|
National | Herman Kruis | 1,227 | 2.56 | | $8,148 |
|
Green | Jamie Legacey | 482 | 1.00 | | $0 |
|
Libertarian | Helmut Kurmis | 258 | 0.54 | | $0 |
|
Natural Law | Eleanor Toshiko Hyodo | 192 | 0.40 | | $2,853 |
|
Social Credit | Doug Stelpstra | 112 | 0.23 | | $158 |
| Total valid votes |
47,968 | 100.00 |
| Total rejected ballots |
500 |
| Turnout |
48,468 | 65.27 |
| Electors on the lists |
74,260 |
| Source: Thirty-fifth General Election, 1993: Official Voting Results, Published by the Chief Electoral Officer of Canada. Financial figures taken from official contributions and expenses provided by Elections Canada. |
| 1988 Canadian federal election: Brant |
| Party |
Candidate |
Votes | % | Expenditures |
|
New Democratic | Derek Blackburn | 19,633 | 41.46 | $41,490 |
|
Progressive Conservative | Steve Bosanac | 14,084 | 29.74 | $45,061 |
|
Liberal | David J. Carll | 11,461 | 24.20 | $40,772 |
|
Christian Heritage | Geraldine de Vries | 1,786 | 3.77 | $10,857 |
|
Green | Jamie Legacey | 258 | 0.54 | $0 |
|
Libertarian | Helmut Kurmis | 95 | 0.20 | $299 |
|
Commonwealth of Canada | Barnabas Simon | 34 | 0.07 | $0 |
| Total valid votes |
47,351 | 100.00 |
| Total rejected ballots |
287 |
| Turnout |
47,638 | 71.53 |
| Electors on the lists |
66,603 |
| 1984 Canadian federal election: Brant |
| Party |
Candidate |
Votes | % | |
|
New Democratic | Derek Blackburn | 23,103 | 44.20 | |
|
Progressive Conservative | Rick Sterne | 21,679 | 41.47 | |
|
Liberal | Peter Hexamer | 7,286 | 13.94 |
|
Social Credit | Charley Harris | 207 | 0.40 | |
| Total valid votes |
52,275 |
100.00 |
|
| Total rejected ballots |
266 |
|
|
| Turnout |
52,541 |
73.16 |
|
| Electors on the lists |
71,821 |
|
|
| 1980 Canadian federal election |
| Party |
Candidate |
Votes | % | |
|
New Democratic | Derek Blackburn | 19,194 | 41.1 | -1.1 |
|
Progressive Conservative | Rick Sterne | 14,614 | 31.3 | +0.2 |
|
Liberal | Jo Brennan | 12,725 | 27.2 | +0.7 |
|
Social Credit | Winnifred M. Moyer | 103 | 0.2 | |
|
Marxist–Leninist | Malkit Randhawa | 93 | 0.2 | 0.0 |
| Total valid votes |
46,729 | 100.0 |
| 1979 Canadian federal election |
| Party |
Candidate |
Votes | % | |
|
New Democratic | Derek Blackburn | 20,908 | 42.2 | +0.1 |
|
Progressive Conservative | Arthur Tobey | 15,422 | 31.1 | +11.2 |
|
Liberal | Jack Bawcutt | 13,154 | 26.5 | -11.1 |
|
Marxist–Leninist | Malkit Randhawa | 93 | 0.2 | |
| Total valid votes |
49,577 | 100.0 |
| 1974 Canadian federal election |
| Party |
Candidate |
Votes | % | |
|
New Democratic | Derek Blackburn | 19,453 | 42.1 | -1.0 |
|
Liberal | Vern Young | 17,410 | 37.6 | +5.9 |
|
Progressive Conservative | Alex Keresturi | 9,228 | 20.0 | -5.3 |
|
Communist | Paul F. Jarbeau | 158 | 0.3 | |
| Total valid votes |
46,249 | 100.0 |
| 1972 Canadian federal election |
| Party |
Candidate |
Votes | % | |
|
New Democratic | Derek Blackburn | 20,002 | 43.1 | 0.0 |
|
Liberal | Dick Mundy | 14,730 | 31.7 | -0.5 |
|
Progressive Conservative | Alex Keresturi | 11,711 | 25.2 | +1.3 |
| Total valid votes |
46,443 | 100.0 |
| By-election on May 31, 1971 |
| Party |
Candidate |
Votes |
% |
±% |
|
New Democratic | Derek Blackburn | 17,147 | 43.1 | +12.4 |
|
Liberal | Bob McIntosh | 12,831 | 32.2 | -7.6 |
|
Progressive Conservative | Emory Knill | 9,517 | 23.9 | -5.7 |
|
Social Credit | A.J. Sid Hamelin | 322 | 0.8 | |
| Total valid votes |
39,817 | 100.0 |
| 1968 Canadian federal election |
| Party |
Candidate |
Votes | % |
|
Liberal | James Elisha Brown | 16,029 | 39.8 |
|
New Democratic | Derek Blackburn | 12,333 | 30.6 |
|
Progressive Conservative | Geoff Styles | 11,901 | 29.6 |
| Total valid votes |
40,263 | 100.0 |
Brant, 1904–1949
Graph of election results in Brant (1904-1949, minor parties that never got 2% of the vote or didn't run consistently are omitted)
| 1945 Canadian federal election |
| Party |
Candidate |
Votes | % | |
|
Progressive Conservative | John Alpheus Charlton | 5,005 | 45.3 | -3.9 |
|
Liberal | George Ernest Wood | 4,800 | 43.5 | -7.3 |
|
Co-operative Commonwealth | Charles William Ward | 1,235 | 11.2 | |
| Total valid votes |
11,040 | 100.0 |
| 1940 Canadian federal election |
| Party |
Candidate |
Votes | % | |
|
Liberal | George Wood | 4,657 | 50.8 | +6.3 |
|
National Government | Syl Apps | 4,519 | 49.2 | +12.1 |
| Total valid votes |
9,176 | 100.0 |
Note: "National Government" vote is compared to Conservative vote in 1935 election.
| 1935 Canadian federal election |
| Party |
Candidate |
Votes | % | |
|
Liberal | George Ernest Wood | 4,294 | 44.5 | -1.7 |
|
Conservative | Franklin Smoke | 3,587 | 37.2 | -16.7 |
|
Reconstruction | Cuthbert Mainwaring Burt | 1,277 | 13.2 | |
|
Co-operative Commonwealth | William James Anderson | 494 | 5.1 | |
| Total valid votes |
9,652 | 100.0 |
| 1930 Canadian federal election |
| Party |
Candidate |
Votes | % | |
|
Conservative | Franklin Smoke | 5,094 | 53.8 | +2.9 |
|
Liberal | John Harold | 4,372 | 46.2 | -2.9 |
| Total valid votes |
9,466 | 100.0 |
| 1926 Canadian federal election |
| Party |
Candidate |
Votes | % | |
|
Conservative | Franklin Smoke | 4,218 | 50.9 | -5.8 |
|
Liberal–Progressive | Thomas Scott Davidson | 4,065 | 49.1 | +5.8 |
| Total valid votes |
8,283 | 100.0 |
| 1925 Canadian federal election |
| Party |
Candidate |
Votes | % | |
|
Conservative | Franklin Smoke | 4,151 | 56.7 | +17.8 |
|
Progressive | Edgar Howard Standing | 3,173 | 43.3 | +2.5 |
| Total valid votes |
7,324 | 100.0 |
| 1921 Canadian federal election |
| Party |
Candidate |
Votes | % | |
|
Progressive | William Charles Good | 3,309 | 40.8 | +2.0 |
|
Conservative | William Harper Reid | 3,150 | 38.9 | +0.1 |
|
Liberal | Robert John Atkin | 1,645 | 20.3 | -3.6 |
| Total valid votes |
8,104 | 100.0 |
Note: Conservative vote is compared to Unionist vote in 1917 election, and Liberal vote is compared to Opposition vote.
| 1917 Canadian federal election |
| Party |
Candidate |
Votes | % | |
|
Government (Unionist) | John Harold | 2,106 | 38.8 | -13.1 |
|
Independent | Henry Cockshutt | 2,023 | 37.3 | |
|
Opposition (Laurier Liberals) | Blackwell Lawrence Doran | 1,299 | 23.9 | -24.2 |
| Total valid votes |
5,428 | 100.0 |
Note: Unionist vote is compared to Conservative vote in 1911 election.
| 1911 Canadian federal election |
| Party |
Candidate |
Votes | % | |
|
Conservative | John Henry Fisher | 1,795 | 51.9 | +5.5 |
|
Liberal | William Paterson | 1,666 | 48.1 | -5.5 |
| Total valid votes |
3,461 | 100.0 |
| 1908 Canadian federal election |
| Party |
Candidate |
Votes | % | |
|
Liberal | William Paterson | 1,799 | 53.7 | -4.8 |
|
Conservative | John Patrick Noonan | 1,554 | 46.3 | |
| Total valid votes |
3,353 | 100.0 |
| 1904 Canadian federal election |
| Party |
Candidate |
Votes | % |
|
Liberal | William Paterson | 1,628 | 58.4 |
|
Unknown | Adam George Ludlow | 1,158 | 41.6 |
| Total valid votes |
2,786 | 100.0 |
See also
- List of Canadian federal electoral districts
- Past Canadian electoral districts
References
Notes
External links
Federal ridings in Midwestern Ontario |
|---|
| Liberal | |
|---|
| Conservative | |
|---|
| Green | |
|---|
Federal ridings in Ontario |
|---|
Central
Ontario | |
|---|
Eastern
Ontario | |
|---|
S Durham
& York | |
|---|
City of Toronto
(Suburbs & Downtown) | |
|---|
Cities of
Brampton &
Mississauga | |
|---|
Southern
Halton,
Hamilton
and Niagara | | Southwestern Halton | |
|---|
| City of Hamilton | |
|---|
| Niagara | |
|---|
|
|---|
Midwestern
Ontario | |
|---|
Northern
Ontario | |
|---|
Southwestern
Ontario | |
|---|
| Ottawa |
- Carleton
- Kanata—Carleton
- Nepean
- Orléans
- Ottawa Centre
- Ottawa South
- Ottawa—Vanier
- Ottawa West—Nepean
|
|---|
- See also: Former ridings in Ontario
- Provincial ridings in Ontario
|
Текст в блоке "Читать" взят с сайта "Википедия" и доступен по лицензии Creative Commons Attribution-ShareAlike; в отдельных случаях могут действовать дополнительные условия.
Другой контент может иметь иную лицензию. Перед использованием материалов сайта WikiSort.org внимательно изучите правила лицензирования конкретных элементов наполнения сайта.
2019-2026
WikiSort.org - проект по пересортировке и дополнению контента Википедии
